

Analys
Prices pull back as market awaits OPEC+ and demand signals


The Brent crude oil August contract traded briefly above the $40/bl line yesterday but has now pulled back again as the market is awaiting a decision by OPEC+ whether to roll current cuts of 9.7 m bl/d beyond June. We think that there is a better than even chance for this happening but a final decision is probably not available before mid-June as the group struggles with how to whip cheaters into line. Current demand signals from the US are also weak but will most definitely strengthen again at some point in time in the coming months. Crude oil prices are pulling back awaiting OPEC+ and demand signals. Use the opportunity to buy 2021.

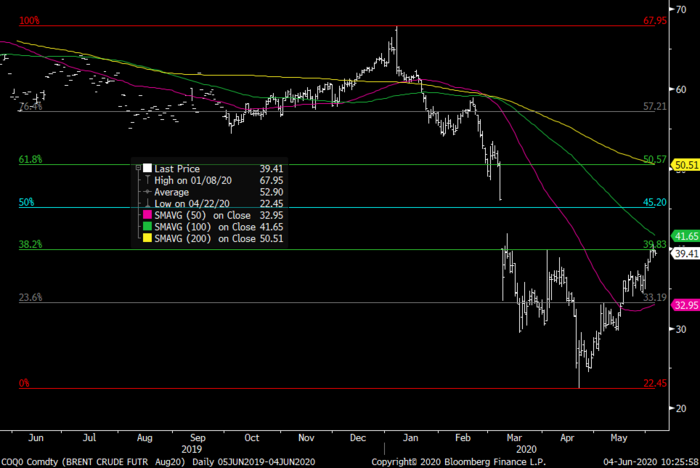
The Brent crude August contract has had a great run from its lowest quote in late April of $22.45/bl to a close yesterday of $39.79/bl which is just below the 38.2% Fibonacci retracement level. The rally has been supported by both a revival in demand as well as a sharp reduction in supply. Both of these two forces are now being placed into question. US shale oil players are contemplating a reopening of shale oil wells which were closed when demand and prices crashed. OPEC+ is scheduled to bring back supply from July unless current discord can be overcome while recent demand indications in the US published this week were weakening for a third week in a row with total products delivered down 22.5% YoY. There is thus quite a bit of headwind right now to propel the Brent crude oil price above and beyond the $40/bl line for now.
All eyes are now naturally focused on OPEC+ and their deliberations over what to do in July. Reduce cuts from 9.7 m bl/d in May and June to 7.7 m bl/d in July and H2 overall as planned or roll current cuts of 9.7 m bl/d forward for an additional 1-3 months’ time. Saudi Arabia, Kuwait and UAE have also had an additional 1.2 m bl/d of above target cuts in June which might be cancelled in July.
Saudi Arabia and Russia indicatively seems to be willing to roll current cuts forward for another 1-3 months’ time but limited compliance to the agreement in April has become a significant stumbling block with Nigeria and Iraq the two biggest offenders. Unless these offenders can be reined in there is not going to be any forward rolling of current cuts of 9.7 m bl/d.
The proposed early OPEC meeting on the 4th of June has been ditched and now the originally planned meeting on June 9 to 10 is probably being shifted out in time to mid-June. This to review more data on compliance as Saudi Arabia is getting ready for hard-ball negotiations with OPEC-cheats. Without guarantees of full compliance Russia is unlikely to come along rolling cuts of 9.7 m bl/d forward into July. Not only are cheaters being pushed to fully comply with the deal going forward but they are also asked to make up for what they did not deliver in May and June by additional deeper cuts in July and August. That sounds like a very tall order. Our first instinctive reaction: this will never happen.
We don’t hold a strong view over whether current cuts of 9.7 m bl/d will be rolled forward for another 1-3 months or not. Maybe, maybe not. What we shouldn’t forget here is what happened on the 6th of March when Russia and Saudi Arabia fell apart as Saudi wanted to chase prices higher through further cuts while Russia was getting sick of cutting and just wanted to get back to business as usual. This underlying conflict is still there between the two parties in OPEC+ as it originates from the fact that Saudi Arabia has a presumed social break-even oil price of $80-85/bl while Russia’s is closer to $40/bl. As such they naturally get different goals and strategies with Russia favouring volume growth at an oil price in the range of $45-55/bl (if that is the oil price in a shale oil world) while Saudi Arabia unavoidably wants to chase prices to $60-70-80/bl through production cuts.
Saudi Arabia can and probably must at some point in time shift its social break-even oil price from current $80-85/bl and down towards $50/bl by increasing exports by 30-40% while cutting budget spending by 20-30%. This is also the messages that Muhammed bin Salman gave to Saudi Aramco and state departments following the break-down with Russia on the 6th of March this year. Though Covid-19, demand collapse and Donald Trump’s political pressure later forced Russia and Saudi to cooperate again.
Saudi Arabia and Russia’s interests are probably aligned as long as the oil price is below $40-45/bl, shale oil production is deteriorating while global oil demand is significantly below normal. But once we get to $50/bl, US shale oil wells are re-started, drilling rig count is ticking higher and global demand is moving closer to normal then we think that the dividing line between Russia and Saudi Arabia again is likely to re-emerge.
Russia is happy with an oil price around the $50/bl mark and wants to get its volumes back into the market again at such a price level rather than to see that US shale again starts to eat away at its market share.
It is very difficult for us to understand why OPEC+ agreed in late April to hold production cuts all to the end of April 2022. By doing so the group will give US shale oil producers all the time in the world to shape up, get bankruptcies out of the way and rebound production to the extent that oil prices allow it to do. This is the same recipe and the same mistake that OPEC+ did through 2017,18,19 when it held medium cuts for a long time. This gave US shale oil producers all the runway in the world to ramp up production. Getting its production cuts back into the market became forever impossible without crashing the oil price and Russia was caught in forever lasting cut agreement.
A much better solution would be to cut hard, deep and fast. As such we support a solution where current cuts of 9.7 m bl/d are rolled forward for another 3-6 months. But it should be coupled with the message that cuts will thereafter rapidly be placed back into the market through Q1/Q2 2021.
In this way US shale oil players will not have time to revive production other than to place closed wells back into operation. There won’t be a good reason to ramp up shale oil drilling and fracking either because OPEC+’ volumes will be placed back into the market again already in H1-2021.
As such we are inclined to believe that there is probably a better than even chance that OPEC+ will roll its current cuts of 9.7 m bl/d forward to July, August,.. rather than to reduce cuts down to the originally planned 7.7 m bl/d cuts.
For now oil prices are pulling back awaiting a decision by OPEC+. The Brent crude August contract could easily pull back towards the $35-36/bl level but would definitely rebound up and above the $40/bl line again if OPEC+ decides to roll the 9.7 m bl/d cuts forward beyond June. Stronger demand revival signals would also be welcome. They will come for sure. Peak oil demand? Not at all yet. We will move back up to 100 m bl/d again and above. Just a matter of time.
The Brent crude oil August contract closed just a fraction below the 38.2% Fibonacci retracement level yesterday. Now pulling back on weakness in US demand signals as well as awaiting a decision by OPEC+
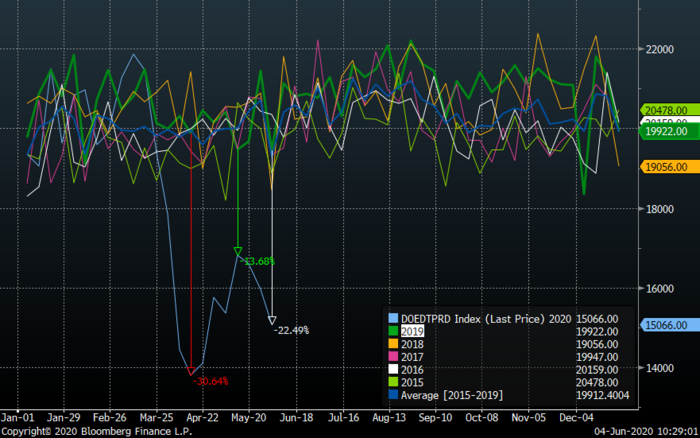
Total US products delivered has dissapointed now three weeks in a row. It all looked good in terms of demand revival until mid-May but since then it has been a sad story
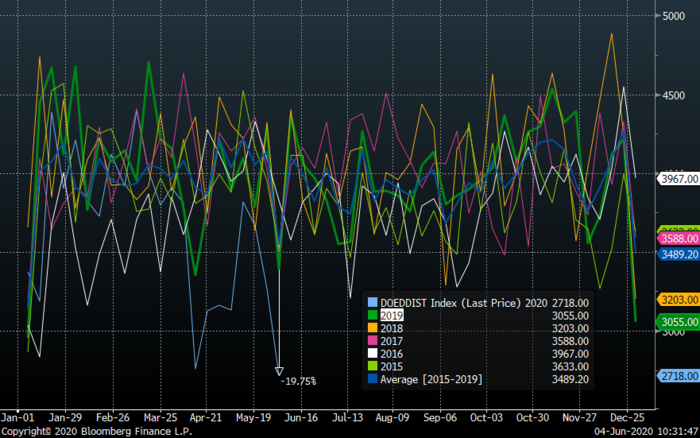
It is deliveries of US mid-dist products which is the weakness here. That is typically diesel and jet fuel.
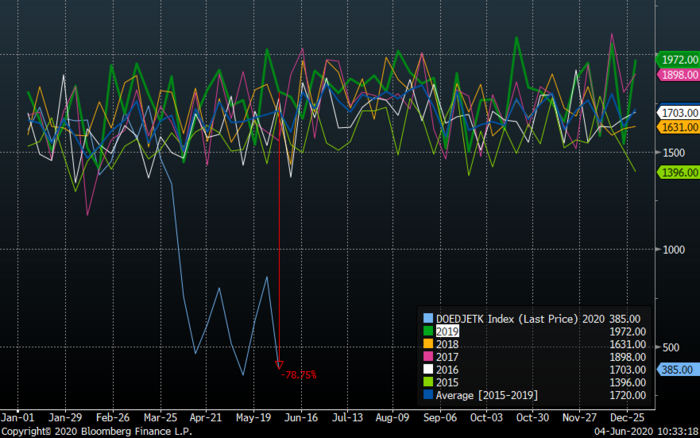
Deliveries of jet fuel in the US is still down 79% YoY. No solid signal of rebound yet there.
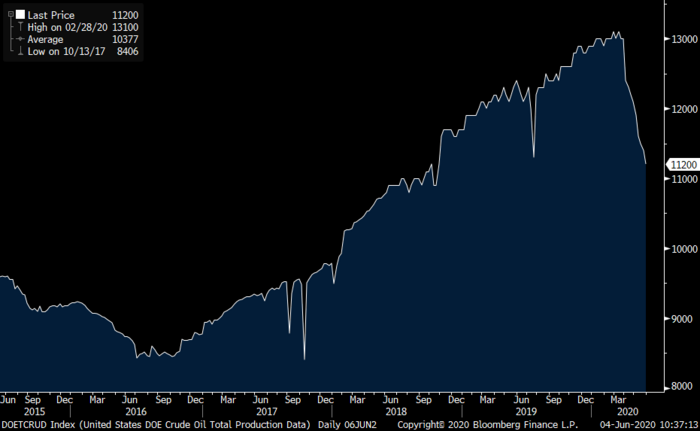
US crude oil continues to fall sharply in a combination of structural decline and deliberate shutting of wells. The underlying losses in US shale oil crude and NGL production in the US is in the range of 600 – 800 k bl/d per month. Currently there are only 222 active oil rigs in the US. These have an implied productive effect of about 165 k bl/d per month of new supply if all the wells they produce are placed into production (probably not done now). There is thus a significant ongoing structural decline in the US of up to 400 – 600 k bl/d per month today.
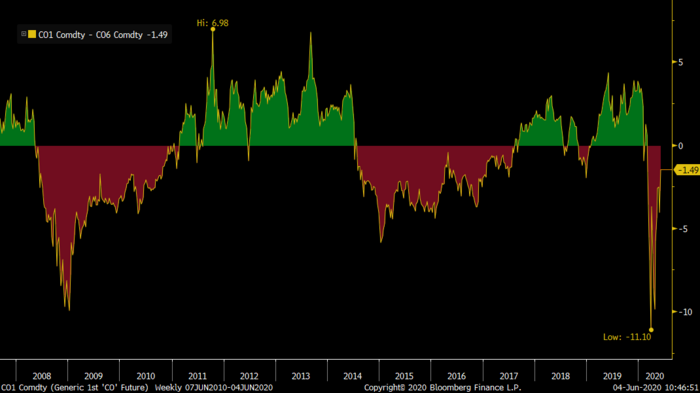
The Brent crude oil time spread of the 1 month minus the 6 month contract. The contango moved deeper than in 2009 but has come back faster. The front-month Brent contract has actually been in backwardation vs the second contract briefly in intraday trading lately. If cuts of 9.7 m bl/d are rolled forward beyond June then market is likely to move into deficit, inventories drawing down and poff we are back in backwardation.
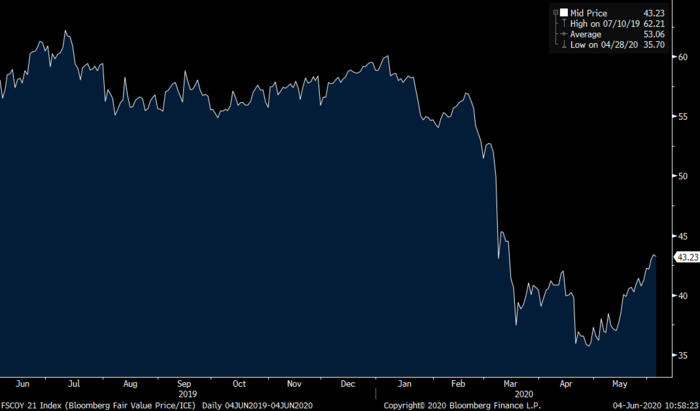
The current set back in crude oil prices can provide yet another chance to purchase forward Brent crude for 2021 average delivery at very low, favorable price levels. We strongly advised our clients to purchase crude and oil products when the forward Brent 2021 contract traded in the range of $35-40/bl. We still view low-40ies as a very favorable level.
Market is starting to take US/Iran headlines with a pinch of salt. Brent crude rose $2.8/b yesterday to an official close of $112.1/b. But after that it traded as low as $108.05/b before ending late night at around $109.7/b. Through the day it traded in a range of $106.87 – 112.72/b amid a flurry of news or rumors from Iran and the US. ”US temporary sanctions during negotiations” (falls alarm). ”We will bomb Iran” (not anyhow),… etc. While the market is still fluctuating to this kind of news flow, it is starting to take such headlines with a pinch of salt.

We’ll see. Maybe, maybe not. The Brent M1 contract is trading at $110.2/b this morning which very close to the average ticks through yesterday of $110.4/b.
Trump with bearish, verbal intervention whenever Brent trades above $110/b it seems. What seems to be a pattern is that Trump states something like ”very good negotiations going on with Iran”, ”New leaders in Iran are great,..”, ”Great progress in negotiations,…”, ”Deal in sight,..” etc whenever the Brent M1 contract trades above $110/b. An effort to cool the market. These hot air verbal interventions from Trump used to have a heavy bearish impact on prices, but they now seems to have less and less effect unless they are backed by reality.
As far as we can see there has been no real progress in the negotiations between the US and Iran with both sides still standing by their previous demands.
Iran is getting stronger while the cease fire lasts making a return to war for Trump yet harder. Iran is naturally in constant preparation for a return to war given Trump’s steady threats of bombing Iran again. Iran is naturally doing what ever is possible to prepare for a return to war. And every day the cease fire lasts it is better prepared. This naturally makes it more and more difficult and dangerous for the US to return to warring activity versus Iran as the consequences for energy infrastructure in the Persian Gulf will be more and more severe the longer the cease fire lasts. Israel seems to see it this way as well. That the war is not won and that current frozen state of a cease fire gives Iran opportunity to rebuild military and politically.
Global inventories are drawing down day by day. How much? In the meantime the Strait of Hormuz stays closed. There is varying measures and estimates of how much global inventories are drawing down. Our rough estimate, back of the envelope, is that global inventories are drawing down by at least some 10 mb/d or about 300 mb/d in a balance between loss of supply versus demand destruction. Other estimates we see are a monthly draw of 250-270 mb/d. The IEA only ’measured’ a draw in global observable stocks of 117 mb in April with oil on water rising 53 mb while on shore stocks fell 170 mb. But global stocks are hard to measure with large invisible, unmeasured stocks. As such a back of the envelope approach may be better.
Oil products is what the world is consuming. Oil product prices likely to rise while product stocks fall. Strategic Petroleum Reserves (SPR) are predominantly crude oil. Discharging oil from OECD SPR stocks, a sharp reduction in Chinese crude imports and a reduction in global refinery throughput of 6-7 mb/d has helped to keep crude oil markets satisfactorily supplied. But global inventories are drawing down none the less. And oil products is really what the world is consuming. So if global refinery throughput stays subdued, then demand will eventually have to match the supply of oil products. The likely path forward this summer is a steady draw down in jet fuel, diesel and gasoline. Higher prices for these. Then, if possible, higher refinery throughput and higher usage of crude in response to very profitable refinery margins. And lastly sharper draw in crude stocks and higher prices for these. But some 6 mb/d of oil products used to be exported through the Strait of Hormuz. And it may not be so easy to ramp up refinery activity across the world to compensate. Especially as Ukraine continues to damage Russian refineries as well as Russian crude production and export facilities.
Watch oil product stocks and prices as well as Brent calendar 2027. What to watch for this summer is thus oil product inventories falling and oil product premiums to crude rising. Another measure to watch is the Brent crude 2027 contract as it rises steadily day by day as the Strait of Hormuz stays closed and global oil inventories decline. The latter is close to the highest level since the start of the war and keeps rising.
The Brent M1 contract and the Brent 2027 prices and current price of jet fuel in Europe (ARA). All in USD/b

Our back of the envelope calculation of the global shortage created by the closure of the Strait of Hormuz. Note that 3.5 mb/d of discharge from SPR is also a draw. Note also that ’Forced demand loss’ of 2.5 mb/d is probably temporary and will fall back towards zero as logistics are sorted out leaving ’Price demand loss’ to do the job of balancing the market. Thus a shortfall of at least 9 mb/d created by the closure. More if SPR discharge is included and more if Forced demand loss recedes.

Brent is climbing higher. Front-month is at USD 106.3/bl this morning, close to a weekly high and a USD 9/bl jump from Mondays open. This is the move we flagged as a risk earlier in the week: the market shifting from ”a deal is around the corner” to ”this is going to take longer than we thought”.

Analyst Commodities, SEB
During April, rest-of-year Brent remained remarkably stable around USD 90/bl. A stability which rested on one single assumption: the SoH reopens around 1 May. That assumption is now slowly falling apart.
As we highlighted yesterday: every week of delay beyond 1 May adds (theoretically) ish USD 5/bl to the rest-of-year average, as global inventories draw 100 million barrels per week. i.e., a mid-May reopening implies rest-of-year Brent closer to USD 100/bl, and anything pushing into June or July takes us meaningfully higher.
What’s changed in the last 48 hours:
#1: The US military has formally warned that clearing suspected sea mines from SoH could take up to six months. That is a completely different timescale from what the financial market is pricing. Even a political deal tomorrow does not immediately reopen the strait.
#2: Trump has shifted his tone from urgency to ”strategic patience”. In yesterday’s press conference: ”Don’t rush me… I want a great deal.” The market is reading this as a president no longer feeling pressured by timelines, with the naval blockade running in the background.
#3: So far, the military activity is escalating, not de-escalating. Axios reports Iran is laying more mines in SoH. The US 3rd carrier strike group (USS George H.W. Bush) is arriving with two countermine vessels. Trump yesterday ordered the US Navy to destroy any Iranian boats caught laying mines. While CNN reports that the Pentagon is actively drawing up plans to strike Iranian SoH capabilities and individual Iranian military leaders if the ceasefire collapses. i.e., NOT a attitude consistent with an imminent deal!
Spot crude and product prices eased off the early-April highs on a combination of system rerouting and deal optimism. Both now weakening. Goldman estimates April Gulf output is reduced by 14.5 mbl/d, or 57% of pre-war supply, a number that keeps getting worse the longer this drags on.
Demand-side adaptation is ongoing: S. Korea has cut its Middle East crude dependence from 69% to 56% by pulling more from the Americas and Africa, and Japan is kicking off a second round of SPR releases from 1 May. But SPRs are finite.
Ref. to the negotiations, we should not bet on speed. The current Iranian leadership is dominated by genuine hardliners willing to absorb economic pain and run the clock to extract concessions. That is not a setup for a rapid resolution. US/Israeli media briefings keep framing the delay as ”internal Iranian divisions”, the reality is more complicated and points toward weeks and months, not days.
Our point is that the complexity is large, and higher prices have only just started (given a scenario where the negotiations drag out in time). The market spent April leaning on the USD 90/bl rest-of-year assumption; that case is diminishing by the hour. If ”early May reopening” is replaced by ”June, July or later” over the next week or two, both crude and products have meaningful room to reprice higher from here. There is a high risk being short energy and betting on any immediate political resolution(!).
Down on Friday. Up on Monday. The Brent June crude oil contract traded down 5.1% last week to a close of $90.38/b. It reached a high of $103.87/b last Monday and a low of $86.09/b on Friday as Iran announced that the Strait of Hormuz was fully open for transit. That quickly changed over the weekend as the US upheld its blockade of Iranian oil exports while Iran naturally responded by closing the SoH again. The US blew a hole in the engine room of the Iranian ship TOUSKA and took custody of the ship on Sunday. Brent crude is up 5.6% this morning to $95.4/b.
The cease-fire is expiring tomorrow. The US has said it will send a delegation for a second round of negotiations in Islamabad in Pakistan. But Iran has for now rejected a second round of talks as it views US demands as unrealistic and excessive while the US is also blocking the Strait of Hormuz.
While Brent is up 5% this morning, the financial market is still very optimistic that progress will be made. That talks will continue and that the SoH will fully open by the start of May which is consistent with a rest-of-year average Brent crude oil price of around $90/b with the market now trading that balance at around $88/b.
Financial optimism vs. physical deterioration. We have a divergence where the financial market is trading negotiations, improvements and resolution while at the same time the physical market is deteriorating day by day. Physical oil flows remain constrained by disrupted flows, longer voyage times and elevated freight and insurance costs.
Financial markets are betting that a US/Iranian resolution will save us in time from violent shortages down the road. But every day that the SoH remains closed is bringing us closer to a potentially very painful point of shortages and much higher prices.
The US blockade is also a weapon of leverage against its European and Asian allies. When Iran closed the SoH it held the world economy as a hostage against the US. The US blockade of the SoH is of course blocking Iranian oil exports. But it is also an action of disruption directed towards Europe and Asia. The US has called for the rest of the world to engaged in the war with Iran: ”If you want oil from the Persian Gulf, then go and get it”. A risk is that the US plays brinkmanship with the global oil market directed towards its European and Asian allies and maybe even towards China to force them to engage and take part. Maybe unthinkable. But unthinkable has become the norm with Trump in the White House.


Sommarväder skapar prisrally på elbörsen
Oil product price pain is set to rise as the Strait of Hormuz stays closed into summer

Solkraften pressar elpriserna dagtid

Michel Gubel ger sin syn på oljemarknaden