

Analys
Price action Rebounding from $50/b but running into headwind from stronger USD

 SEB Brent crude front month price forecast:
Q2-17: $57.5/b
Q3-17: $55.0/b
Q4-17: $52.5/b
Price action – Rebounding from $50/b but running into headwind from stronger USD
After having touched a low of $49.71/b last Wednesday Brent crude front month contract revived to touch a high of $53.1/b yesterday. This morning it is trading down 0.4% at $52.7/b. Prices found good support at the $50/b level with a solid influx of natural oil consumers jumping in securing forward hedges at lower levels. The oil price recovery over the last week is however facing headwinds from a 1.3% stronger USD and might thus run out of steam.
Crude oil comment – No reason for OPEC to roll cuts into H2
There seems to be an almost unanimous view that OPEC will roll their H1-17 cuts into H2-17. We cannot really understand why they should do that. OECD inventories declined all through the second half of 2016 and ended down y/y in December for the first time in quite a few years. And that was without the help of OPEC! The market has been confused by the fact that inventories in weekly data rose some 100 mb through the first two and a half months of the year. The market was also disappointed when it heard that OECD inventories rose 48 mb month/month in January. Do note however that the normal seasonal pattern is for OECD inventories to rise by 30 mb in January. Thus they only rose by 18 mb more than normal. Total crude and product stocks in the US have declined 4 weeks out of the last 6 weeks and we strongly believe that inventories will declined steadily from here onwards. When OPEC meets in Vienna on May 25th the perspective will be
1) Declining inventories (i.e. market is in balance to deficit)
2) A flat to backwardated crude oil curve. I.e. no spot price discount to longer dated contracts
3) US crude production standing close to previous peak and rising rapidly
4) Demand will jump some 1.9 mb/d from H1-17 og H2-17 seasonally with little risk for surplus
Thus the natural communication from OPEC following their forthcoming May 25th meeting in Vienna would be that the market is in balance. Actually it is in deficit and inventories are drawing down. There is no longer a spot price discount to longer dated contracts. I.e. there is very little stress in the market due to surplus oil and OPEC receives no discounted cash flow versus longer dated prices. I.e. there is little economic reason for OPEC to cut as they then are receiving a fair price for their oil (equal to longer dated prices). A further cut would only endanger OPEC’s market share through unnecessary stimulus of US shale oil production. That last dimension will be highly accentuated at the meeting on the 25th of May since if we just extrapolate US crude oil production so far this year it may stand at 9.5 mb/d at their May meeting. US crude oil production is now growing just as fast (marginal annualized pace of 1.5 mb/d) as it did from 2011 to 2015. The hypothesis from OPEC’s November meeting in 2016 that US shale oil production will only recover gradually as long as the oil price stays below $60/b has been totally busted. The empirical evidence is that when the mid-term WTI curve (one to two year horizon forward prices) averaged $52/b in H2 then US shale oil rigs rose by 7 rigs/week. When those forward prices instead rose to $55-56/b following OPEC’s decision to cut the weekly rig additions rose to about 10 rigs/week.
OPEC is likely to conclude that all looks good. Market is in balance to deficit. Inventories are drawing down. There is no longer any spot price rebate in the market and little stress from surplus oil to be seen. Demand will rise strongly into H2-17. Thus OPEC is likely to move back into operation putting their 1.16 mb/d H1-17 cut aside and revisit the question of cuts at their next meeting in Vienna at the end of 2017. They will like to look like they are in control and an extension of cuts into H2-17 will stimulate US shale oil production to an extent that will make it look like they are out of control.
We expect crude oil prices to get a brief set-back when OPEC announces such a decision. But we do expect it to be brief and with limited consequences. We expect Brent crude oil prices to end the year with an average of $52.5/b in Q4-17. We expect the curve to be some $3/b in backwardation at that time which implies that the one to two year forward prices at that time will trade around $50/b. Since the WTI curve is trading at some $2/b below the Brent crude curve it will mean that the mid-term (1 to 2 year forward) WTI crude oil curve will then trade at around $48/b. We expect that to dampen the current very strong weekly rig additions which we see currently.
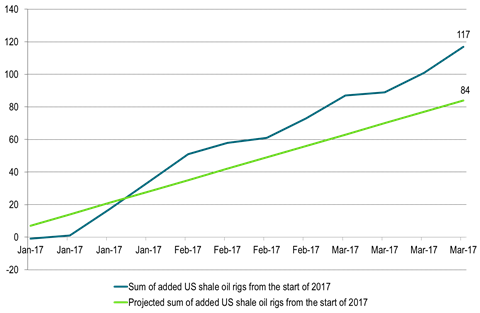
Ch1: US shale oil rigs continues to rise strongly
Last week the number of US shale oil rigs rose by 16 rigs or 9 rigs more than our projection
So far the average weekly US shale oil rig additions stands at 9.75 rigs/week
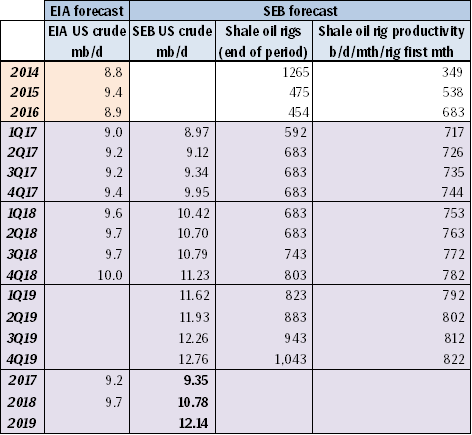
Ch2: SEB US crude oil production projection lifted by 12 kb/d in 2017, by 49 kb/d in 2018 and by 68 kb/d in 2019
Total additional cumulative US crude oil production over the next three years rose by 47 million barrels as a result of 16 rigs being added last week versus our expected 7 rigs
We expect the US EIA to lift its US crude oil production projection again in its forthcoming April report reflecting the fact that 51 shale oil rigs were added to the market in March.
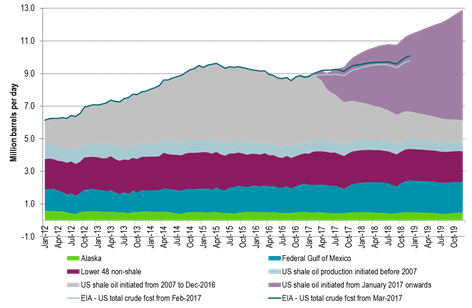
Ch3: SEB US crude oil production projection graph
Ch4: SEB global crude oil supply demand balance
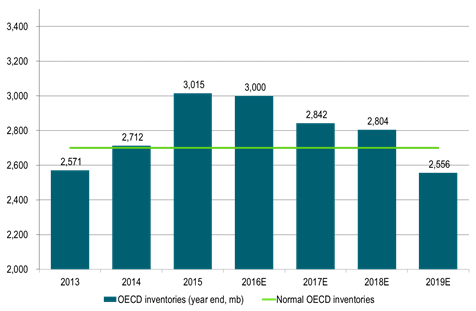
Ch5: SEB projected OECD end of year inventories
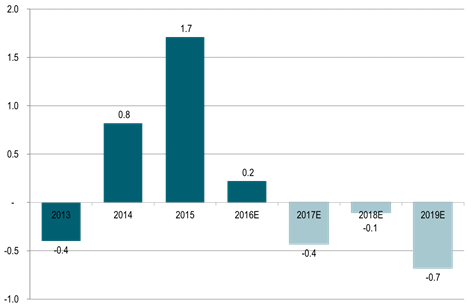
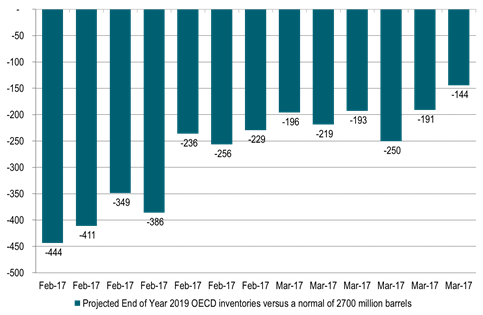
Ch6: Time development of SEB’s projected 2019 end of year OECD oil inventories versus a normal of 2700 million barrels
A deep draw in OECD inventories at the end of 2019 has become much less pronounced as rig count is rising much faster than expected thus lifting our US crude oil production projection
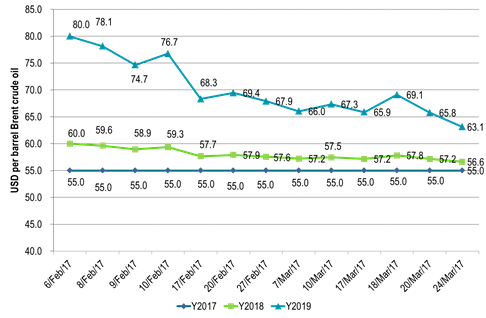
Ch6: Time development of SEB’s dynamic Brent crude oil price forecast
Much less price squeeze risk in 2019 as the balance has softened with higher US production projection
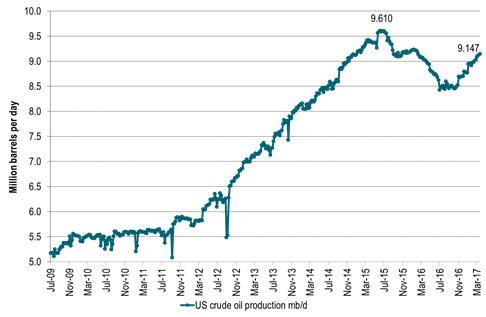
Ch7: US crude oil production increasing in a stright line
Potentially closing in at 9.5 mb/d when OPEC meets in Vienna on May 25th
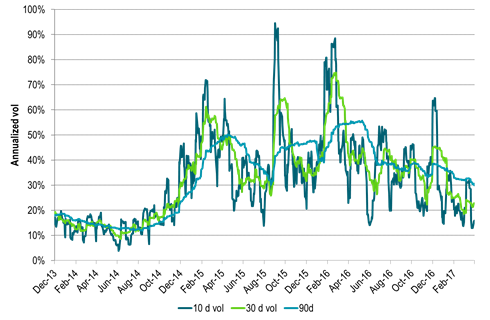
Ch8: Volatility is trending lower with yet more downside to come we expect
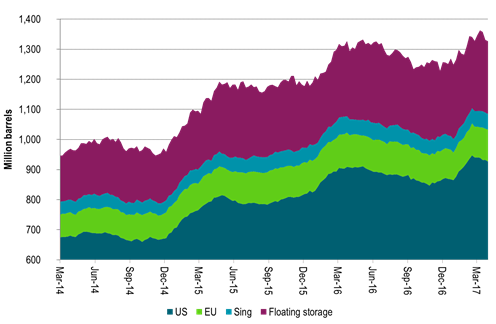
Ch9: Weekly inventory data are starting to show a draw
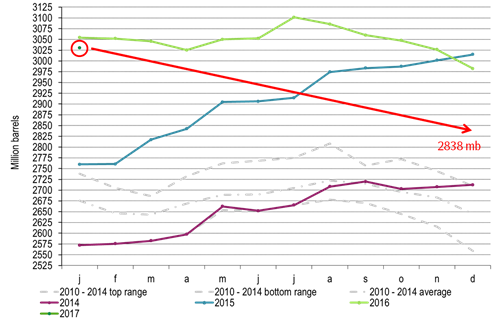
Ch10: And this is what we expect OECD inventories will do in 2017 (We assume OPEC will not cut in H2-17)
But due to US shale oil revival there won’t be much draws in 2018
Thus all through 2017 and 2018 the OECD inventories will stay above normal with few pressure points in the global oil market
Kind regards
Bjarne Schieldrop
Chief analyst, Commodities
SEB Markets
Merchant Banking
Hesitant today. Brent jumped to an intraday high of $66.36/b yesterday after having touched an intraday low of $60.07/b on Monday as Indian and Chinese buyers cancelled some Russian oil purchases and instead redirected their purchases towards the Middle East due to the news US sanctions. Brent is falling back 0.4% this morning to $65.8/b.

It’s our strong view that the only sensible thing is to sell this rally. In all Trump’s unpredictability he has become increasingly predictable. Again and again he has rumbled about how he is going to be tough on Putin. Punish Putin if he won’t agree to peace in Ukraine. Recent rumbling was about the Tomahawk rockets which Trump threatened on 10 October and 12 October to sell/send to Ukraine. Then on 17 October he said that ”the U.S. didn’t want to give away weapons (Tomahawks) it needs”.
All of Trump’s threats towards Putin have been hot air. So far Trump’s threats have been all hot air and threats which later have evaporated after ”great talks with Putin”. After all these repetitions it is very hard to believe that this time will be any different. The new sanctions won’t take effect before 21. November. Trump has already said that: ”he was hoping that these new sanctions would be very short-lived in any case”. Come 21. November these new sanctions will either evaporate like all the other threats Trump has thrown at Putin before fading them. Or the sanctions will be postponed by another 4 weeks or 8 weeks with the appearance that Trump is even more angry with Putin. But so far Trump has done nothing that hurt Putin/Russia. We can’t imagine that this will be different. The only way forward in our view for a propre lasting peace in Ukraine is to turn Ukraine into defensive porcupine equipped with a stinging tail if need be.
China will likely stand up to Trump if new sanctions really materialize on 21 Nov. Just one country has really stood up to Trump in his tariff trade war this year: China. China has come of age and strength. I will no longer be bullied. Trump upped tariffs. China responded in kind. Trump cut China off from high-end computer chips. China put on the breaks on rare earth metals. China won’t be bullied any more and it has the power to stand up. Some Chinese state-owned companies like Sinopec have cancelled some of their Russian purchases. But China’s Foreign Ministry spokesperson Guo Jiakun has stated that China “oppose unilateral sanctions which lack a basis in international law and authorization of the UN Security Council”. Thus no one, not even the US shall unilaterally dictate China from whom they can buy oil or not. This is yet another opportunity for China to show its new strength and stand up to Trump in a show of force. Exactly how China choses to play this remains to be seen. But China won’t be bullied by over something as important as its oil purchases. So best guess here is that China will defy Trump on this. But probably China won’t need to make a bid deal over this. Firstly because these new sanctions will either evaporate as all the other threats or be postponed once we get to 21 November. Secondly because the sanctions are explicit towards US persons and companies but only ”may” be enforced versus non-US entities.
Sanctions is not a reduction in global supply of oil. Just some added layer of friction. Anyhow, the new sanctions won’t reduce the supply of Russian crude oil to the market. It will only increase the friction in the market with yet more need for the shadow fleet and ship to ship transfer of Russian oil to dodge the sanctions. If they materialize at all.
The jump in crude oil prices is probably due to redirections of crude purchases to the Mid-East and not because all speculators are now turned bullish. Has oil rallied because all speculators now suddenly have turned bullish? We don’t think so. Brent crude has probably jumped because some Indian and Chinese oil purchasers of have redirected their purchases from Russia towards the Mid-East just in case the sanctions really materializes on 21 November.
Parts of the Brent crude curve dipping into the high $50ies/b. Brent crude fell 2.3% over the week to Friday. It closed the week at $61.29/b, a slight gain on the day, but also traded to a low of $60.14/b that same day and just barely avoided trading into the $50ies/b. This morning it is risk-on in equities which seems to help industrial metals a little higher. But no such luck for oil. It is down 0.8% at $60.8/b. This week looks set for Brent crude to dip its feet in the $50ies/b. The Brent 3mth contract actually traded into the high $50ies/b on Friday.
The front-end backwardation has been on a weakening foot and is now about to fully disappear. The lowest point of the crude oil curve has also moved steadily lower and lower and its discount to the 5yr contract is now $6.8/b. A solid contango. The Brent 3mth contract did actually dip into the $50ies/b intraday on Friday when it traded to a low point of $59.93/b.
More weakness to come as lots of oil at sea comes to ports. Mid-East OPEC countries have boosted exports along with lower post summer consumption and higher production. The result is highly visibly in oil at sea which increased by 17 mb to 1,311 mb over the week to Sunday. Up 185 mb since mid-August. On its way to discharge at a port somewhere over the coming month or two.
Don’t forget that the oil market path ahead is all down to OPEC+. Remember that what is playing out in the oil market now is all by design by OPEC+. The group has decided that the unwind of the voluntary cuts is what it wants to do. In a combination of meeting demand from consumers as well as taking back market share. But we need to remember that how this plays out going forward is all at the mercy of what OPEC+ decides to do. It will halt the unwinding at some point. It will revert to cuts instead of unwind at some point.
A few months with Brent at $55/b and 40-50 US shale oil rigs kicked out may be what is needed. We think OPEC+ needs to see the exit of another 40-50 drilling rigs in the US shale oil patches to set US shale oil production on a path to of a 1 mb/d year on year decline Dec-25 to Dec-26. We are not there yet. But a 2-3 months period with Brent crude averaging $55/b would probably do it.
Oil on water increased 17 mb over the week to Sunday while oil in transit increased by 23 mb. So less oil was standing still. More was moving.

Crude oil floating storage (stationary more than 7 days). Down 11 mb over week to Sunday

The lowest point of the Brent crude oil curve versus the 5yr contract. Weakest so far this year.

Crude oil 1mth to 3mth time-spreads. Dubai held out strongly through summer, but then that center of strength fell apart in late September and has been leading weakness in crude curves lower since then.

Rebounding along with most markets. But concerns over solidity of Gaza peace may also contribute. Brent crude fell 0.8% yesterday to $61.91/b and its lowest close since May this year. This morning it is bouncing up 0.9% to $62.5/b along with a softer USD amid positive sentiment with both equities and industrial metals moving higher. Concerns that the peace in Gaza may be less solid than what one might hope for also yields some support to Brent. Bets on tech stocks are rebounding, defying fears of trade war. Money moving back into markets. Gold continues upwards its strong trend and a softer dollar helps it higher today as well.
US crude & products probably rose 5.6 mb last week (API) versus a normal seasonal decline of 2.4 mb. The US API last night partial and thus indicative data for US oil inventories. Their data indicates that US crude stocks rose 7.4 mb last week, gasoline stocks rose 3.0 mb while Distillate stocks fell 4.8 mb. Altogether an increase in commercial crude and product stocks of 5.6 mb. Commercial US crude and product stocks normally decline by 2.4 mb this time of year. So seasonally adjusted the US inventories rose 8 mb last week according to the indicative numbers by the API. That is a lot. Also, the counter seasonal trend of rising stocks versus normally declining stocks this time of year looks on a solid pace of continuation. If the API is correct then total US crude and product stocks would stand 41 mb higher than one year ago and 6 mb higher than the 2015-19 average. And if we combine this with our knowledge of a sharp increase in production and exports by OPEC(+) and a large increase in oil at sea, then the current trend in US oil inventories looks set to continue. So higher stocks and lower crude oil prices until OPEC(+) switch to cuts. Actual US oil inventory data today at 18:00 CET.
US commercial crude and product stocks rising to 1293 mb in week 41 if last nights indicative numbers from API are correct.

Crude oil soon coming to a port near you. OPEC has lifted production sharply higher this autumn. At the same time demand for oil in the Middle-East has fallen as we have moved out of summer heat and crude oil burn for power for air-conditioning. The Middle-East oil producers have thus been able to lift exports higher on both accounts. Crude oil and condensates on water has shot up by 177 mb since mid-August. This oil is now on its way to ports around the world. And when they arrive, it will likely help to lift stocks onshore higher. That is probably when we will lose the last bit of front-end backwardation the the crude oil curves. That will help to drive the front-month Brent crude oil price down to the $60/b line and revisit the high $50ies/b. Then the eyes will be all back on OPEC+ when they meet in early November and then again in early December.
Crude oil and condensates at sea have moved straight up by 177 mb since mid-August as OPEC(+) has produced more, consumed less and exported more.


Sell the rally. Trump has become predictable in his unpredictability

Gruvbolaget Boliden överträffade analytikernas förväntningar

Australien och USA investerar 8,5 miljarder USD för försörjningskedja av kritiska mineraler
Brent crude set to dip its feet into the high $50ies/b this week

Vad guldets uppgång egentligen betyder för världen

OPEC+ missar produktionsmål, stöder oljepriserna

Goldman Sachs höjer prognosen för guld, tror priset når 4900 USD

Blykalla och amerikanska Oklo inleder ett samarbete

Guld nära 4000 USD och silver 50 USD, därför kan de fortsätta stiga

Leading Edge Materials är på rätt plats i rätt tid
-
 Nyheter4 veckor sedan
OPEC+ missar produktionsmål, stöder oljepriserna
-
 Nyheter2 veckor sedan
Goldman Sachs höjer prognosen för guld, tror priset når 4900 USD
-
 Nyheter3 veckor sedan
Blykalla och amerikanska Oklo inleder ett samarbete
-
 Nyheter3 veckor sedan
Guld nära 4000 USD och silver 50 USD, därför kan de fortsätta stiga
-
 Nyheter2 veckor sedan
Leading Edge Materials är på rätt plats i rätt tid
-

 Nyheter2 veckor sedan
Nytt prisrekord, guld stiger över 4000 USD
-

 Nyheter3 veckor sedan
Ett samtal om guld, olja, koppar och stål
-
Analys3 veckor sedan
OPEC+ will likely unwind 500 kb/d of voluntary quotas in October. But a full unwind of 1.5 mb/d in one go could be in the cards