Analys
Price action Rebounding from $50/b but running into headwind from stronger USD


Q2-17: $57.5/b
Q3-17: $55.0/b
Q4-17: $52.5/b
Price action – Rebounding from $50/b but running into headwind from stronger USD
After having touched a low of $49.71/b last Wednesday Brent crude front month contract revived to touch a high of $53.1/b yesterday. This morning it is trading down 0.4% at $52.7/b. Prices found good support at the $50/b level with a solid influx of natural oil consumers jumping in securing forward hedges at lower levels. The oil price recovery over the last week is however facing headwinds from a 1.3% stronger USD and might thus run out of steam.
Crude oil comment – No reason for OPEC to roll cuts into H2
There seems to be an almost unanimous view that OPEC will roll their H1-17 cuts into H2-17. We cannot really understand why they should do that. OECD inventories declined all through the second half of 2016 and ended down y/y in December for the first time in quite a few years. And that was without the help of OPEC! The market has been confused by the fact that inventories in weekly data rose some 100 mb through the first two and a half months of the year. The market was also disappointed when it heard that OECD inventories rose 48 mb month/month in January. Do note however that the normal seasonal pattern is for OECD inventories to rise by 30 mb in January. Thus they only rose by 18 mb more than normal. Total crude and product stocks in the US have declined 4 weeks out of the last 6 weeks and we strongly believe that inventories will declined steadily from here onwards. When OPEC meets in Vienna on May 25th the perspective will be
1) Declining inventories (i.e. market is in balance to deficit)
2) A flat to backwardated crude oil curve. I.e. no spot price discount to longer dated contracts
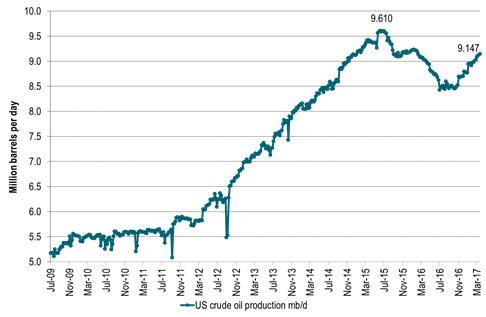
3) US crude production standing close to previous peak and rising rapidly
4) Demand will jump some 1.9 mb/d from H1-17 og H2-17 seasonally with little risk for surplus
Thus the natural communication from OPEC following their forthcoming May 25th meeting in Vienna would be that the market is in balance. Actually it is in deficit and inventories are drawing down. There is no longer a spot price discount to longer dated contracts. I.e. there is very little stress in the market due to surplus oil and OPEC receives no discounted cash flow versus longer dated prices. I.e. there is little economic reason for OPEC to cut as they then are receiving a fair price for their oil (equal to longer dated prices). A further cut would only endanger OPEC’s market share through unnecessary stimulus of US shale oil production. That last dimension will be highly accentuated at the meeting on the 25th of May since if we just extrapolate US crude oil production so far this year it may stand at 9.5 mb/d at their May meeting. US crude oil production is now growing just as fast (marginal annualized pace of 1.5 mb/d) as it did from 2011 to 2015. The hypothesis from OPEC’s November meeting in 2016 that US shale oil production will only recover gradually as long as the oil price stays below $60/b has been totally busted. The empirical evidence is that when the mid-term WTI curve (one to two year horizon forward prices) averaged $52/b in H2 then US shale oil rigs rose by 7 rigs/week. When those forward prices instead rose to $55-56/b following OPEC’s decision to cut the weekly rig additions rose to about 10 rigs/week.
OPEC is likely to conclude that all looks good. Market is in balance to deficit. Inventories are drawing down. There is no longer any spot price rebate in the market and little stress from surplus oil to be seen. Demand will rise strongly into H2-17. Thus OPEC is likely to move back into operation putting their 1.16 mb/d H1-17 cut aside and revisit the question of cuts at their next meeting in Vienna at the end of 2017. They will like to look like they are in control and an extension of cuts into H2-17 will stimulate US shale oil production to an extent that will make it look like they are out of control.
We expect crude oil prices to get a brief set-back when OPEC announces such a decision. But we do expect it to be brief and with limited consequences. We expect Brent crude oil prices to end the year with an average of $52.5/b in Q4-17. We expect the curve to be some $3/b in backwardation at that time which implies that the one to two year forward prices at that time will trade around $50/b. Since the WTI curve is trading at some $2/b below the Brent crude curve it will mean that the mid-term (1 to 2 year forward) WTI crude oil curve will then trade at around $48/b. We expect that to dampen the current very strong weekly rig additions which we see currently.
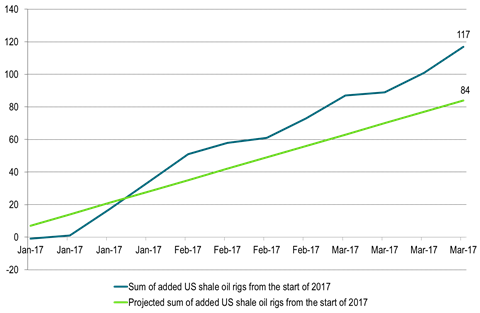
Ch1: US shale oil rigs continues to rise strongly
Last week the number of US shale oil rigs rose by 16 rigs or 9 rigs more than our projection
So far the average weekly US shale oil rig additions stands at 9.75 rigs/week
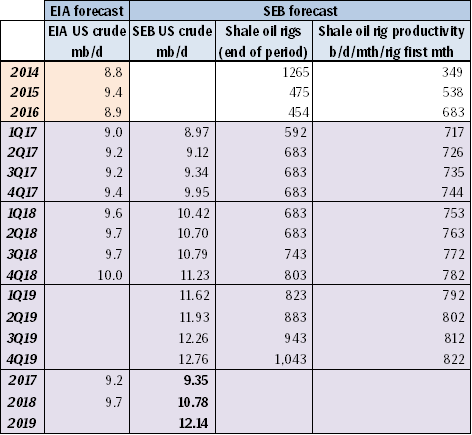
Ch2: SEB US crude oil production projection lifted by 12 kb/d in 2017, by 49 kb/d in 2018 and by 68 kb/d in 2019
Total additional cumulative US crude oil production over the next three years rose by 47 million barrels as a result of 16 rigs being added last week versus our expected 7 rigs
We expect the US EIA to lift its US crude oil production projection again in its forthcoming April report reflecting the fact that 51 shale oil rigs were added to the market in March.
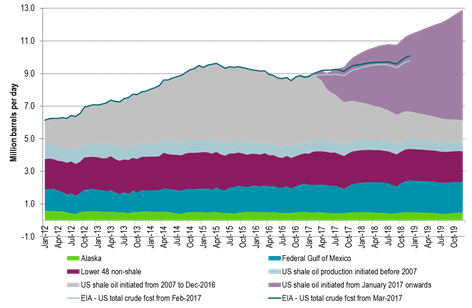
Ch3: SEB US crude oil production projection graph
Ch4: SEB global crude oil supply demand balance
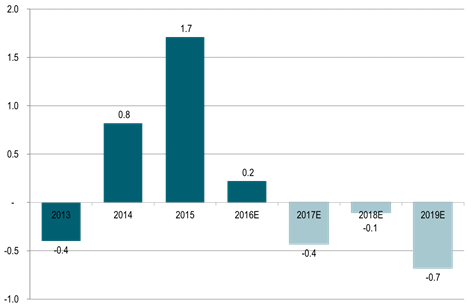
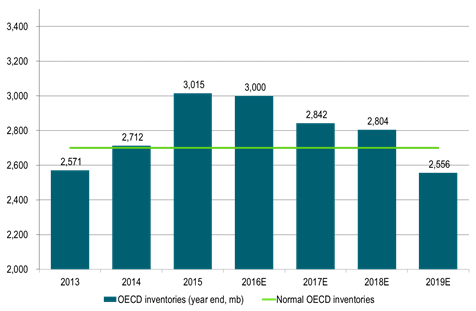
Ch5: SEB projected OECD end of year inventories
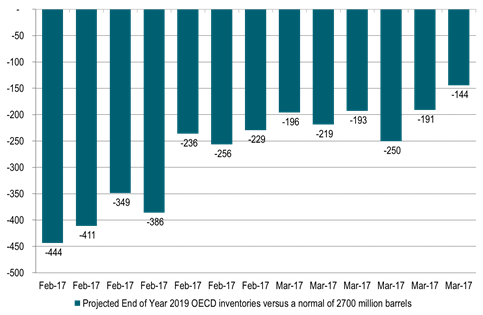
Ch6: Time development of SEB’s projected 2019 end of year OECD oil inventories versus a normal of 2700 million barrels
A deep draw in OECD inventories at the end of 2019 has become much less pronounced as rig count is rising much faster than expected thus lifting our US crude oil production projection
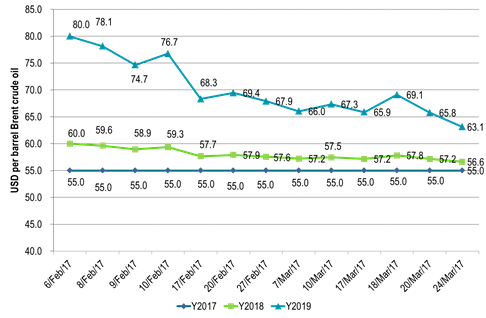
Ch6: Time development of SEB’s dynamic Brent crude oil price forecast
Much less price squeeze risk in 2019 as the balance has softened with higher US production projection
Ch7: US crude oil production increasing in a stright line
Potentially closing in at 9.5 mb/d when OPEC meets in Vienna on May 25th
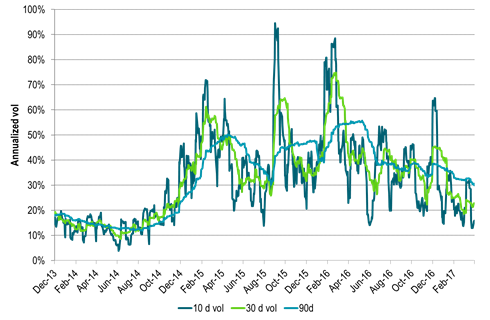
Ch8: Volatility is trending lower with yet more downside to come we expect
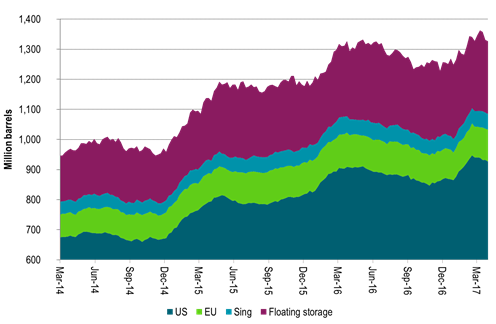
Ch9: Weekly inventory data are starting to show a draw
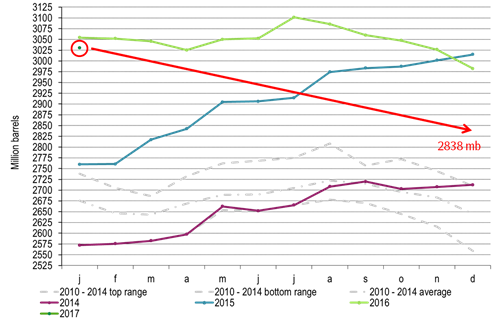
Ch10: And this is what we expect OECD inventories will do in 2017 (We assume OPEC will not cut in H2-17)
But due to US shale oil revival there won’t be much draws in 2018
Thus all through 2017 and 2018 the OECD inventories will stay above normal with few pressure points in the global oil market
Kind regards
Bjarne Schieldrop
Chief analyst, Commodities
SEB Markets
Merchant Banking