

Analys
OPEC meeting: Holding back is easy as Iran and Venezuela takes all the pain


Brent crude jumps 2.8% this morning to $66.6/bl following news that Saudi Arabia and Russia are in agreement of an extension of current cuts for another 6 to 9 months and that this plan is also endorsed by Iran’s oil minister Zanganeh. A trade truce between US and China also adds strength to the oil price this morning.
OPEC being “between a rock and a hard place” has been the description of OPEC’s situation in the run-up to this OPEC meeting. Losing market share to booming US shale oil production on the one hand while facing weakening oil demand growth along with slowing global growth on the other hand. It is true that OPEC as a whole is losing market share. But this burden is not evenly distributed as it is Venezuela and Iran who are taking almost all the pain. The other OPEC members (and OPEC+ members) are basically not taking any heat at all.

From Jan to May Saudi Arabia produced only 173 k bl/d below its 2014-2018 average while Russia produced 371 k bl/d above that average.
It is thus easy for the main producers to decide to roll cuts forward as they do not really cost them anything, or very little to do so. The only price they have to pay is to hold back supply slightly and refrain from growing their production along with global oil demand growth while harvesting an oil price of $60-70/bl.
It will of course be problematic when Iran and Venezuela eventually returns to the market. And that could indeed be a very bearish moment in the oil market. Given the large range of uncertainties in the oil market OPEC has learned to act reactively rather than trying to act pre-emptively. Thus OPEC will have to deal with the return of Venezuela and Iran at some point in the future but then it will deal with that rainy day when it comes. Right now things are as they are and it is easy for OPEC’s key members and Russia to roll the cuts forward into H2-19 and also likely into Q1-20.
It is clear that the global economy is still in a slow-down mode and so is global oil demand growth. Global oil demand growth is however rarely below +1% y/y unless the global economy is in a recession and as far as we can see we are not there yet at all.
Global oil demand seasonally jumps roughly 1 m bl/d from Q2 to H2. US shale oil production is currently growing at a marginal annualized rate of about 0.8 m bl/d YoY and in addition comes US NGL growth. US crude production will thus probably be 0.4 m bl/d higher at year end but on average just 0.2 m bl/d higher in H2 than in June. So OPEC+ will probably have to produce more in H2 than they did in H1 in order to satisfy seasonally higher demand unless the global economy tanks completely. Thus if Russia, Saudi Arabia and the other key OPEC members keeps production at the levels they produced in H1-19 they will ensure that the global oil market is not flowing over. They will only have to pay a small restraint while reaping a nice oil price of $60-70/bl
Two factors are coming into play in H2-19 in addition to global oil demand growth. The first is a large ramp-up of oil pipelines coming online from the Permian basin and out to the US Gulf. Cactus, EPIC and Grey Oak will add a total capacity of between 2.2 and 2.5 m bl/d from Permian to the USGC which effectively (80%) will amount to 1.7 to 2.0 m bl/d. This will help to release surplus oil inventories in the US into the global market place, tighten up the US market while easing the global situation. It will help to tighten up the WTI crude price curve while helping to ease the Brent crude price curve in relative terms. The oil market has a tendency to trade the global oil price on the back of US oil data due to lacking availability of high quality global data. Thus a draining of US oil inventories could be interpreted bullishly even though it is only shifting inventories from the US to non-US.
The other factor is the IMO – 2020 shift of fuel quality in global shipping from maximum 3.5% sulphur to only 0.5% sulphur in January 2020. In general this will add a lot of Marine Gasoil (MGO) demand from global shipping and especially so in Q4-19 and H1-2020. Global refineries will need to run hard to satisfy elevated stock building and demand already in Q4-19. This will be bullish for global crude oil demand already in H2-19. Ballpark figures are that shipping will need an additional 2 m bl/d of MGO in this period. Global refineries will probably have to process another 4-5 m bl/d of crude in order to satisfy this added MGO demand.
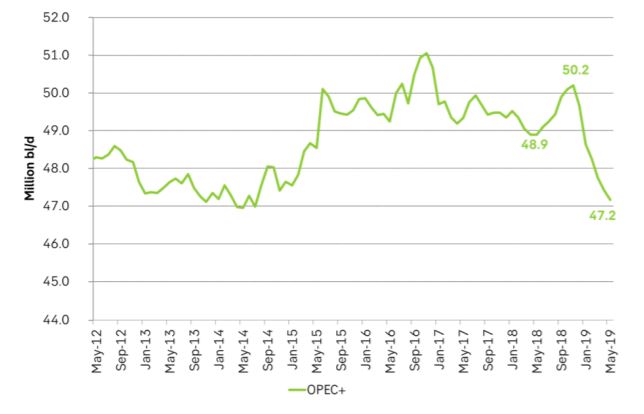
Ch1: Supply from OPEC+ declined 3.0 m bl/d from a peak in November last year. It looks like a decisive cut. To a large degree it is the misfortune of Iran and Venezuela. OPEC+ also boosted production from May to Nov last year and then cut from a peak.
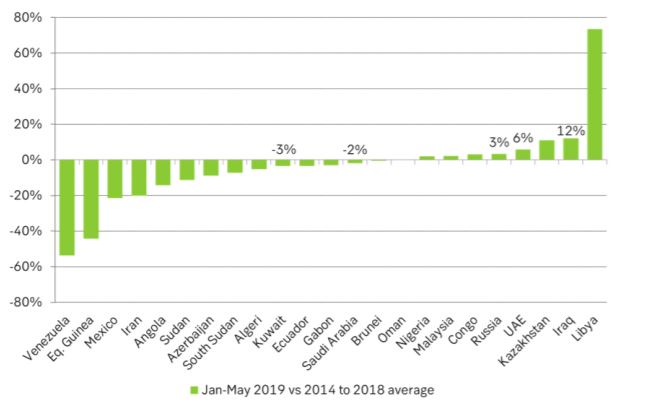
Ch2: Production in OPEC+ during Jan to May this year versus average levels from 2014 to 2018 in %. Russia, Iraq and UAE are well above while Saudi Arabia and Kuwait are just marginally below. Not a high price for these countries to hold production unchanged through H2-19 and Q1-20. Venezuela and Iran are taking the pain
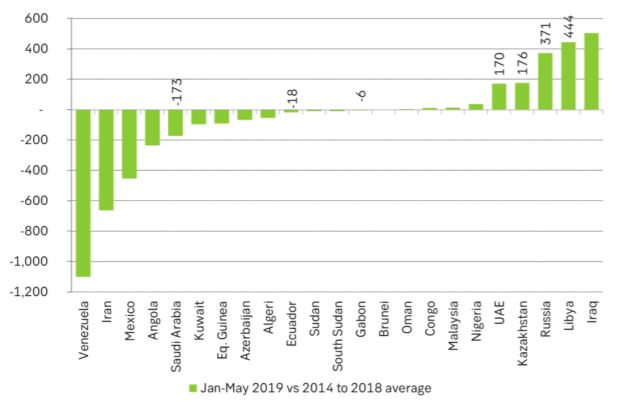
Ch3: Production in OPEC+ during Jan to May this year versus average levels from 2014 to 2018 in k bl/d. Saudi Arabia produced only 173 k bl/d below the 5 year average while Russia produced 371 k bl/d above that level. They are producing at very good volumes and not really paying a high price.
Rebounding along with most markets. But concerns over solidity of Gaza peace may also contribute. Brent crude fell 0.8% yesterday to $61.91/b and its lowest close since May this year. This morning it is bouncing up 0.9% to $62.5/b along with a softer USD amid positive sentiment with both equities and industrial metals moving higher. Concerns that the peace in Gaza may be less solid than what one might hope for also yields some support to Brent. Bets on tech stocks are rebounding, defying fears of trade war. Money moving back into markets. Gold continues upwards its strong trend and a softer dollar helps it higher today as well.

US crude & products probably rose 5.6 mb last week (API) versus a normal seasonal decline of 2.4 mb. The US API last night partial and thus indicative data for US oil inventories. Their data indicates that US crude stocks rose 7.4 mb last week, gasoline stocks rose 3.0 mb while Distillate stocks fell 4.8 mb. Altogether an increase in commercial crude and product stocks of 5.6 mb. Commercial US crude and product stocks normally decline by 2.4 mb this time of year. So seasonally adjusted the US inventories rose 8 mb last week according to the indicative numbers by the API. That is a lot. Also, the counter seasonal trend of rising stocks versus normally declining stocks this time of year looks on a solid pace of continuation. If the API is correct then total US crude and product stocks would stand 41 mb higher than one year ago and 6 mb higher than the 2015-19 average. And if we combine this with our knowledge of a sharp increase in production and exports by OPEC(+) and a large increase in oil at sea, then the current trend in US oil inventories looks set to continue. So higher stocks and lower crude oil prices until OPEC(+) switch to cuts. Actual US oil inventory data today at 18:00 CET.
US commercial crude and product stocks rising to 1293 mb in week 41 if last nights indicative numbers from API are correct.

Crude oil soon coming to a port near you. OPEC has lifted production sharply higher this autumn. At the same time demand for oil in the Middle-East has fallen as we have moved out of summer heat and crude oil burn for power for air-conditioning. The Middle-East oil producers have thus been able to lift exports higher on both accounts. Crude oil and condensates on water has shot up by 177 mb since mid-August. This oil is now on its way to ports around the world. And when they arrive, it will likely help to lift stocks onshore higher. That is probably when we will lose the last bit of front-end backwardation the the crude oil curves. That will help to drive the front-month Brent crude oil price down to the $60/b line and revisit the high $50ies/b. Then the eyes will be all back on OPEC+ when they meet in early November and then again in early December.
Crude oil and condensates at sea have moved straight up by 177 mb since mid-August as OPEC(+) has produced more, consumed less and exported more.

When it starts to move lower it moves rather quickly. Gaza, China, IEA. Brent crude is down 2.1% today to $62/b after having traded as high as $66.58/b last Thursday and above $70/b in late September. The sell-off follows the truce/peace in Gaze, a flareup in US-China trade and yet another bearish oil outlook from the IEA.
A lasting peace in Gaze could drive crude oil at sea to onshore stocks. A lasting peace in Gaza would probably calm down the Houthis and thus allow more normal shipments of crude oil to sail through the Suez Canal, the Red Sea and out through the Bab-el-Mandeb Strait. Crude oil at sea has risen from 48 mb in April to now 91 mb versus a pre-Covid normal of about 50-60 mb. The rise to 91 mb is probably the result of crude sailing around Africa to be shot to pieces by the Houthis. If sailings were to normalize through the Suez Canal, then it could free up some 40 mb in transit at sea moving onshore into stocks.
The US-China trade conflict is of course bearish for demand if it continues.
Bearish IEA yet again. Getting closer to 2026. Credibility rises. We expect OPEC to cut end of 2025. The bearish monthly report from the IEA is what it is, but the closer we get to 2026, the more likely the IEA is of being ball-park right in its outlook. In its monthly report today the IEA estimates that the need for crude oil from OPEC in 2026 will be 25.4 mb/d versus production by the group in September of 29.1 mb/d. The group thus needs to do some serious cutting at the end of 2025 if it wants to keep the market balanced and avoid inventories from skyrocketing. Given that IEA is correct that is. We do however expect OPEC to implement cuts to avoid a large increase in inventories in Q1-26. The group will probably revert to cuts either at its early December meeting when they discuss production for January or in early January when they discuss production for February. The oil price will likely head yet lower until the group reverts to cuts.
Dubai: The Mid-East anchor dragging crude oil lower. Surplus emerging in Mid-East pricing. Crude oil prices held surprisingly strong all through the summer. A sign and a key source of that strength came from the strength in the front-end backwardation of the Dubai crude oil curve. It held out strong from mid-June and all until late September with an average 1-3mth time-spread premium of $1.8/b from mid-June to end of September. The 1-3mth time-spreads for Brent and WTI however were in steady deterioration from late June while their flat prices probably were held up by the strength coming from the Persian Gulf. Then in late September the strength in the Dubai curve suddenly collapsed. Since the start of October it has been weaker than both the Brent and the WTI curves. The Dubai 1-3mth time-spread now only stands at $0.25/b. The Middle East is now exporting more as it is producing more and also consuming less following elevated summer crude burn for power (Aircon) etc.
The only bear-element missing is a sudden and solid rise in OECD stocks. The only thing that is missing for the bear-case everyone have been waiting for is a solid, visible rise in OECD stocks in general and US oil stocks specifically. So watch out for US API indications tomorrow and official US oil inventories on Thursday.
No sign of any kind of fire-sale of oil from Saudi Arabia yet. To what we can see, Saudi Arabia is not at all struggling to sell its oil. It only lowered its Official Selling Prices (OSPs) to Asia marginally for November. A surplus market + Saudi determination to sell its oil to the market would normally lead to a sharp lowering of Saudi OSPs to Asia. Not yet at least and not for November.
The 5yr contract close to fixed at $68/b. Of importance with respect to how far down oil can/will go. When the oil market moves into a surplus then the spot price starts to trade in a large discount to the 5yr contract. Typically $10-15/b below the 5yr contract on average in bear-years (2009, 2015, 2016, 2020). But the 5yr contract is usually pulled lower as well thus making this approach a moving target. But the 5yr contract price has now been rock solidly been pegged to $68/b since 2022. And in the 2022 bull-year (Brent spot average $99/b), the 5yr contract only went to $72/b on average. If we assume that the same goes for the downside and that 2026 is a bear-year then the 5yr goes to $64/b while the spot is trading at a $10-15/b discount to that. That would imply an average spot price next year of $49-54/b. But that is if OPEC doesn’t revert to cuts and instead keeps production flowing. We think OPEC(+) will trim/cut production as needed into 2026 to prevent a huge build-up in global oil stocks and a crash in prices. But for now we are still heading lower. Into the $50ies/b.
Some rebound but not much. Brent crude rebounded 1.5% yesterday to $65.47/b. This morning it is inching 0.2% up to $65.6/b. The lowest close last week was on Thursday at $64.11/b.
The curve structure is almost as week as it was before the weekend. The rebound we now have gotten post the message from OPEC+ over the weekend is to a large degree a rebound along the curve rather than much strengthening at the front-end of the curve. That part of the curve structure is almost as weak as it was last Thursday.
We are still on a weakening path. The message from OPEC+ over the weekend was we are still on a weakening path with rising supply from the group. It is just not as rapidly weakening as was feared ahead of the weekend when a quota hike of 500 kb/d/mth for November was discussed.
The Brent curve is on its way to full contango with Brent dipping into the $50ies/b. Thus the ongoing weakening we have had in the crude curve since the start of the year, and especially since early June, will continue until the Brent crude oil forward curve is in full contango along with visibly rising US and OECD oil inventories. The front-month Brent contract will then flip down towards the $60/b-line and below into the $50ies/b.
At what point will OPEC+ turn to cuts? The big question then becomes: When will OPEC+ turn around to make some cuts? At what (price) point will they choose to stabilize the market? Because for sure they will. Higher oil inventories, some more shedding of drilling rigs in US shale and Brent into the 50ies somewhere is probably where the group will step in.
There is nothing we have seen from the group so far which indicates that they will close their eyes, let the world drown in oil and the oil price crash to $40/b or below.
The message from OPEC+ is also about balance and stability. The world won’t drown in oil in 2026. The message from the group as far as we manage to interpret it is twofold: 1) Taking back market share which requires a lower price for non-OPEC+ to back off a bit, and 2) Oil market stability and balance. It is not just about 1. Thus fretting about how we are all going to drown in oil in 2026 is totally off the mark by just focusing on point 1.
When to buy cal 2026? Before Christmas when Brent hits $55/b and before OPEC+ holds its last meeting of the year which is likely to be in early December.
Brent crude oil prices have rebounded a bit along the forward curve. Not much strengthening in the structure of the curve. The front-end backwardation is not much stronger today than on its weakest level so far this year which was on Thursday last week.

The front-end backwardation fell to its weakest level so far this year on Thursday last week. A slight pickup yesterday and today, but still very close to the weakest year to date. More oil from OPEC+ in the coming months and softer demand and rising inventories. We are heading for yet softer levels.


Vad guldets uppgång egentligen betyder för världen

Spotpriset på guld över 4300 USD och silver över 54 USD
Crude oil soon coming to a port near you

Guld och silver stiger hela tiden mot nya höjder
The Mid-East anchor dragging crude oil lower

OPEC+ missar produktionsmål, stöder oljepriserna

Ett samtal om guld, olja, fjärrvärme och förnybar energi

Goldman Sachs höjer prognosen för guld, tror priset når 4900 USD
Guld nära 4000 USD och silver 50 USD, därför kan de fortsätta stiga
Are Ukraine’s attacks on Russian energy infrastructure working?
-
 Nyheter3 veckor sedan
OPEC+ missar produktionsmål, stöder oljepriserna
-
 Nyheter4 veckor sedan
Ett samtal om guld, olja, fjärrvärme och förnybar energi
-
 Nyheter2 veckor sedan
Goldman Sachs höjer prognosen för guld, tror priset når 4900 USD
-
 Nyheter2 veckor sedan
Guld nära 4000 USD och silver 50 USD, därför kan de fortsätta stiga
-
Analys4 veckor sedan
Are Ukraine’s attacks on Russian energy infrastructure working?
-

 Nyheter3 veckor sedan
Blykalla och amerikanska Oklo inleder ett samarbete
-

 Nyheter4 veckor sedan
Guldpriset uppe på nya höjder, nu 3750 USD
-
Nyheter3 veckor sedan
Ett samtal om guld, olja, koppar och stål