

Analys
Brent crude again heading towards the $60/bl danger-zone


Following its intraday low of $59.45/bl last week the Brent August contract staged a mild rebound this week and reached an intraday high of $64.1/bl on Monday before falling back down again. This morning it is selling off 1.9% to $61.1/bl on numbers from API last night indicating that US crude oil inventories probably rose 4.85 m bl last week.

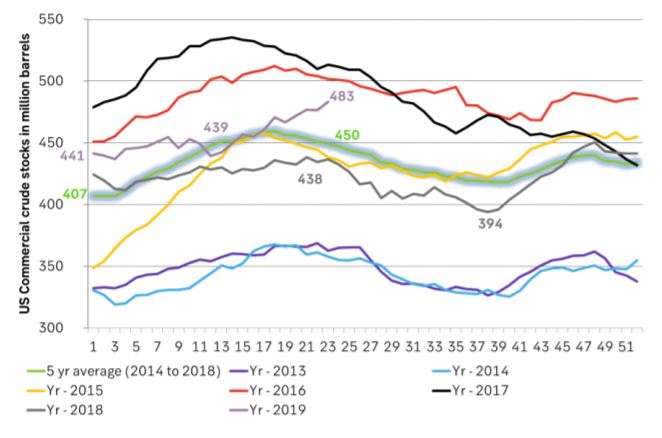
US crude stocks have been rising almost uninterrupted since mid-march. Until late April that was partially along a seasonally normal rise in US crude stocks and thus less pressing. Since early May however the US crude stocks have just continued higher during a period where they usually decline. That is probably why Brent crude managed to reach its ytd high in late April but has been heading lower since then. Depressed by counter seasonally rising US crude stocks now standing 32 m bl above the 5yr average. Thus news by API that they probably continued to rise for yet another week last week is not taken lightly by the market. Negative equity markets this morning is not helping the matter either with “Quitaly” risk (Italy exiting the Euro) being one of the negatives.
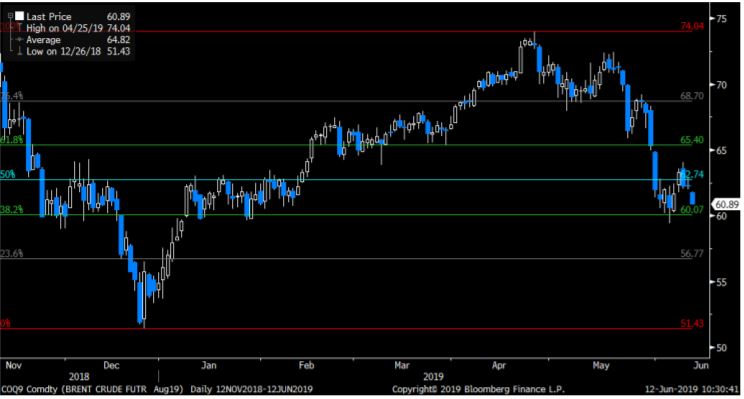
With Brent crude selling off towards $61/bl this morning it has again come dangerously close to the 38.2% Fibo retracement level of $60.07/bl for Brent Aug contract or $59.74/bl for the rolling front month contract below which there is basically no support before $51.43/bl for the Aug contract or $49.93/bl for the rolling front month contract.
The big question is of course why US crude stocks are rising?
If there were no pipeline, refinery or quality issues a rise in US crude and/or product stocks would correctly be interpreted as a residual reflection of a running surplus in the global oil market. A part of this surplus would then naturally pile up in the US as well as everywhere else. Rising US crude and product stocks would then be a telling sing of a global oil market in surplus. This is the natural and instinctive financial market interpretation of the rising US oil inventories: “Wow, the global market must really be running a large surplus if US stocks are rising this much!”
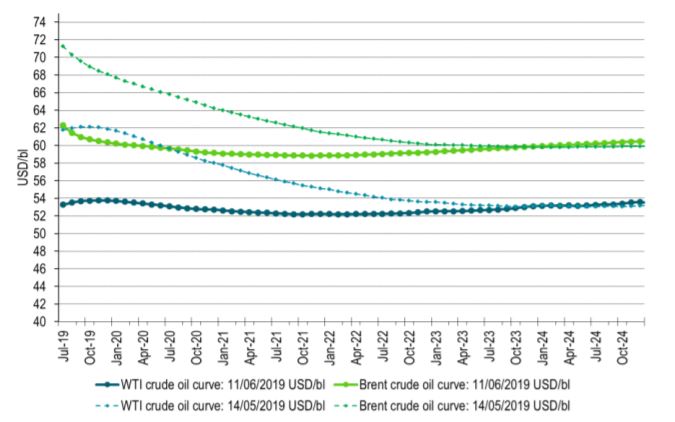
The Brent crude oil curve has however been trading in sharp backwardation until late May pointing instead to a physically very tight global oil market. Since then the Brent backwardation has come off a bit along with speculative sell-off but it is still trading in backwardation. Usually a sell-off in financial oil contracts will lead to a softening in the curve structure as the sell-off mostly takes place at the front end of the curve.
The natural and instinctive interpretation that rising US crude stocks is a reflection of a running surplus in the global oil market does thus not seem to be fully consistent with the backwardated Brent crude curve structure.
The fact is that in the US today we do have pipeline, refinery and quality issues blurring the picture. These issues are leading to a widening Brent to WTI price spread. The wider it gets the more it means that the US has local oil market issues which are not necessarily an equal reflection of the same issues in the global oil market.
- US shale crude oil production continues to rise by the day (+83,000 bl/d MoM in June according to the US EIA). Building of pipeline capacity is under way but is lagging with a lot more capacity coming online late 2019 and 2020. Thus crude oil is for now naturally backing up in the US, depressing WTI and widening the Brent to WTI price spread.
- US refineries have for several reasons been running well below normal and thus processed significantly less crude oil than normal (5yr). In our calculations they have processed 31 m bl/d less than normal since week 6.
- US shale crude oil is very light and contains lots of gasoline. This leads to a natural overproduction of gasoline with such stocks now again above the 5yr average and the gasoline crack has come off again. US refineries may thus prefer to import more medium sour crude and process less shale crude oil thus leading to rising US crude stocks.
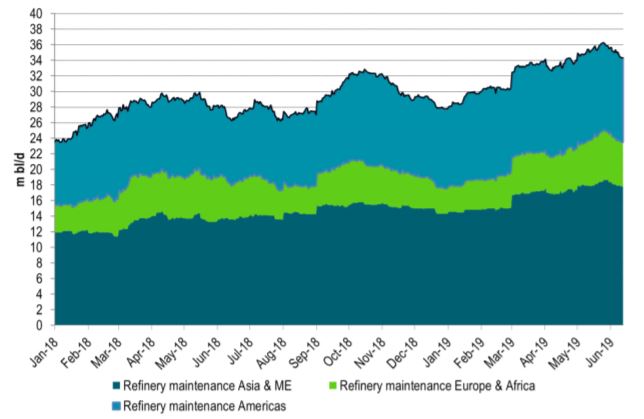
In total there has been a significant amount of refinery capacity out for spring maintenance/turnaround. These have now started to ramp up again and will thus process much more crude oil going forward. US refinery utilization is also rising.
There are obviously sensible concerns for the health of the global economy due to the ongoing US/China trade war with fears that global oil demand growth may falter.
Historically though it is quite rare that global oil demand grows by less than 1.0% per year. Intra-year though the global oil demand may look very gloomy. That is however usually a reflection of a refinery inventory cycle where refineries becomes concerned for global oil product demand, they buy less crude and sell more products from their inventories. Just 1-2% tweak in their normal behaviour drives rippling waves into the global oil market. In the end though it most often turns out that oil demand for the year turned out to be not all that bad after all.
We do think that rising US oil inventories may not be an excellent reflection of the health of the global oil market and as such that the market may over-sell Brent crude on the back of what is happening in the US oil market / US oil inventories.
This is especially so now that we again rapidly are narrowing in on the very important Brent crude oil support level around the $60/bl line. If broken it opens up for a significant over-sell down to towards the $50/bl line.
Ch1: Brent and WTI forward crude curves. Brent still in backwardation
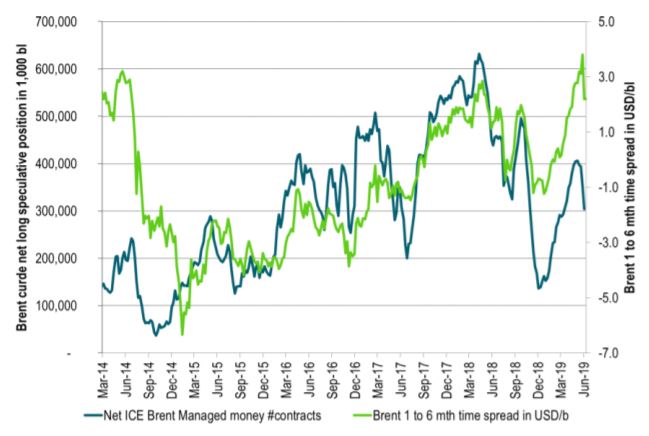
Ch2: Changes in speculative positions do impact the crude curve structure as buying and selling mostly takes place in the front end of the curves. Thus contango and backwardation is not totally a reflection of physical market
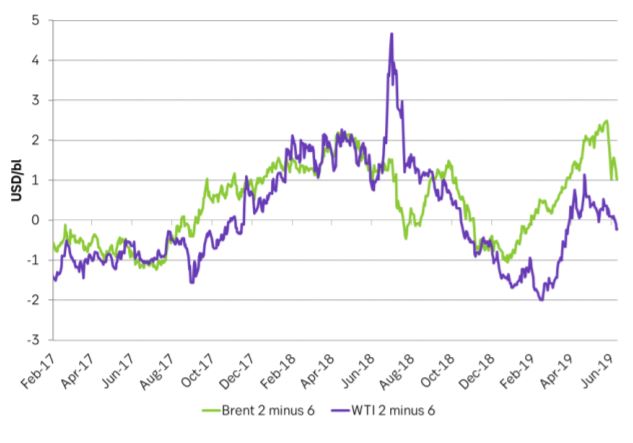
Ch3: Brent crude and WTI curve structures in terms of time spreads of the 2 month contract minus the 6 month contract. Usually they track closely: Same shape = same fundamentals. Significant divergence since late 2018
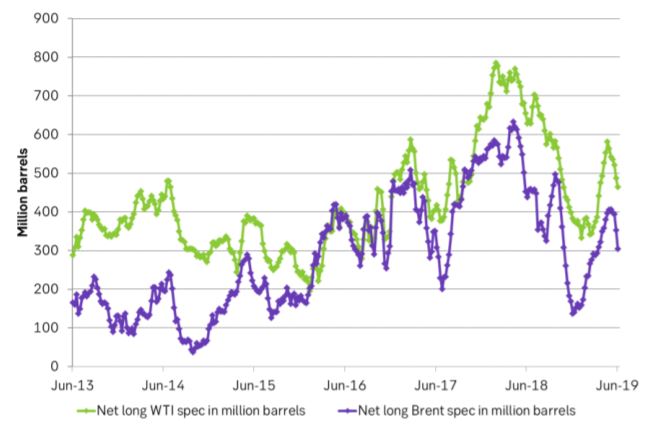
Ch4: Net long specs in Brent and WTI have come off but still room for further sell-off if markets sour more
Ch5: US crude inventories on the rise. Most damaging has been the rise after week 17/18 as US crude stocks usually decline after that. Counter seasonal crude stock rise is bad news
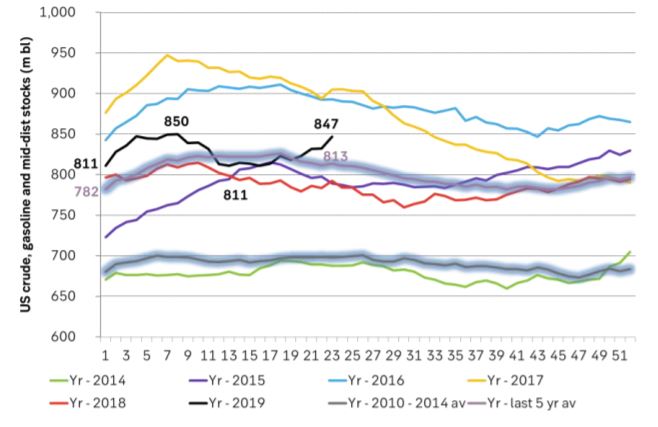
Ch6: Total US crude, gasoline and mid-dist stocks have however risen less dramatically
Ch7: Global refinery outage has been very high this spring. They are now coming back on-line thus consuming and processing more crude oil. But as we seen have seen the Brent crude oil curve is already in backwardation.
Ch8: The Brent Aug contract Fibo retracement levels. No real support before $51.4/bl if $60.07/bl is broken
Selling down on a ”deal”. Brent crude fell 6.2% last week with accelerated weakness towards the end of the week. Close of the week at $87.33/b and low of the week (and on Friday) of $85.8/b. Brent is falling another 4% this morning to $83.7/b on confirmation by Iran that a MoU text has been reached and that it will be signed on Friday this week.

So what is this ”deal” worth? Talk on the desk here this morning is that it is much like ”putting lipstick on a pig” where Trump has to sell this at home as a victory where ”the SoH has reopened”, the nuclear issue will be ironed out over the coming 60 days (or maybe 600 days?) and US consumers are getting a lower gasoline price and maybe US republicans survives the midterm elections.
The importance for Iran is that it emerges as the defacto winner of this war in the eyes of the non-US public world. That Iran now onwards is the ”ruler of the SoH” (combo of geography and new weapons systems like drones) or more softer: ”the guarantor of safe passage through the SoH”.
Iran doesn’t need nuclear weapons any more. Nuclear deterrence doesn’t work any more. Ukraine has made many attacks deep into Russia without being nuked in return. Plenty of Iranian ballistic rockets blasts over Israel but Iran wasn’t nuked in return.
There is no trust between the US and Iran. We don’t know all the details yet of the MoU. But what we do know is that there is no trust between the US and Iran what so ever. This is probably more like a descriptive text on how they can cooperate in a way where both sides keeps tactical leverage. Neither side makes irreversible concessions. Violations can be punished quickly. Cooperation produces immediate benefits.
This is a fragile structure. It can easily break down. There may be details which cannot be overcome. To be seen on Friday. The US has to show that it is willing put enough force behind managing and restraining Israel versus Hezbollah in Lebanon. We have seen that Netanyahu hasn’t listened all that much to Trump’s directives and wishes. This could be a major obstacle.
A gradual reopening is tactically preferable for Iran. A tactical leverage for Iran right now is that global oil stocks have been drawn down towards painful and increasingly dangerous levels with increasing risks for oil price spikes in mid-July to August. This together with US midterm elections on 3 November gives tactical leverage to Iran. Iran probably doesn’t want to fully give up on that leverage. A rapid, full reopening where global stocks are able to refill over the coming 60 days will significantly erode that leverage. If Iran reinstates a closure of the SoH after 60 days (if talks break down again), then the effect won’t be that impactful in terms of prices and the US midterm elections.
So a gradual and partial reopening where global markets gets the oil they need while they are unable to rebuild stocks could be a practical middle way for both parties. Trump can sell it as ”the SoH has reopened” and get affordable gasoline for US consumers. Iran can sell it as ”the SoH has fully reopened, but there is some friction” so flow is only 60-80% of normal.
Not much real demand destruction below $100/b. What we do know is that there is not much real price pain demand destruction for oil globally at an oil price below $100/b. A lot of demand-shock destruction. Fear. But demand should now come roaring back towards normal with fear for exceptionally high prices now is rapidly receding.
Sudden China demand destruction due to EVs? Bullocks. EV share of total Chinese carpool now around 13%. Share of new sales of EVs has reached 50%. This is a very gradual process. It doesn’t make oil demand fall like a rock over night. When EV new sales share reaches 100%, then the gasoline car pool will contract by some 5-10% per year. But that is only gasoline. Sudden reduction in Chinese oil demand is more about shock and risk.
Chinese crude oil imports will come roaring back. At what price? Today’s ”neutral” oil price is $70/b. That is the five year price which has steadily traded around the $70/b mark over the past 3-4 years. With still a risky picture one would think that China and the rest of the world will be big buyers of oil in the range of $70-85/b.
Global demand will likely snap back towards normal, forecasted demand and growth at such prices.
Physical reopening is a gradual process. The physical and practical reopening of the SoH will likely be gradual rather than sudden. And that probably suites Iran tactically as well.
Brent M1 price versus the Brent 5-yr (today’s ”normal” price)

Market is starting to take US/Iran headlines with a pinch of salt. Brent crude rose $2.8/b yesterday to an official close of $112.1/b. But after that it traded as low as $108.05/b before ending late night at around $109.7/b. Through the day it traded in a range of $106.87 – 112.72/b amid a flurry of news or rumors from Iran and the US. ”US temporary sanctions during negotiations” (falls alarm). ”We will bomb Iran” (not anyhow),… etc. While the market is still fluctuating to this kind of news flow, it is starting to take such headlines with a pinch of salt.
We’ll see. Maybe, maybe not. The Brent M1 contract is trading at $110.2/b this morning which very close to the average ticks through yesterday of $110.4/b.
Trump with bearish, verbal intervention whenever Brent trades above $110/b it seems. What seems to be a pattern is that Trump states something like ”very good negotiations going on with Iran”, ”New leaders in Iran are great,..”, ”Great progress in negotiations,…”, ”Deal in sight,..” etc whenever the Brent M1 contract trades above $110/b. An effort to cool the market. These hot air verbal interventions from Trump used to have a heavy bearish impact on prices, but they now seems to have less and less effect unless they are backed by reality.
As far as we can see there has been no real progress in the negotiations between the US and Iran with both sides still standing by their previous demands.
Iran is getting stronger while the cease fire lasts making a return to war for Trump yet harder. Iran is naturally in constant preparation for a return to war given Trump’s steady threats of bombing Iran again. Iran is naturally doing what ever is possible to prepare for a return to war. And every day the cease fire lasts it is better prepared. This naturally makes it more and more difficult and dangerous for the US to return to warring activity versus Iran as the consequences for energy infrastructure in the Persian Gulf will be more and more severe the longer the cease fire lasts. Israel seems to see it this way as well. That the war is not won and that current frozen state of a cease fire gives Iran opportunity to rebuild military and politically.
Global inventories are drawing down day by day. How much? In the meantime the Strait of Hormuz stays closed. There is varying measures and estimates of how much global inventories are drawing down. Our rough estimate, back of the envelope, is that global inventories are drawing down by at least some 10 mb/d or about 300 mb/d in a balance between loss of supply versus demand destruction. Other estimates we see are a monthly draw of 250-270 mb/d. The IEA only ’measured’ a draw in global observable stocks of 117 mb in April with oil on water rising 53 mb while on shore stocks fell 170 mb. But global stocks are hard to measure with large invisible, unmeasured stocks. As such a back of the envelope approach may be better.
Oil products is what the world is consuming. Oil product prices likely to rise while product stocks fall. Strategic Petroleum Reserves (SPR) are predominantly crude oil. Discharging oil from OECD SPR stocks, a sharp reduction in Chinese crude imports and a reduction in global refinery throughput of 6-7 mb/d has helped to keep crude oil markets satisfactorily supplied. But global inventories are drawing down none the less. And oil products is really what the world is consuming. So if global refinery throughput stays subdued, then demand will eventually have to match the supply of oil products. The likely path forward this summer is a steady draw down in jet fuel, diesel and gasoline. Higher prices for these. Then, if possible, higher refinery throughput and higher usage of crude in response to very profitable refinery margins. And lastly sharper draw in crude stocks and higher prices for these. But some 6 mb/d of oil products used to be exported through the Strait of Hormuz. And it may not be so easy to ramp up refinery activity across the world to compensate. Especially as Ukraine continues to damage Russian refineries as well as Russian crude production and export facilities.
Watch oil product stocks and prices as well as Brent calendar 2027. What to watch for this summer is thus oil product inventories falling and oil product premiums to crude rising. Another measure to watch is the Brent crude 2027 contract as it rises steadily day by day as the Strait of Hormuz stays closed and global oil inventories decline. The latter is close to the highest level since the start of the war and keeps rising.
The Brent M1 contract and the Brent 2027 prices and current price of jet fuel in Europe (ARA). All in USD/b

Our back of the envelope calculation of the global shortage created by the closure of the Strait of Hormuz. Note that 3.5 mb/d of discharge from SPR is also a draw. Note also that ’Forced demand loss’ of 2.5 mb/d is probably temporary and will fall back towards zero as logistics are sorted out leaving ’Price demand loss’ to do the job of balancing the market. Thus a shortfall of at least 9 mb/d created by the closure. More if SPR discharge is included and more if Forced demand loss recedes.

Brent is climbing higher. Front-month is at USD 106.3/bl this morning, close to a weekly high and a USD 9/bl jump from Mondays open. This is the move we flagged as a risk earlier in the week: the market shifting from ”a deal is around the corner” to ”this is going to take longer than we thought”.

Analyst Commodities, SEB
During April, rest-of-year Brent remained remarkably stable around USD 90/bl. A stability which rested on one single assumption: the SoH reopens around 1 May. That assumption is now slowly falling apart.
As we highlighted yesterday: every week of delay beyond 1 May adds (theoretically) ish USD 5/bl to the rest-of-year average, as global inventories draw 100 million barrels per week. i.e., a mid-May reopening implies rest-of-year Brent closer to USD 100/bl, and anything pushing into June or July takes us meaningfully higher.
What’s changed in the last 48 hours:
#1: The US military has formally warned that clearing suspected sea mines from SoH could take up to six months. That is a completely different timescale from what the financial market is pricing. Even a political deal tomorrow does not immediately reopen the strait.
#2: Trump has shifted his tone from urgency to ”strategic patience”. In yesterday’s press conference: ”Don’t rush me… I want a great deal.” The market is reading this as a president no longer feeling pressured by timelines, with the naval blockade running in the background.
#3: So far, the military activity is escalating, not de-escalating. Axios reports Iran is laying more mines in SoH. The US 3rd carrier strike group (USS George H.W. Bush) is arriving with two countermine vessels. Trump yesterday ordered the US Navy to destroy any Iranian boats caught laying mines. While CNN reports that the Pentagon is actively drawing up plans to strike Iranian SoH capabilities and individual Iranian military leaders if the ceasefire collapses. i.e., NOT a attitude consistent with an imminent deal!
Spot crude and product prices eased off the early-April highs on a combination of system rerouting and deal optimism. Both now weakening. Goldman estimates April Gulf output is reduced by 14.5 mbl/d, or 57% of pre-war supply, a number that keeps getting worse the longer this drags on.
Demand-side adaptation is ongoing: S. Korea has cut its Middle East crude dependence from 69% to 56% by pulling more from the Americas and Africa, and Japan is kicking off a second round of SPR releases from 1 May. But SPRs are finite.
Ref. to the negotiations, we should not bet on speed. The current Iranian leadership is dominated by genuine hardliners willing to absorb economic pain and run the clock to extract concessions. That is not a setup for a rapid resolution. US/Israeli media briefings keep framing the delay as ”internal Iranian divisions”, the reality is more complicated and points toward weeks and months, not days.
Our point is that the complexity is large, and higher prices have only just started (given a scenario where the negotiations drag out in time). The market spent April leaning on the USD 90/bl rest-of-year assumption; that case is diminishing by the hour. If ”early May reopening” is replaced by ”June, July or later” over the next week or two, both crude and products have meaningful room to reprice higher from here. There is a high risk being short energy and betting on any immediate political resolution(!).


Vattenfalls och Industrikrafts kärnkraftsbolag Videberg Kraft har valt Rolls-Royce SMR
Selling down on a ”deal”

Sommarväder skapar prisrally på elbörsen
Oil product price pain is set to rise as the Strait of Hormuz stays closed into summer

