Analys
Brent crude again heading towards the $60/bl danger-zone


Following its intraday low of $59.45/bl last week the Brent August contract staged a mild rebound this week and reached an intraday high of $64.1/bl on Monday before falling back down again. This morning it is selling off 1.9% to $61.1/bl on numbers from API last night indicating that US crude oil inventories probably rose 4.85 m bl last week.


US crude stocks have been rising almost uninterrupted since mid-march. Until late April that was partially along a seasonally normal rise in US crude stocks and thus less pressing. Since early May however the US crude stocks have just continued higher during a period where they usually decline. That is probably why Brent crude managed to reach its ytd high in late April but has been heading lower since then. Depressed by counter seasonally rising US crude stocks now standing 32 m bl above the 5yr average. Thus news by API that they probably continued to rise for yet another week last week is not taken lightly by the market. Negative equity markets this morning is not helping the matter either with “Quitaly” risk (Italy exiting the Euro) being one of the negatives.
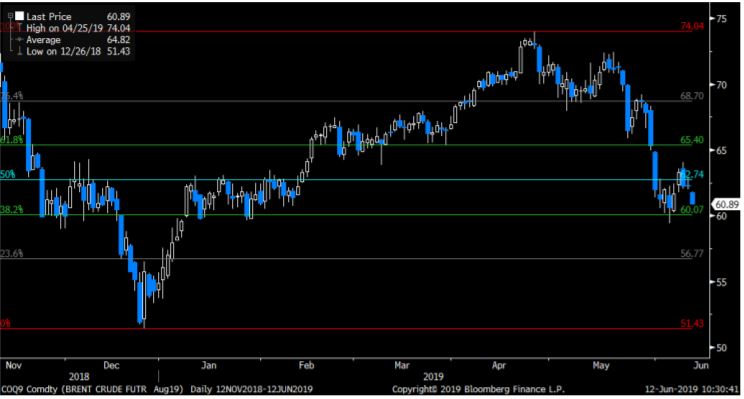
With Brent crude selling off towards $61/bl this morning it has again come dangerously close to the 38.2% Fibo retracement level of $60.07/bl for Brent Aug contract or $59.74/bl for the rolling front month contract below which there is basically no support before $51.43/bl for the Aug contract or $49.93/bl for the rolling front month contract.
The big question is of course why US crude stocks are rising?
If there were no pipeline, refinery or quality issues a rise in US crude and/or product stocks would correctly be interpreted as a residual reflection of a running surplus in the global oil market. A part of this surplus would then naturally pile up in the US as well as everywhere else. Rising US crude and product stocks would then be a telling sing of a global oil market in surplus. This is the natural and instinctive financial market interpretation of the rising US oil inventories: “Wow, the global market must really be running a large surplus if US stocks are rising this much!”
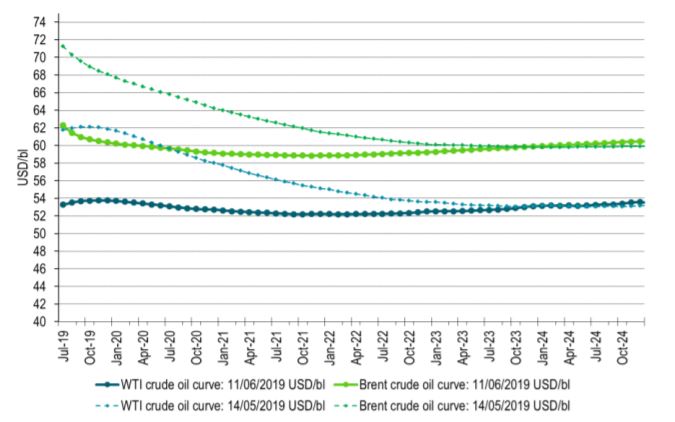
The Brent crude oil curve has however been trading in sharp backwardation until late May pointing instead to a physically very tight global oil market. Since then the Brent backwardation has come off a bit along with speculative sell-off but it is still trading in backwardation. Usually a sell-off in financial oil contracts will lead to a softening in the curve structure as the sell-off mostly takes place at the front end of the curve.
The natural and instinctive interpretation that rising US crude stocks is a reflection of a running surplus in the global oil market does thus not seem to be fully consistent with the backwardated Brent crude curve structure.
The fact is that in the US today we do have pipeline, refinery and quality issues blurring the picture. These issues are leading to a widening Brent to WTI price spread. The wider it gets the more it means that the US has local oil market issues which are not necessarily an equal reflection of the same issues in the global oil market.
- US shale crude oil production continues to rise by the day (+83,000 bl/d MoM in June according to the US EIA). Building of pipeline capacity is under way but is lagging with a lot more capacity coming online late 2019 and 2020. Thus crude oil is for now naturally backing up in the US, depressing WTI and widening the Brent to WTI price spread.
- US refineries have for several reasons been running well below normal and thus processed significantly less crude oil than normal (5yr). In our calculations they have processed 31 m bl/d less than normal since week 6.
- US shale crude oil is very light and contains lots of gasoline. This leads to a natural overproduction of gasoline with such stocks now again above the 5yr average and the gasoline crack has come off again. US refineries may thus prefer to import more medium sour crude and process less shale crude oil thus leading to rising US crude stocks.
In total there has been a significant amount of refinery capacity out for spring maintenance/turnaround. These have now started to ramp up again and will thus process much more crude oil going forward. US refinery utilization is also rising.
There are obviously sensible concerns for the health of the global economy due to the ongoing US/China trade war with fears that global oil demand growth may falter.
Historically though it is quite rare that global oil demand grows by less than 1.0% per year. Intra-year though the global oil demand may look very gloomy. That is however usually a reflection of a refinery inventory cycle where refineries becomes concerned for global oil product demand, they buy less crude and sell more products from their inventories. Just 1-2% tweak in their normal behaviour drives rippling waves into the global oil market. In the end though it most often turns out that oil demand for the year turned out to be not all that bad after all.
We do think that rising US oil inventories may not be an excellent reflection of the health of the global oil market and as such that the market may over-sell Brent crude on the back of what is happening in the US oil market / US oil inventories.
This is especially so now that we again rapidly are narrowing in on the very important Brent crude oil support level around the $60/bl line. If broken it opens up for a significant over-sell down to towards the $50/bl line.
Ch1: Brent and WTI forward crude curves. Brent still in backwardation

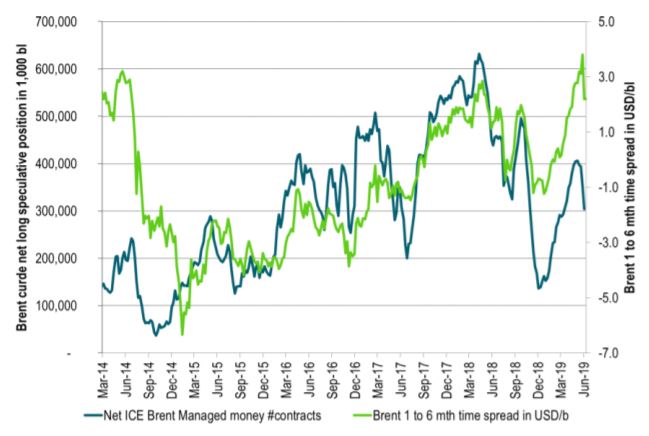
Ch2: Changes in speculative positions do impact the crude curve structure as buying and selling mostly takes place in the front end of the curves. Thus contango and backwardation is not totally a reflection of physical market

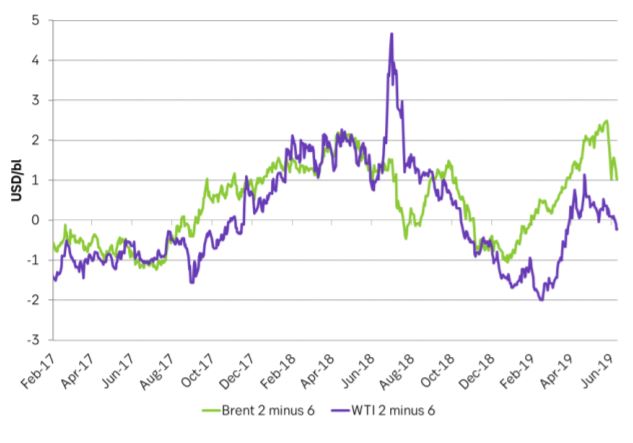
Ch3: Brent crude and WTI curve structures in terms of time spreads of the 2 month contract minus the 6 month contract. Usually they track closely: Same shape = same fundamentals. Significant divergence since late 2018

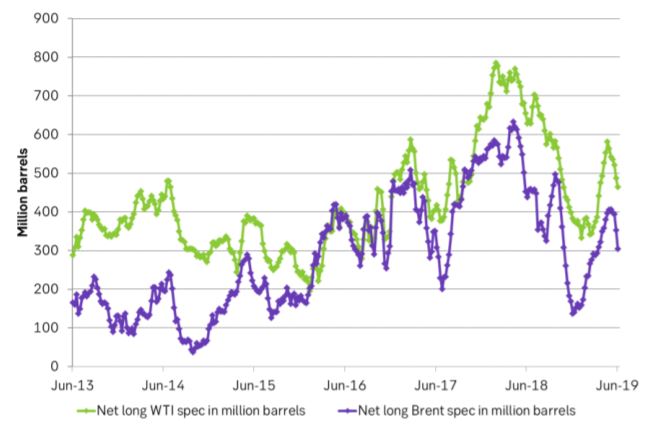
Ch4: Net long specs in Brent and WTI have come off but still room for further sell-off if markets sour more

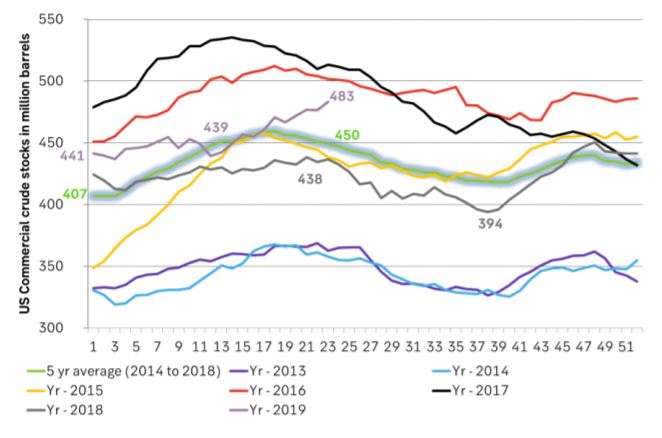
Ch5: US crude inventories on the rise. Most damaging has been the rise after week 17/18 as US crude stocks usually decline after that. Counter seasonal crude stock rise is bad news

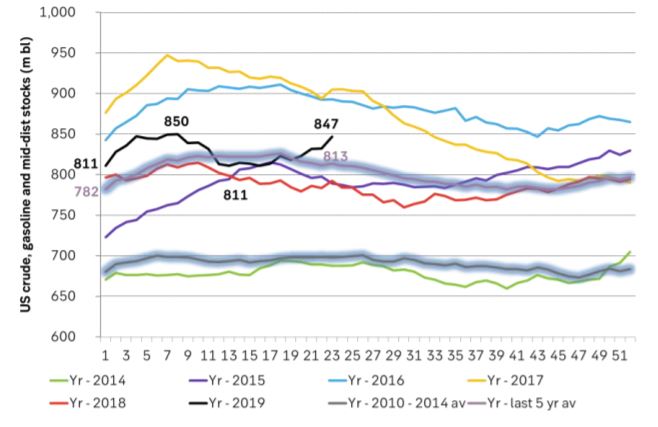
Ch6: Total US crude, gasoline and mid-dist stocks have however risen less dramatically

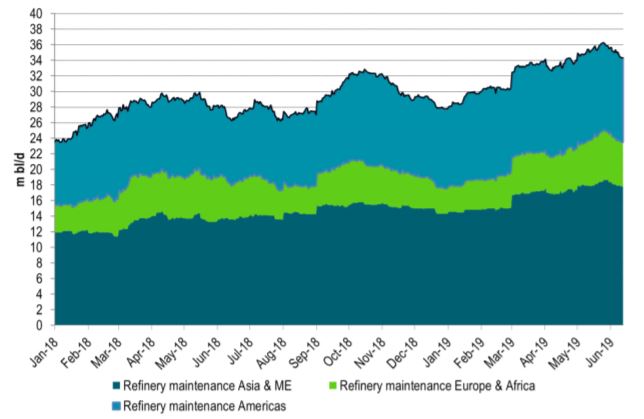
Ch7: Global refinery outage has been very high this spring. They are now coming back on-line thus consuming and processing more crude oil. But as we seen have seen the Brent crude oil curve is already in backwardation.

Ch8: The Brent Aug contract Fibo retracement levels. No real support before $51.4/bl if $60.07/bl is broken