

Analys
Oil price is mostly fundamentals, not geopolitical risk premium

Brent crude has recovered to above USD 90/b again. Risk premium due to Israel/Gaza? Maybe not so much at all. Latest data from the IEA indicates that the global oil market ran an implied deficit of 2.1 m b/d in August, a deficit of 0.7 m b/d in September and a likely deficit of 1.2 m b/d in Q4-23. Inventory draws have mostly taken place in floating stocks and in non-OECD. Inventories which are typically harder to track. Demand growth of 2.3 m b/d this year has more or less entirely taken place in non-OECD. As such it is not so strange that inventory draws have first taken place just there as well. But if we continue to run a deficit of 1.2 m b/d in Q4-23 then we should eventually see OECD stocks starting to draw down as well. This should keep oil prices well supported in Q4-23. The US EIA last week lifted its outlook for Brent crude for 2024 to USD 95/b (+7) on the back of slowing US shale oil growth leaving OPEC in good control of the market.

Brent crude sold off sharply at the end of September as longer dated bond yields rallied and markets feared that central banks would keep rates high for longer leading to a recession in the end with associated weak oil demand and falling oil price. One can of course question if that is the right interpretation. If market had really turned bearish on the economic outlook (recession, crash,..), then longer dated bond yields should have gone down and not up as they did. Hm, well, maybe oil was just ripe for a bearish correction following a long upturn in prices since late June and only needed some kind of bearish catalyst story to set off that correction in late September. The sell-off was short-lived as the attack on Israel by Hamas on 7 October made oil jump back up above USD 90/b again. The low-point in the recent sell-off was a close of USD 84/b on 6 October. With Brent crude now at USD 90/b the most immediate interpretation is that we now have a USD 6/b risk premium in the oil price due to Israel/Hamas/Gaza. The fear is that the conflict might spiral out and eventually lead to real loss of supply with Iran being most at risk there. But such geopolitical risk premiums are usually short-lived unless actual supply disruptions occur. The most immediate fear is that the US would impose harsher sanctions towards Iran which is Hamas’ biggest backer. But US Treasury Secretary Jannet Yellen stated on 11 Oct that the US has no plans to impose new sanctions on Iran.
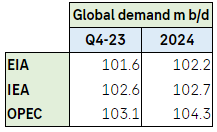
So let’s leave possible recession fears as well as geopolitical risk premiums aside and instead just look at the current state and the outlook for the oil market. The three main monthly oil market reports from IEA, US EIA and OPEC were out last week. One thing that stands out is a continued disagreement of what oil demand is today and what it will be tomorrow. On 2024 the IEA and the EIA partially agrees while OPEC is in a camp of its own. But one thing is to have strongly diverging outlooks for demand in 2024. Another is to have extremely wide estimates for what demand is here and now in Q4-23. This shows that there is still a very high uncertainty of what is actually the current state of the oil market. Deficit, balanced, surplus?
The most prominent of the three reports, the IEA, made few changes to its overall projects vs. its September report. Changes were typically +/- 100 k b/d or less for most items. The reports was however still very interesting with respect to clues to what is the actual state of the market balance. The proof of the pudding is always the change in oil inventories and as such always in hindsight. IEA data showed that global oil inventories declined by 63.8 m b in August which equals a deficit of 2.1 m b/d. Preliminary inventory data for September indicates an implied deficit of 0.7 m b/d.
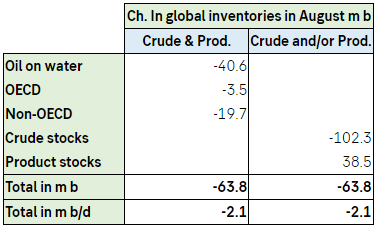
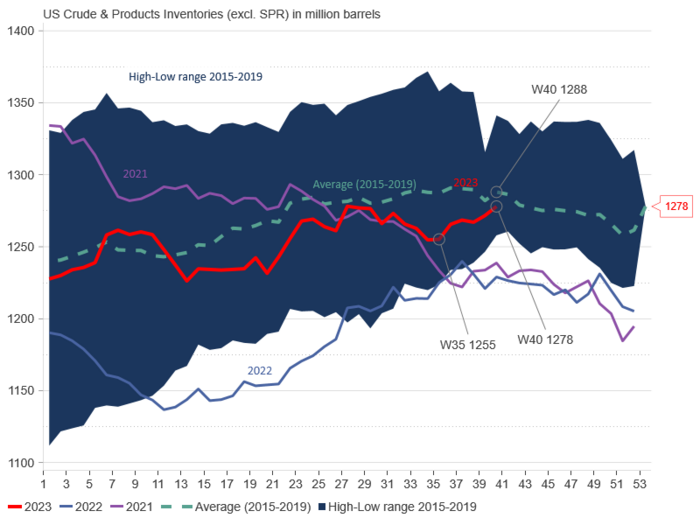
Important here is that the stock draws in August mostly took place in oil on water and in non-OECD. These stocks are typically less easily observable. Oil markets are often highly focused on more easily observable data like the weekly US oil inventories as well as EU and Japan. The US commercial crude and product stocks have moved upwards since week 35 (late August) so that in the last data point the US commercial stocks are only 10 m b below the 2015-19 seasonal average. This has undoubtedly been a bearish factor for oil prices lately and probably contributed to the sell-off in late September, early October.
US crude and product stocks (excl. SPR)
1) The global August and September (indic.) inventory data from IEA gives credibility to its current assessment of the global oil market. For Q4-23 it estimates Call-on-OPEC at 29.3 m b/d. Russia and Saudi Arabia last week held a joint statement heralding that they would keep production at current level to the end of year. With OPEC production steady at 28 m b/d it implies a global oil market deficit of 1.2 m b/d. For H1-24 its estimates a call-on-OPEC of 27.7 m b/d. This means that Saudi Arabia and Russia will likely stick to their current production levels also in H1-24. But then the market will likely be balanced rather than in deficit like it has been in Q3-23 and Q4-23.
2) The global oil market is very large with significant dynamical time lags. IEA estimates a global consumption growth this year of 2.3 m b/d. China accounts for 77% of this and non-OECD accounts for 97%. So oil demand growth this year is all taking place in non-OECD. As such it is not so surprising that inventory draws have been taking place there and on-water rather than in the OECD. But a global deficit will eventually involve also the OECD inventories. The demand-pull this year has been all about non-OECD. First you draw down non-OECD supply chains, inventories and on-water oil. Then you start to pull more oil from the wider market which eventually involve a draw-down also in OECD inventories. IEA’s estimate of an implied deficit of about 1.2 m b/d in Q4-23. So if we have already drawn down non-OECD supply chains and oil on water we might start to see a significant draw in OECD stocks in Q4-23 if the market runs an estimated 1.2 m b/d as estimated by the IEA.
3) Worth noting however is IEA’s warning that higher oil prices are starting to hurt demand. Demand in Nigeria, Pakistan and Egypt are all down 10% or more while US demand for gasoline also has shown significant demand weaknesses. For 2024 the IEA only projects a global demand growth of 0.9 m b/d YoY along with weaker global economic growth. Non-OPEC production continues to grow robustly at 1.3 m b/d with the result that call-on-OPEC falls from 28.8 m b/d this year to 28.3 m b/d next year. This is of course negative for OPEC and gives a bearish tint to the oil market next year. But it is still not so weak that OPEC will give up on holding the price where they (Saudi/Russia) want it to be. But implies that Saudi/Russia/OPEC will have to stick to current production levels through most of 2024.
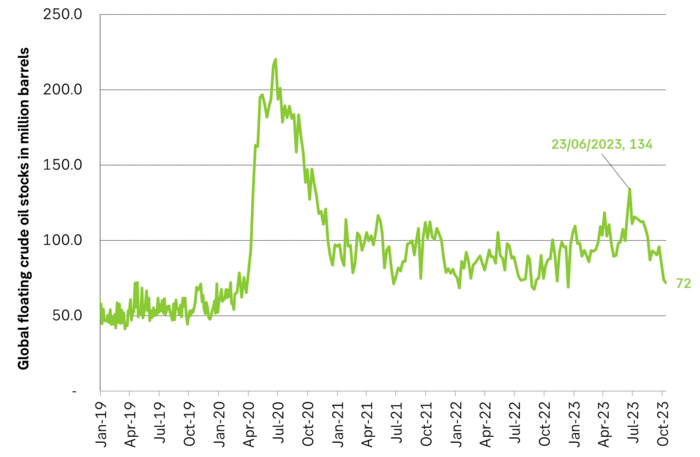
Floating crude oil stocks in million barrels
Some rebound but not much. Brent crude rebounded 1.5% yesterday to $65.47/b. This morning it is inching 0.2% up to $65.6/b. The lowest close last week was on Thursday at $64.11/b.

The curve structure is almost as week as it was before the weekend. The rebound we now have gotten post the message from OPEC+ over the weekend is to a large degree a rebound along the curve rather than much strengthening at the front-end of the curve. That part of the curve structure is almost as weak as it was last Thursday.
We are still on a weakening path. The message from OPEC+ over the weekend was we are still on a weakening path with rising supply from the group. It is just not as rapidly weakening as was feared ahead of the weekend when a quota hike of 500 kb/d/mth for November was discussed.
The Brent curve is on its way to full contango with Brent dipping into the $50ies/b. Thus the ongoing weakening we have had in the crude curve since the start of the year, and especially since early June, will continue until the Brent crude oil forward curve is in full contango along with visibly rising US and OECD oil inventories. The front-month Brent contract will then flip down towards the $60/b-line and below into the $50ies/b.
At what point will OPEC+ turn to cuts? The big question then becomes: When will OPEC+ turn around to make some cuts? At what (price) point will they choose to stabilize the market? Because for sure they will. Higher oil inventories, some more shedding of drilling rigs in US shale and Brent into the 50ies somewhere is probably where the group will step in.
There is nothing we have seen from the group so far which indicates that they will close their eyes, let the world drown in oil and the oil price crash to $40/b or below.
The message from OPEC+ is also about balance and stability. The world won’t drown in oil in 2026. The message from the group as far as we manage to interpret it is twofold: 1) Taking back market share which requires a lower price for non-OPEC+ to back off a bit, and 2) Oil market stability and balance. It is not just about 1. Thus fretting about how we are all going to drown in oil in 2026 is totally off the mark by just focusing on point 1.
When to buy cal 2026? Before Christmas when Brent hits $55/b and before OPEC+ holds its last meeting of the year which is likely to be in early December.
Brent crude oil prices have rebounded a bit along the forward curve. Not much strengthening in the structure of the curve. The front-end backwardation is not much stronger today than on its weakest level so far this year which was on Thursday last week.

The front-end backwardation fell to its weakest level so far this year on Thursday last week. A slight pickup yesterday and today, but still very close to the weakest year to date. More oil from OPEC+ in the coming months and softer demand and rising inventories. We are heading for yet softer levels.

Down to the lowest since early May. Brent crude has fallen sharply the latest four days. It closed at USD 64.11/b yesterday which is the lowest since early May. It is staging a 1.3% rebound this morning along with gains in both equities and industrial metals with an added touch of support from a softer USD on top.
What stands out the most to us this week is the collapse in the Dubai one to three months time-spread.
Dubai is medium sour crude. OPEC+ is in general medium sour crude production. Asian refineries are predominantly designed to process medium sour crude. So Dubai is the real measure of the balance between OPEC+ holding back or not versus Asian oil demand for consumption and stock building.
A sharp weakening of the front-end of the Dubai curve. The front-end of the Dubai crude curve has been holding out very solidly throughout this summer while the front-end of the Brent and WTI curves have been steadily softening. But the strength in the Dubai curve in our view was carrying the crude oil market in general. A source of strength in the crude oil market. The core of the strength.
The now finally sharp decline of the front-end of the Dubai crude curve is thus a strong shift. Weakness in the Dubai crude marker is weakness in the core of the oil market. The core which has helped to hold the oil market elevated.
Facts supports the weakening. Add in facts of Iraq lifting production from Kurdistan through Turkey. Saudi Arabia lifting production to 10 mb/d in September (normal production level) and lifting exports as well as domestic demand for oil for power for air con is fading along with summer heat. Add also in counter seasonal rise in US crude and product stocks last week. US oil stocks usually decline by 1.3 mb/week this time of year. Last week they instead rose 6.4 mb/week (+7.2 mb if including SPR). Total US commercial oil stocks are now only 2.1 mb below the 2015-19 seasonal average. US oil stocks normally decline from now to Christmas. If they instead continue to rise, then it will be strongly counter seasonal rise and will create a very strong bearish pressure on oil prices.
Will OPEC+ lift its voluntary quotas by zero, 137 kb/d, 500 kb/d or 1.5 mb/d? On Sunday of course OPEC+ will decide on how much to unwind of the remaining 1.5 mb/d of voluntary quotas for November. Will it be 137 kb/d yet again as for October? Will it be 500 kb/d as was talked about earlier this week? Or will it be a full unwind in one go of 1.5 mb/d? We think most likely now it will be at least 500 kb/d and possibly a full unwind. We discussed this in a not earlier this week: ”500 kb/d of voluntary quotas in October. But a full unwind of 1.5 mb/d”
The strength in the front-end of the Dubai curve held out through summer while Brent and WTI curve structures weakened steadily. That core strength helped to keep flat crude oil prices elevated close to the 70-line. Now also the Dubai curve has given in.

Brent crude oil forward curves

Total US commercial stocks now close to normal. Counter seasonal rise last week. Rest of year?

Total US crude and product stocks on a steady trend higher.

Analys
OPEC+ will likely unwind 500 kb/d of voluntary quotas in October. But a full unwind of 1.5 mb/d in one go could be in the cards
Down to mid-60ies as Iraq lifts production while Saudi may be tired of voluntary cut frugality. The Brent December contract dropped 1.6% yesterday to USD 66.03/b. This morning it is down another 0.3% to USD 65.8/b. The drop in the price came on the back of the combined news that Iraq has resumed 190 kb/d of production in Kurdistan with exports through Turkey while OPEC+ delegates send signals that the group will unwind the remaining 1.65 mb/d (less the 137 kb/d in October) of voluntary cuts at a pace of 500 kb/d per month pace.
Signals of accelerated unwind and Iraqi increase may be connected. Russia, Kazakhstan and Iraq were main offenders versus the voluntary quotas they had agreed to follow. Russia had a production ’debt’ (cumulative overproduction versus quota) of close to 90 mb in March this year while Kazakhstan had a ’debt’ of about 60 mb and the same for Iraq. This apparently made Saudi Arabia angry this spring. Why should Saudi Arabia hold back if the other voluntary cutters were just freeriding? Thus the sudden rapid unwinding of voluntary cuts. That is at least one angle of explanations for the accelerated unwinding.
If the offenders with production debts then refrained from lifting production as the voluntary cuts were rapidly unwinded, then they could ’pay back’ their ’debts’ as they would under-produce versus the new and steadily higher quotas.
Forget about Kazakhstan. Its production was just too far above the quotas with no hope that the country would hold back production due to cross-ownership of oil assets by international oil companies. But Russia and Iraq should be able to do it.
Iraqi cumulative overproduction versus quotas could reach 85-90 mb in October. Iraq has however steadily continued to overproduce by 3-5 mb per month. In July its new and gradually higher quota came close to equal with a cumulative overproduction of only 0.6 mb that month. In August again however its production had an overshoot of 100 kb/d or 3.1 mb for the month. Its cumulative production debt had then risen to close to 80 mb. We don’t know for September yet. But looking at October we now know that its production will likely average close to 4.5 mb/d due to the revival of 190 kb/d of production in Kurdistan. Its quota however will only be 4.24 mb/d. Its overproduction in October will thus likely be around 250 kb/d above its quota with its production debt rising another 7-8 mb to a total of close to 90 mb.
Again, why should Saudi Arabia be frugal while Iraq is freeriding. Better to get rid of the voluntary quotas as quickly as possible and then start all over with clean sheets.
Unwinding the remaining 1.513 mb/d in one go in October? If OPEC+ unwinds the remaining 1.513 mb/d of voluntary cuts in one big go in October, then Iraq’s quota will be around 4.4 mb/d for October versus its likely production of close to 4.5 mb/d for the coming month..
OPEC+ should thus unwind the remaining 1.513 mb/d (1.65 – 0.137 mb/d) in one go for October in order for the quota of Iraq to be able to keep track with Iraq’s actual production increase.
October 5 will show how it plays out. But a quota unwind of at least 500 kb/d for Oct seems likely. An overall increase of at least 500 kb/d in the voluntary quota for October looks likely. But it could be the whole 1.513 mb/d in one go. If the increase in the quota is ’only’ 500 kb/d then Iraqi cumulative production will still rise by 5.7 mb to a total of 85 mb in October.
Iraqi production debt versus quotas will likely rise by 5.7 mb in October if OPEC+ only lifts the overall quota by 500 kb/d in October. Here assuming historical production debt did not rise in September. That Iraq lifts its production by 190 kb/d in October to 4.47 mb/d (August level + 190 kb/d) and that OPEC+ unwinds 500 kb/d of the remining quotas in October when they decide on this on 5 October.


Blykalla, Evroc och Studsvik vill bygga kärnkraftsdrivna datacenter i Sverige

Toppmöte om framtidens kärnkraft runt Östersjön hölls idag

Nytt prisrekord, guld stiger över 4000 USD

Goldman Sachs höjer prognosen för guld, tror priset når 4900 USD
More weakness and lower price levels ahead, but the world won’t drown in oil in 2026

Mahvie Minerals i en guldtrend
Volatile but going nowhere. Brent crude circles USD 66 as market weighs surplus vs risk

Aktier i guldbolag laggar priset på guld

Kinas elproduktion slog nytt rekord i augusti, vilket även kolkraft gjorde

Tyskland har så höga elpriser att företag inte har råd att använda elektricitet
-
 Nyheter4 veckor sedan
Mahvie Minerals i en guldtrend
-
Analys4 veckor sedan
Volatile but going nowhere. Brent crude circles USD 66 as market weighs surplus vs risk
-
 Nyheter4 veckor sedan
Aktier i guldbolag laggar priset på guld
-
 Nyheter3 veckor sedan
Kinas elproduktion slog nytt rekord i augusti, vilket även kolkraft gjorde
-
Nyheter3 veckor sedan
Tyskland har så höga elpriser att företag inte har råd att använda elektricitet
-

 Nyheter4 veckor sedan
Guld når sin högsta nivå någonsin, nu även justerat för inflation
-

 Nyheter4 veckor sedan
Det stigande guldpriset en utmaning för smyckesköpare
-
Analys4 veckor sedan
Waiting for the surplus while we worry about Israel and Qatar