Analys
Oil price is mostly fundamentals, not geopolitical risk premium

Brent crude has recovered to above USD 90/b again. Risk premium due to Israel/Gaza? Maybe not so much at all. Latest data from the IEA indicates that the global oil market ran an implied deficit of 2.1 m b/d in August, a deficit of 0.7 m b/d in September and a likely deficit of 1.2 m b/d in Q4-23. Inventory draws have mostly taken place in floating stocks and in non-OECD. Inventories which are typically harder to track. Demand growth of 2.3 m b/d this year has more or less entirely taken place in non-OECD. As such it is not so strange that inventory draws have first taken place just there as well. But if we continue to run a deficit of 1.2 m b/d in Q4-23 then we should eventually see OECD stocks starting to draw down as well. This should keep oil prices well supported in Q4-23. The US EIA last week lifted its outlook for Brent crude for 2024 to USD 95/b (+7) on the back of slowing US shale oil growth leaving OPEC in good control of the market.


Brent crude sold off sharply at the end of September as longer dated bond yields rallied and markets feared that central banks would keep rates high for longer leading to a recession in the end with associated weak oil demand and falling oil price. One can of course question if that is the right interpretation. If market had really turned bearish on the economic outlook (recession, crash,..), then longer dated bond yields should have gone down and not up as they did. Hm, well, maybe oil was just ripe for a bearish correction following a long upturn in prices since late June and only needed some kind of bearish catalyst story to set off that correction in late September. The sell-off was short-lived as the attack on Israel by Hamas on 7 October made oil jump back up above USD 90/b again. The low-point in the recent sell-off was a close of USD 84/b on 6 October. With Brent crude now at USD 90/b the most immediate interpretation is that we now have a USD 6/b risk premium in the oil price due to Israel/Hamas/Gaza. The fear is that the conflict might spiral out and eventually lead to real loss of supply with Iran being most at risk there. But such geopolitical risk premiums are usually short-lived unless actual supply disruptions occur. The most immediate fear is that the US would impose harsher sanctions towards Iran which is Hamas’ biggest backer. But US Treasury Secretary Jannet Yellen stated on 11 Oct that the US has no plans to impose new sanctions on Iran.
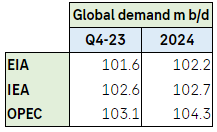
So let’s leave possible recession fears as well as geopolitical risk premiums aside and instead just look at the current state and the outlook for the oil market. The three main monthly oil market reports from IEA, US EIA and OPEC were out last week. One thing that stands out is a continued disagreement of what oil demand is today and what it will be tomorrow. On 2024 the IEA and the EIA partially agrees while OPEC is in a camp of its own. But one thing is to have strongly diverging outlooks for demand in 2024. Another is to have extremely wide estimates for what demand is here and now in Q4-23. This shows that there is still a very high uncertainty of what is actually the current state of the oil market. Deficit, balanced, surplus?

The most prominent of the three reports, the IEA, made few changes to its overall projects vs. its September report. Changes were typically +/- 100 k b/d or less for most items. The reports was however still very interesting with respect to clues to what is the actual state of the market balance. The proof of the pudding is always the change in oil inventories and as such always in hindsight. IEA data showed that global oil inventories declined by 63.8 m b in August which equals a deficit of 2.1 m b/d. Preliminary inventory data for September indicates an implied deficit of 0.7 m b/d.

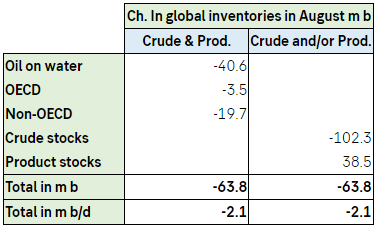
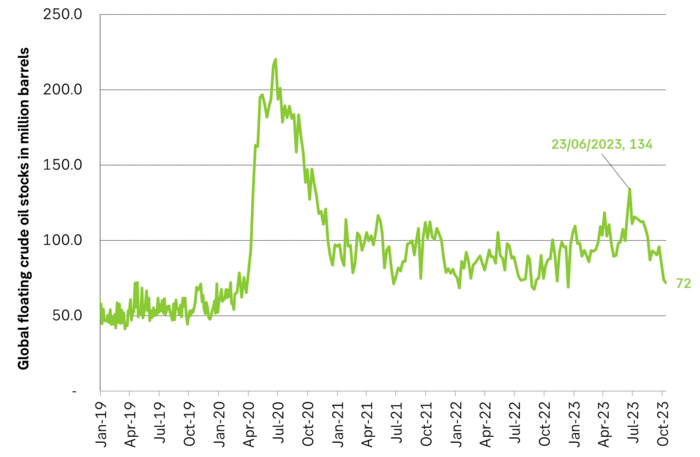
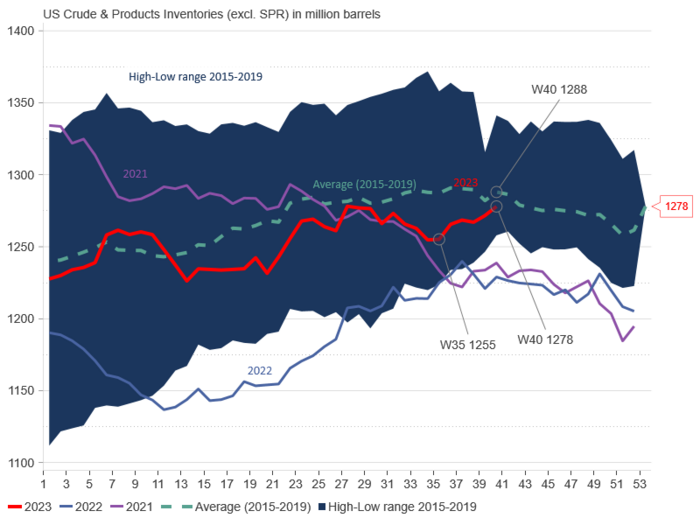
Important here is that the stock draws in August mostly took place in oil on water and in non-OECD. These stocks are typically less easily observable. Oil markets are often highly focused on more easily observable data like the weekly US oil inventories as well as EU and Japan. The US commercial crude and product stocks have moved upwards since week 35 (late August) so that in the last data point the US commercial stocks are only 10 m b below the 2015-19 seasonal average. This has undoubtedly been a bearish factor for oil prices lately and probably contributed to the sell-off in late September, early October.
US crude and product stocks (excl. SPR)

1) The global August and September (indic.) inventory data from IEA gives credibility to its current assessment of the global oil market. For Q4-23 it estimates Call-on-OPEC at 29.3 m b/d. Russia and Saudi Arabia last week held a joint statement heralding that they would keep production at current level to the end of year. With OPEC production steady at 28 m b/d it implies a global oil market deficit of 1.2 m b/d. For H1-24 its estimates a call-on-OPEC of 27.7 m b/d. This means that Saudi Arabia and Russia will likely stick to their current production levels also in H1-24. But then the market will likely be balanced rather than in deficit like it has been in Q3-23 and Q4-23.
2) The global oil market is very large with significant dynamical time lags. IEA estimates a global consumption growth this year of 2.3 m b/d. China accounts for 77% of this and non-OECD accounts for 97%. So oil demand growth this year is all taking place in non-OECD. As such it is not so surprising that inventory draws have been taking place there and on-water rather than in the OECD. But a global deficit will eventually involve also the OECD inventories. The demand-pull this year has been all about non-OECD. First you draw down non-OECD supply chains, inventories and on-water oil. Then you start to pull more oil from the wider market which eventually involve a draw-down also in OECD inventories. IEA’s estimate of an implied deficit of about 1.2 m b/d in Q4-23. So if we have already drawn down non-OECD supply chains and oil on water we might start to see a significant draw in OECD stocks in Q4-23 if the market runs an estimated 1.2 m b/d as estimated by the IEA.
3) Worth noting however is IEA’s warning that higher oil prices are starting to hurt demand. Demand in Nigeria, Pakistan and Egypt are all down 10% or more while US demand for gasoline also has shown significant demand weaknesses. For 2024 the IEA only projects a global demand growth of 0.9 m b/d YoY along with weaker global economic growth. Non-OPEC production continues to grow robustly at 1.3 m b/d with the result that call-on-OPEC falls from 28.8 m b/d this year to 28.3 m b/d next year. This is of course negative for OPEC and gives a bearish tint to the oil market next year. But it is still not so weak that OPEC will give up on holding the price where they (Saudi/Russia) want it to be. But implies that Saudi/Russia/OPEC will have to stick to current production levels through most of 2024.
Floating crude oil stocks in million barrels