

Analys
Mixed signals on demand but world will need more oil from OPEC but the group is cutting

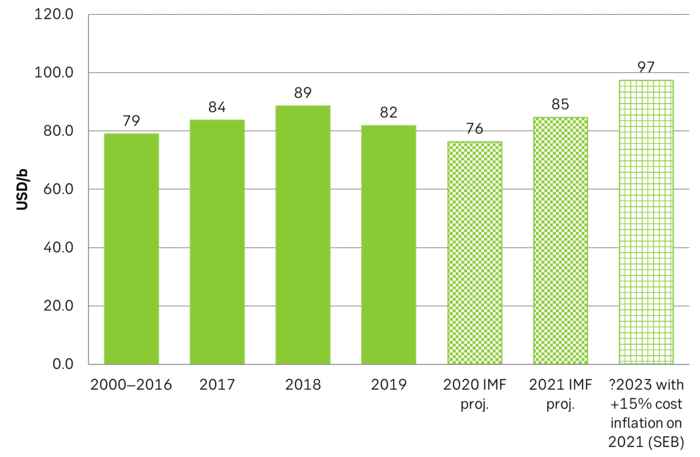
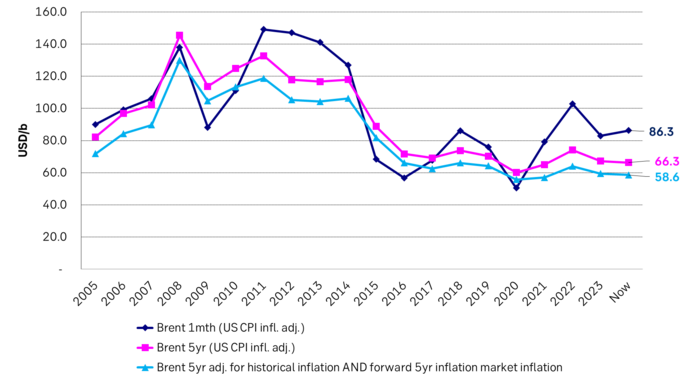
A world where OPEC(+) is in charge is a very different world than we are used to during the ultra-bearish 2015-19 period where US shale AND offshore non-OPEC production both were booming. Brent averaged USD 58/b nominal and USD 70/b in real terms that period. The Brent 5yr contract is trading at USD 66/b nominal or USD 58.6/b in real-terms assuming no market power to OPEC+ in 2028. Could be, but we don’t think so as US Permian shale is projected by major players to peak next 5yrs. When OPEC(+) is in charge the group will cut according to needs. For Saudi that is around USD 85/b but maybe as high as USD 97/b if budget costs rise with inflation

No major revisions to outlook by the IEA last week in its monthly Oil Market Report.
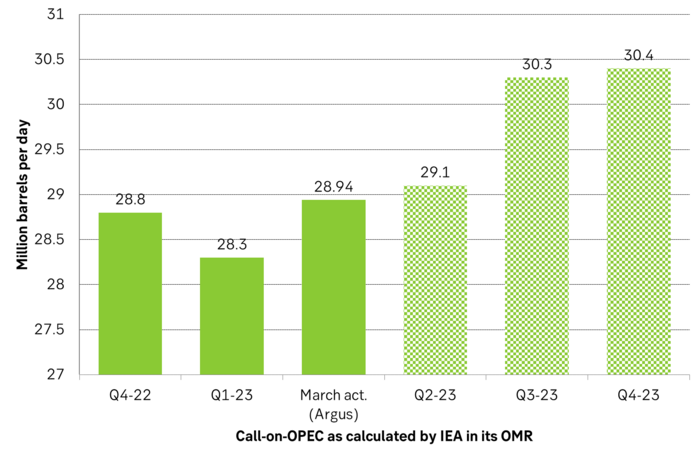
Total demand to rise 2 m b/d, 90% of demand growth from non-OECD and 57% from Jet fuel. Total demand to rise by 2 m b/d YoY to 101.9 m b/d where 90% of the gain is non-OECD. Jet fuel demand to account for 57% of demand growth as global aviation continues to normalize post Covid-19. Demand for 2022 revised down by 0.1 m b/d and as a result so was the 2023 outlook (to 101.9 m b/d). Non-OPEC supply for 2023 was revised up by 0.1 m b/d. Call-on-OPEC 2023 was reduced by 0.2 m b/d as a result to 29.5 m b/d. Call-on-OPEC was 28.8 m b/d in Q4-22. The group produced 28.94 m b/d in Mar (Argus).
World will need more oil from OPEC. Call-on-OPEC to rise 1.6 m b/d from Q4-22 to Q4-23. IEA is forecasting a call-on-OPEC in Q4-23 of 30.4 m b/d. The world will thus need 1.6 m b/d more oil from OPEC YoY in Q4-23 and 0.46 m b/d more than it produced in March. Counter to this though the OPEC group decided to cut production by 1 m b/d from May to the end of the year. So from May onward the group will produce around 28 m b/d while call-on-OPEC will be 29.1 m b/d, 30.3 m b/d and 30.4 m b/d in Q2,3,4-23.
If the IEA is right about demand then the coming OPEC cuts should drive inventories significantly lower and oil prices higher.
But the market doesn’t quite seem to buy into this outlook. If it had then prices would have moved higher. Prices bumped up to USD 87.49/b intraday on 12 April but have since fallen back and Brent is falling back half a percent today to USD 85.9/b.
Market is concerned for declining OECD manufacturing PMI’s. It is of course the darkening clouds on the macro-sky which is making investors concerned about the outlook for oil products demand and thus crude oil demand. Cross-currents in global oil product demand is making the situation difficult to assess. On the one hand there are significant weakening signals in global diesel demand along with falling manufacturing PMIs. The stuff which makes the industrial world go round. Manufacturing, trucking, mining and heavy duty vehicles all need diesel. (Great Blbrg story on diesel here.) Historically recessions implies a cyclical trough in manufacturing activity, softer diesel demand and falling oil prices. So oil investors are naturally cautious about buying into the bull-story based on OPEC cuts alone.
Cross-currents is making demand growth hard to assess. But the circumstances are much more confusing this time around than in normal recession cycles because: 1) Global Jet fuel demand is reviving/recovering post Covid-19 and along with China’s recent reopening. IEA’s assessment is that 57% of global demand growth this year will be from Jet fuel. And 2) Manufacturing PMIs in China and India are rising while OECD PMIs are falling.
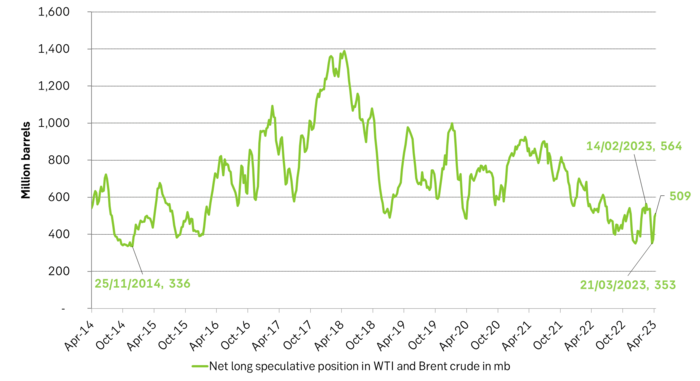
These cross-currents in the demand picture is what makes the current oil market so difficult to assess for everyone and why oil prices are not rallying directly to + USD 100/b. Investors are cautious. Though net-long specs have rallied 137 m b to 509 m b since the recent OPEC cuts were announced.
The world will need more oil from OPEC in 2023 but OPEC is cutting. The IEA is projecting that non-OPEC+ supply will grow by 1.9 m b/d YoY and OPEC+ will decline by 0.8 m b/d and in total that global supply will rise 1.2 m b/d in 2023. In comparison global demand will rise by 2.0 m b/d. At the outset this is a very bullish outlook but the global macro-backdrop could of course deteriorate further thus eroding the current projected demand growth of 2 m b/d. But OPEC can cut more if needed since latest cuts have only brought Saudi Arabia’s production down to its normal level.
OPEC has good reasons to cut production if it can. IEA expects global oil demand to rise 2 m b/d YoY in 2023 and that call-on-OPEC will lift 1.6 m b/d from Q4-22 to Q4-23. I.e. the world needs more oil from OPEC in 2023. But OPEC will likely produce closer to 28 m b/d from May to Dec following latest announced production cuts
Market has tightened with stronger backwardation and investors have increased their long positions
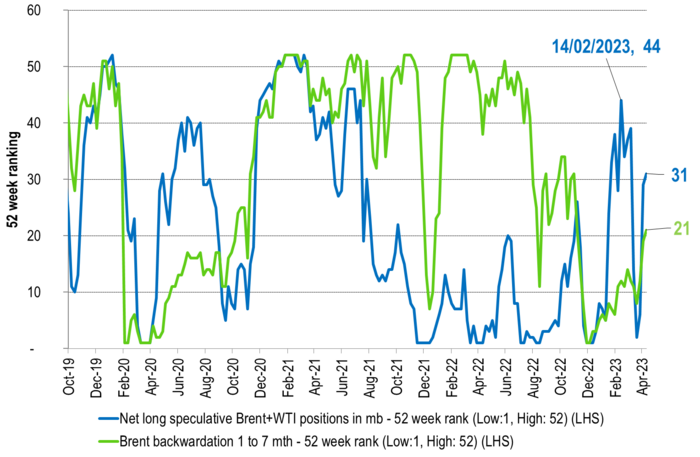
Net long specs in Brent + WTI has bounced since OPEC announcement on coming cuts.
Saudi Arabia’s fiscal cost-break-even was USD 85/b in 2021 projected the IMF earlier. Don’t know when it was projected, but looks like it was before 2020 and thus before the strong rise in inflation. If we add 15% US inflation to the 2021 number we get USD 97/b. Inflation should lift budget costs in Saudi Arabia as it is largely a USD based economy. Though Saudi Arabia’s inflation since Q4-19 is reported as 8% to data while Saudi cost-of-living-index is up by 11%. Good reason for Saudi Arabia to cut if it can cut without loosing market share to US shale.
Adjusting for inflation both on a backward and forward basis. The 5yr Brent price is today at USD 66.3/b but if we adjust for US 5yr inflation it is USD 58.6/b in real terms. That is basically equal to the average Brent spot price from 2015-2019 which was very bearish with booming shale and booming offshore non-OPEC. Market is basically currently pricing that Brent oil market in 5yrs time will be just as bearish as the ultra-bearish period from 2015-2019. It won’t take a lot to beat that when it comes to actual delivery in 2028.
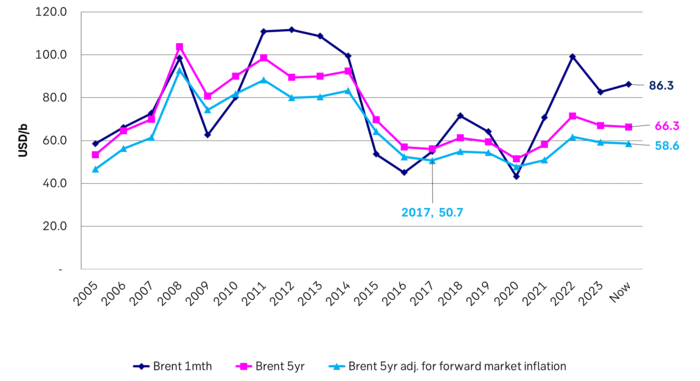
Nominal Brent oil prices and 5yr Brent adj. for 5yr forward inflation expectations only
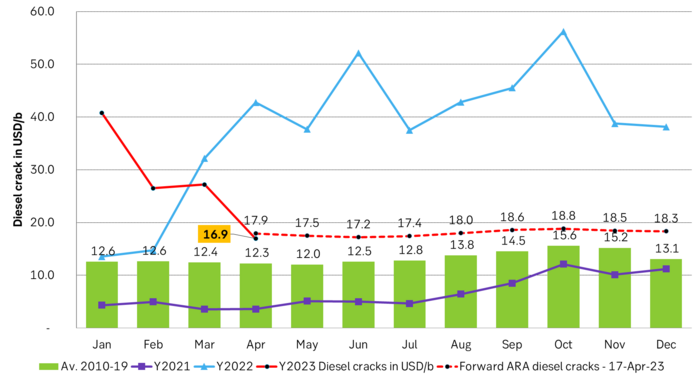
ARA Diesel cracks to Brent were exceptionally low in 2020/21 and exceptionally high in 2022. Now they are normalizing. Large additions to refining capacity through 2023 will increase competition in refining and reduce margins. Cuts by OPEC+ will at the same time make crude oil expensive. But diesel cracks are still significantly higher than normal. So more downside before back to normal is achieved.
Brent is climbing higher. Front-month is at USD 106.3/bl this morning, close to a weekly high and a USD 9/bl jump from Mondays open. This is the move we flagged as a risk earlier in the week: the market shifting from ”a deal is around the corner” to ”this is going to take longer than we thought”.

Analyst Commodities, SEB
During April, rest-of-year Brent remained remarkably stable around USD 90/bl. A stability which rested on one single assumption: the SoH reopens around 1 May. That assumption is now slowly falling apart.
As we highlighted yesterday: every week of delay beyond 1 May adds (theoretically) ish USD 5/bl to the rest-of-year average, as global inventories draw 100 million barrels per week. i.e., a mid-May reopening implies rest-of-year Brent closer to USD 100/bl, and anything pushing into June or July takes us meaningfully higher.
What’s changed in the last 48 hours:
#1: The US military has formally warned that clearing suspected sea mines from SoH could take up to six months. That is a completely different timescale from what the financial market is pricing. Even a political deal tomorrow does not immediately reopen the strait.
#2: Trump has shifted his tone from urgency to ”strategic patience”. In yesterday’s press conference: ”Don’t rush me… I want a great deal.” The market is reading this as a president no longer feeling pressured by timelines, with the naval blockade running in the background.
#3: So far, the military activity is escalating, not de-escalating. Axios reports Iran is laying more mines in SoH. The US 3rd carrier strike group (USS George H.W. Bush) is arriving with two countermine vessels. Trump yesterday ordered the US Navy to destroy any Iranian boats caught laying mines. While CNN reports that the Pentagon is actively drawing up plans to strike Iranian SoH capabilities and individual Iranian military leaders if the ceasefire collapses. i.e., NOT a attitude consistent with an imminent deal!
Spot crude and product prices eased off the early-April highs on a combination of system rerouting and deal optimism. Both now weakening. Goldman estimates April Gulf output is reduced by 14.5 mbl/d, or 57% of pre-war supply, a number that keeps getting worse the longer this drags on.
Demand-side adaptation is ongoing: S. Korea has cut its Middle East crude dependence from 69% to 56% by pulling more from the Americas and Africa, and Japan is kicking off a second round of SPR releases from 1 May. But SPRs are finite.
Ref. to the negotiations, we should not bet on speed. The current Iranian leadership is dominated by genuine hardliners willing to absorb economic pain and run the clock to extract concessions. That is not a setup for a rapid resolution. US/Israeli media briefings keep framing the delay as ”internal Iranian divisions”, the reality is more complicated and points toward weeks and months, not days.
Our point is that the complexity is large, and higher prices have only just started (given a scenario where the negotiations drag out in time). The market spent April leaning on the USD 90/bl rest-of-year assumption; that case is diminishing by the hour. If ”early May reopening” is replaced by ”June, July or later” over the next week or two, both crude and products have meaningful room to reprice higher from here. There is a high risk being short energy and betting on any immediate political resolution(!).
Down on Friday. Up on Monday. The Brent June crude oil contract traded down 5.1% last week to a close of $90.38/b. It reached a high of $103.87/b last Monday and a low of $86.09/b on Friday as Iran announced that the Strait of Hormuz was fully open for transit. That quickly changed over the weekend as the US upheld its blockade of Iranian oil exports while Iran naturally responded by closing the SoH again. The US blew a hole in the engine room of the Iranian ship TOUSKA and took custody of the ship on Sunday. Brent crude is up 5.6% this morning to $95.4/b.

The cease-fire is expiring tomorrow. The US has said it will send a delegation for a second round of negotiations in Islamabad in Pakistan. But Iran has for now rejected a second round of talks as it views US demands as unrealistic and excessive while the US is also blocking the Strait of Hormuz.
While Brent is up 5% this morning, the financial market is still very optimistic that progress will be made. That talks will continue and that the SoH will fully open by the start of May which is consistent with a rest-of-year average Brent crude oil price of around $90/b with the market now trading that balance at around $88/b.
Financial optimism vs. physical deterioration. We have a divergence where the financial market is trading negotiations, improvements and resolution while at the same time the physical market is deteriorating day by day. Physical oil flows remain constrained by disrupted flows, longer voyage times and elevated freight and insurance costs.
Financial markets are betting that a US/Iranian resolution will save us in time from violent shortages down the road. But every day that the SoH remains closed is bringing us closer to a potentially very painful point of shortages and much higher prices.
The US blockade is also a weapon of leverage against its European and Asian allies. When Iran closed the SoH it held the world economy as a hostage against the US. The US blockade of the SoH is of course blocking Iranian oil exports. But it is also an action of disruption directed towards Europe and Asia. The US has called for the rest of the world to engaged in the war with Iran: ”If you want oil from the Persian Gulf, then go and get it”. A risk is that the US plays brinkmanship with the global oil market directed towards its European and Asian allies and maybe even towards China to force them to engage and take part. Maybe unthinkable. But unthinkable has become the norm with Trump in the White House.
Wild moves yesterday. Brent crude traded to a high of $114.43/b and a low of $96.0/b and closed at $99.94/b yesterday.
US – Iran negotiations ongoing or not? What a day. Donald Trump announced that good talks were ongoing between Iran and the US and that the 48 hour deadline before bombing Iranian power plants and energy infrastructure was postponed by five days subject to success of ongoing meetings. Iranian media meanwhile stated that no meetings were ongoing at all.
Today we are scratching our heads trying to figure out what yesterday was all about.
Friends and family playing the market? Was it just Trump and his friends and family who were playing with oil and equity markets with $580m and $1.46bn in bets being placed by someone in oil and equity markets just 15 minutes before Trump’s announcement?
Was Trump pulling a TACO as he reached his political and economic pain point: Brent at $112/b, US Gas at $4/gal, SPX below 200dma and US 10yr above 4.4%?
Different Iranian factions with Trump talking with one of them? Are there real negotiations going on but with the US talking to one faction in Iran while another, the hardliners, are not involved and are denying any such negotiations going on?
Extending the ultimatum to attack and invade Kharg island next weekend? Or, is the five day delay of the deadline a tactical decision to allow US amphibious assault ships and marines to arrive in the Gulf in the upcoming weekend while US and Israeli continues to degrade Iranian military targets till then. And then next weekend a move by the US/Israel to attack and conquer for example the Kharg island?
We do not really know which it is or maybe a combination of these.
We did get some kind of TACO ydy. But markets have been waiting for some kind of TACO to happen and yesterday we got some kind of TACO. And Brent crude is now trading at $101.5/b as a result rather than at $112-114/b as it did no the high yesterday.
But what really matters in our view is the political situation on the ground in Iran. Will hardliners continue to hold power or will a more pragmatic faction gain power?
If the hardliners remain in power then oil pain should extend all the way to US midterm elections. The hardliners were apparently still in charge as of last week. Iran immediately retaliated and damaged LNG infrastructure in Qatar after Israel hit Iranian South Pars. The SoH was still closed and all messages coming out of Iran indicated defiance. Hardliners continues in power has a huge consequence for oil prices going forward. The regime has played its ’oil-weapon’ (closing or chocking the Strait of Hormuz). It is using it to achieve political goals. Deterrence: it needs to be so politically and economically expensive to attack Iran that it won’t happen again in the future. Or at least that the US/Israel thinks 10-times over before they attack again. The highest Brent crude oil closing price since the start of the war is $112.19/b last Friday. In comparison the 20-year inflation adjusted Brent price is $103/b. So Brent crude last Friday at $112.19/b isn’t a shockingly high price. And it is still far below the nominal high of $148/b from 2008 which is $220/b if inflation adjusted. So once in a lifetime Iran activates its most powerful weapon. The oil weapon. It needs to show the power of this weapon and it needs to reap political gains. Getting Brent to $112/b and intraday high of $119.5/b (9 March) isn’t a display of the power of that weapon. And it is not a deterrence against future attacks.
So if the hardliners remain in power in Iran, then the SoH will likely remain chocked all the way to US midterm elections and Brent crude will at a minimum go above the historical nominal high of $148/b from 2008.
Thus the outlook for the oil price for the rest of the year doesn’t depend all that much of whether Trump pulls a TACO or not. Stops bombing or not. It depends more on who is in charge in Iran. If it is the hardliners, then deterrence against future attacks via chocking of the SoH and high oil prices is the likely line of action. It is impacting the world but the Iranian ’oil-weapon’ is directed towards the US president and the the US midterm elections.
If a pragmatic faction gets to power in Iran, then a very prosperous future is possible. However, if power is shifting towards a more pragmatic faction in Iran then a completely different direction could evolve. Such a faction could possibly be open for cooperation with the US and the GCC and possibly put its issues versus Israel aside. Then the prosperity we have seen evolving in Dubai could be a possible future also for Iran.
So far it looks like the hardliners are fully in charge. As far as we can see, the hardliners are still fully in control in Iran. That points towards continued chocking of the SoH and oil prices ticking higher as global inventories (the oil market buffers) are drawn lower. And not just for a few more weeks, but possibly all the way to the US midterm elections.


Brent crude up USD 9/bl on the week… ”deal around the corner” narrative fades
Market Still Betting on Timely Resolution, But Each Day Raises Shortage Risk

Christian Kopfer om läget för oljan

Marknaden måste börja betrakta de höga kopparpriserna som det nya normala

Det fysiska spotpriset på brentolja har slagit nytt rekord

40 minuter med Javier Blas om hur världen verkligen påverkas av energikrisen

Elpriserna fördubblas, stor osäkerhet inför sommaren
Det fysiska spotpriset på brentolja har slagit nytt rekord
Marknaden måste börja betrakta de höga kopparpriserna som det nya normala
Christian Kopfer om läget för oljan
-
 Nyheter3 veckor sedan
40 minuter med Javier Blas om hur världen verkligen påverkas av energikrisen
-
 Nyheter4 veckor sedan
Elpriserna fördubblas, stor osäkerhet inför sommaren
-
 Nyheter3 veckor sedan
Det fysiska spotpriset på brentolja har slagit nytt rekord
-
 Nyheter2 veckor sedan
Marknaden måste börja betrakta de höga kopparpriserna som det nya normala
-
 Nyheter2 veckor sedan
Christian Kopfer om läget för oljan
-

 Nyheter3 veckor sedan
Efter tillväxten: Guldbrev satsar på expansion i Europa
-
Analys4 dagar sedan
Market Still Betting on Timely Resolution, But Each Day Raises Shortage Risk
-
Analys8 timmar sedan
Brent crude up USD 9/bl on the week… ”deal around the corner” narrative fades