

Analys
Mixed signals on demand but world will need more oil from OPEC but the group is cutting

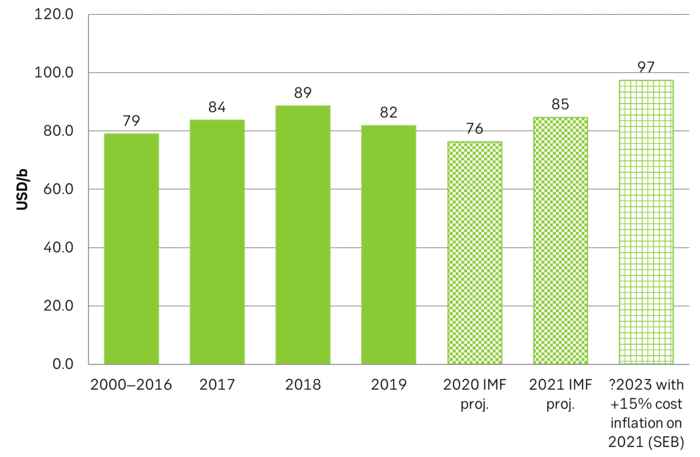
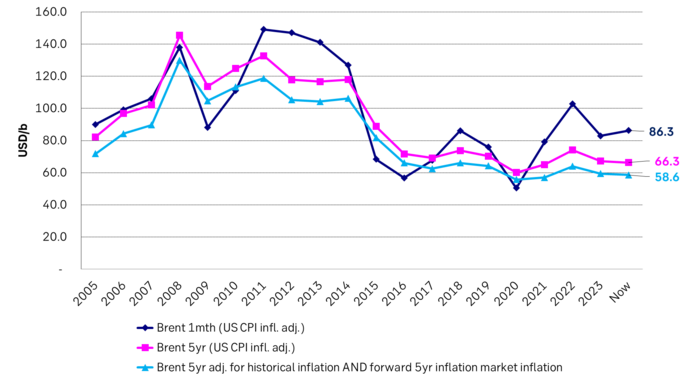
A world where OPEC(+) is in charge is a very different world than we are used to during the ultra-bearish 2015-19 period where US shale AND offshore non-OPEC production both were booming. Brent averaged USD 58/b nominal and USD 70/b in real terms that period. The Brent 5yr contract is trading at USD 66/b nominal or USD 58.6/b in real-terms assuming no market power to OPEC+ in 2028. Could be, but we don’t think so as US Permian shale is projected by major players to peak next 5yrs. When OPEC(+) is in charge the group will cut according to needs. For Saudi that is around USD 85/b but maybe as high as USD 97/b if budget costs rise with inflation

No major revisions to outlook by the IEA last week in its monthly Oil Market Report.
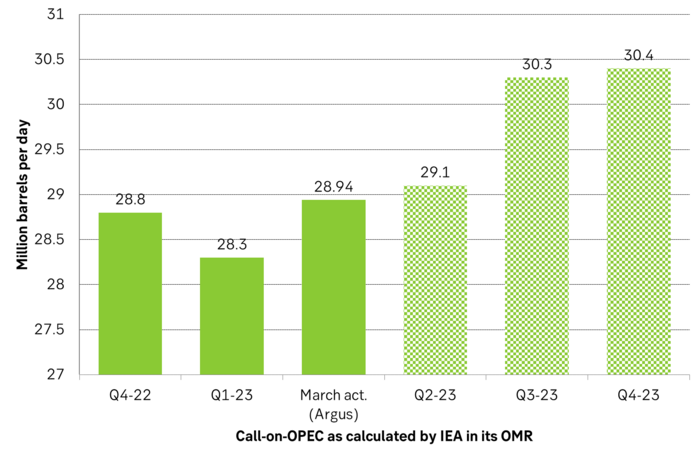
Total demand to rise 2 m b/d, 90% of demand growth from non-OECD and 57% from Jet fuel. Total demand to rise by 2 m b/d YoY to 101.9 m b/d where 90% of the gain is non-OECD. Jet fuel demand to account for 57% of demand growth as global aviation continues to normalize post Covid-19. Demand for 2022 revised down by 0.1 m b/d and as a result so was the 2023 outlook (to 101.9 m b/d). Non-OPEC supply for 2023 was revised up by 0.1 m b/d. Call-on-OPEC 2023 was reduced by 0.2 m b/d as a result to 29.5 m b/d. Call-on-OPEC was 28.8 m b/d in Q4-22. The group produced 28.94 m b/d in Mar (Argus).
World will need more oil from OPEC. Call-on-OPEC to rise 1.6 m b/d from Q4-22 to Q4-23. IEA is forecasting a call-on-OPEC in Q4-23 of 30.4 m b/d. The world will thus need 1.6 m b/d more oil from OPEC YoY in Q4-23 and 0.46 m b/d more than it produced in March. Counter to this though the OPEC group decided to cut production by 1 m b/d from May to the end of the year. So from May onward the group will produce around 28 m b/d while call-on-OPEC will be 29.1 m b/d, 30.3 m b/d and 30.4 m b/d in Q2,3,4-23.
If the IEA is right about demand then the coming OPEC cuts should drive inventories significantly lower and oil prices higher.
But the market doesn’t quite seem to buy into this outlook. If it had then prices would have moved higher. Prices bumped up to USD 87.49/b intraday on 12 April but have since fallen back and Brent is falling back half a percent today to USD 85.9/b.
Market is concerned for declining OECD manufacturing PMI’s. It is of course the darkening clouds on the macro-sky which is making investors concerned about the outlook for oil products demand and thus crude oil demand. Cross-currents in global oil product demand is making the situation difficult to assess. On the one hand there are significant weakening signals in global diesel demand along with falling manufacturing PMIs. The stuff which makes the industrial world go round. Manufacturing, trucking, mining and heavy duty vehicles all need diesel. (Great Blbrg story on diesel here.) Historically recessions implies a cyclical trough in manufacturing activity, softer diesel demand and falling oil prices. So oil investors are naturally cautious about buying into the bull-story based on OPEC cuts alone.
Cross-currents is making demand growth hard to assess. But the circumstances are much more confusing this time around than in normal recession cycles because: 1) Global Jet fuel demand is reviving/recovering post Covid-19 and along with China’s recent reopening. IEA’s assessment is that 57% of global demand growth this year will be from Jet fuel. And 2) Manufacturing PMIs in China and India are rising while OECD PMIs are falling.
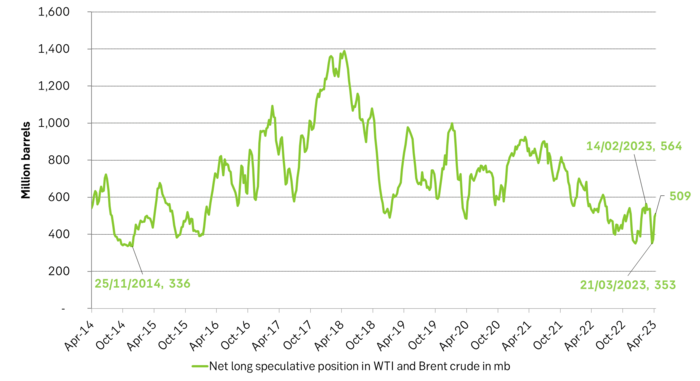
These cross-currents in the demand picture is what makes the current oil market so difficult to assess for everyone and why oil prices are not rallying directly to + USD 100/b. Investors are cautious. Though net-long specs have rallied 137 m b to 509 m b since the recent OPEC cuts were announced.
The world will need more oil from OPEC in 2023 but OPEC is cutting. The IEA is projecting that non-OPEC+ supply will grow by 1.9 m b/d YoY and OPEC+ will decline by 0.8 m b/d and in total that global supply will rise 1.2 m b/d in 2023. In comparison global demand will rise by 2.0 m b/d. At the outset this is a very bullish outlook but the global macro-backdrop could of course deteriorate further thus eroding the current projected demand growth of 2 m b/d. But OPEC can cut more if needed since latest cuts have only brought Saudi Arabia’s production down to its normal level.
OPEC has good reasons to cut production if it can. IEA expects global oil demand to rise 2 m b/d YoY in 2023 and that call-on-OPEC will lift 1.6 m b/d from Q4-22 to Q4-23. I.e. the world needs more oil from OPEC in 2023. But OPEC will likely produce closer to 28 m b/d from May to Dec following latest announced production cuts
Market has tightened with stronger backwardation and investors have increased their long positions
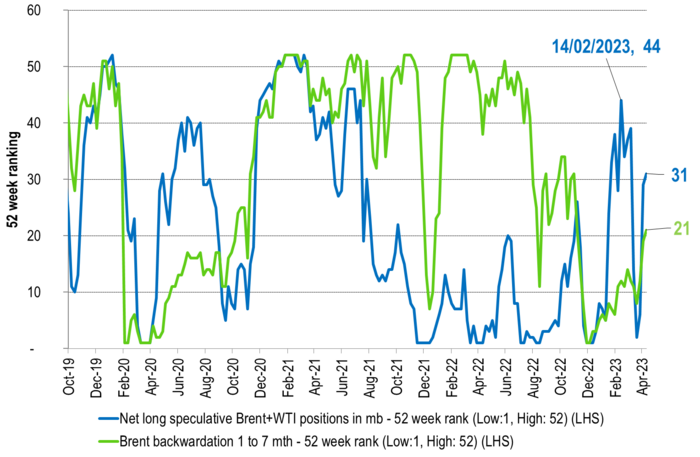
Net long specs in Brent + WTI has bounced since OPEC announcement on coming cuts.
Saudi Arabia’s fiscal cost-break-even was USD 85/b in 2021 projected the IMF earlier. Don’t know when it was projected, but looks like it was before 2020 and thus before the strong rise in inflation. If we add 15% US inflation to the 2021 number we get USD 97/b. Inflation should lift budget costs in Saudi Arabia as it is largely a USD based economy. Though Saudi Arabia’s inflation since Q4-19 is reported as 8% to data while Saudi cost-of-living-index is up by 11%. Good reason for Saudi Arabia to cut if it can cut without loosing market share to US shale.
Adjusting for inflation both on a backward and forward basis. The 5yr Brent price is today at USD 66.3/b but if we adjust for US 5yr inflation it is USD 58.6/b in real terms. That is basically equal to the average Brent spot price from 2015-2019 which was very bearish with booming shale and booming offshore non-OPEC. Market is basically currently pricing that Brent oil market in 5yrs time will be just as bearish as the ultra-bearish period from 2015-2019. It won’t take a lot to beat that when it comes to actual delivery in 2028.
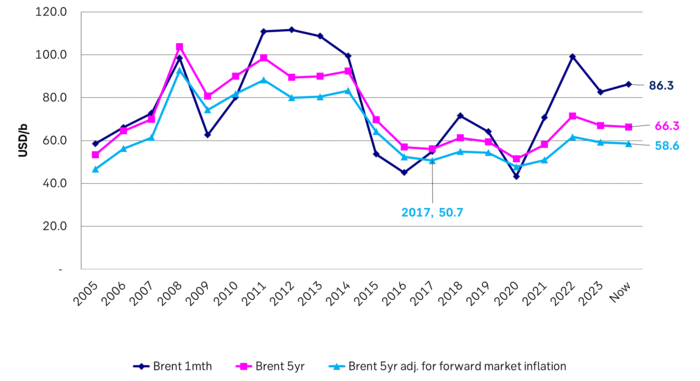
Nominal Brent oil prices and 5yr Brent adj. for 5yr forward inflation expectations only
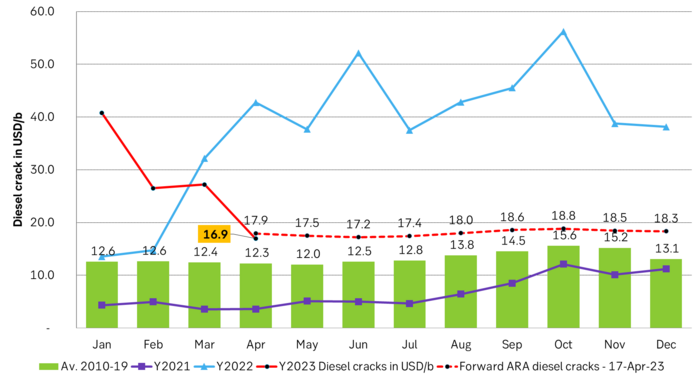
ARA Diesel cracks to Brent were exceptionally low in 2020/21 and exceptionally high in 2022. Now they are normalizing. Large additions to refining capacity through 2023 will increase competition in refining and reduce margins. Cuts by OPEC+ will at the same time make crude oil expensive. But diesel cracks are still significantly higher than normal. So more downside before back to normal is achieved.
Hesitant today. Brent jumped to an intraday high of $66.36/b yesterday after having touched an intraday low of $60.07/b on Monday as Indian and Chinese buyers cancelled some Russian oil purchases and instead redirected their purchases towards the Middle East due to the news US sanctions. Brent is falling back 0.4% this morning to $65.8/b.

It’s our strong view that the only sensible thing is to sell this rally. In all Trump’s unpredictability he has become increasingly predictable. Again and again he has rumbled about how he is going to be tough on Putin. Punish Putin if he won’t agree to peace in Ukraine. Recent rumbling was about the Tomahawk rockets which Trump threatened on 10 October and 12 October to sell/send to Ukraine. Then on 17 October he said that ”the U.S. didn’t want to give away weapons (Tomahawks) it needs”.
All of Trump’s threats towards Putin have been hot air. So far Trump’s threats have been all hot air and threats which later have evaporated after ”great talks with Putin”. After all these repetitions it is very hard to believe that this time will be any different. The new sanctions won’t take effect before 21. November. Trump has already said that: ”he was hoping that these new sanctions would be very short-lived in any case”. Come 21. November these new sanctions will either evaporate like all the other threats Trump has thrown at Putin before fading them. Or the sanctions will be postponed by another 4 weeks or 8 weeks with the appearance that Trump is even more angry with Putin. But so far Trump has done nothing that hurt Putin/Russia. We can’t imagine that this will be different. The only way forward in our view for a propre lasting peace in Ukraine is to turn Ukraine into defensive porcupine equipped with a stinging tail if need be.
China will likely stand up to Trump if new sanctions really materialize on 21 Nov. Just one country has really stood up to Trump in his tariff trade war this year: China. China has come of age and strength. I will no longer be bullied. Trump upped tariffs. China responded in kind. Trump cut China off from high-end computer chips. China put on the breaks on rare earth metals. China won’t be bullied any more and it has the power to stand up. Some Chinese state-owned companies like Sinopec have cancelled some of their Russian purchases. But China’s Foreign Ministry spokesperson Guo Jiakun has stated that China “oppose unilateral sanctions which lack a basis in international law and authorization of the UN Security Council”. Thus no one, not even the US shall unilaterally dictate China from whom they can buy oil or not. This is yet another opportunity for China to show its new strength and stand up to Trump in a show of force. Exactly how China choses to play this remains to be seen. But China won’t be bullied by over something as important as its oil purchases. So best guess here is that China will defy Trump on this. But probably China won’t need to make a bid deal over this. Firstly because these new sanctions will either evaporate as all the other threats or be postponed once we get to 21 November. Secondly because the sanctions are explicit towards US persons and companies but only ”may” be enforced versus non-US entities.
Sanctions is not a reduction in global supply of oil. Just some added layer of friction. Anyhow, the new sanctions won’t reduce the supply of Russian crude oil to the market. It will only increase the friction in the market with yet more need for the shadow fleet and ship to ship transfer of Russian oil to dodge the sanctions. If they materialize at all.
The jump in crude oil prices is probably due to redirections of crude purchases to the Mid-East and not because all speculators are now turned bullish. Has oil rallied because all speculators now suddenly have turned bullish? We don’t think so. Brent crude has probably jumped because some Indian and Chinese oil purchasers of have redirected their purchases from Russia towards the Mid-East just in case the sanctions really materializes on 21 November.
Parts of the Brent crude curve dipping into the high $50ies/b. Brent crude fell 2.3% over the week to Friday. It closed the week at $61.29/b, a slight gain on the day, but also traded to a low of $60.14/b that same day and just barely avoided trading into the $50ies/b. This morning it is risk-on in equities which seems to help industrial metals a little higher. But no such luck for oil. It is down 0.8% at $60.8/b. This week looks set for Brent crude to dip its feet in the $50ies/b. The Brent 3mth contract actually traded into the high $50ies/b on Friday.
The front-end backwardation has been on a weakening foot and is now about to fully disappear. The lowest point of the crude oil curve has also moved steadily lower and lower and its discount to the 5yr contract is now $6.8/b. A solid contango. The Brent 3mth contract did actually dip into the $50ies/b intraday on Friday when it traded to a low point of $59.93/b.
More weakness to come as lots of oil at sea comes to ports. Mid-East OPEC countries have boosted exports along with lower post summer consumption and higher production. The result is highly visibly in oil at sea which increased by 17 mb to 1,311 mb over the week to Sunday. Up 185 mb since mid-August. On its way to discharge at a port somewhere over the coming month or two.
Don’t forget that the oil market path ahead is all down to OPEC+. Remember that what is playing out in the oil market now is all by design by OPEC+. The group has decided that the unwind of the voluntary cuts is what it wants to do. In a combination of meeting demand from consumers as well as taking back market share. But we need to remember that how this plays out going forward is all at the mercy of what OPEC+ decides to do. It will halt the unwinding at some point. It will revert to cuts instead of unwind at some point.
A few months with Brent at $55/b and 40-50 US shale oil rigs kicked out may be what is needed. We think OPEC+ needs to see the exit of another 40-50 drilling rigs in the US shale oil patches to set US shale oil production on a path to of a 1 mb/d year on year decline Dec-25 to Dec-26. We are not there yet. But a 2-3 months period with Brent crude averaging $55/b would probably do it.
Oil on water increased 17 mb over the week to Sunday while oil in transit increased by 23 mb. So less oil was standing still. More was moving.

Crude oil floating storage (stationary more than 7 days). Down 11 mb over week to Sunday

The lowest point of the Brent crude oil curve versus the 5yr contract. Weakest so far this year.

Crude oil 1mth to 3mth time-spreads. Dubai held out strongly through summer, but then that center of strength fell apart in late September and has been leading weakness in crude curves lower since then.

Rebounding along with most markets. But concerns over solidity of Gaza peace may also contribute. Brent crude fell 0.8% yesterday to $61.91/b and its lowest close since May this year. This morning it is bouncing up 0.9% to $62.5/b along with a softer USD amid positive sentiment with both equities and industrial metals moving higher. Concerns that the peace in Gaza may be less solid than what one might hope for also yields some support to Brent. Bets on tech stocks are rebounding, defying fears of trade war. Money moving back into markets. Gold continues upwards its strong trend and a softer dollar helps it higher today as well.
US crude & products probably rose 5.6 mb last week (API) versus a normal seasonal decline of 2.4 mb. The US API last night partial and thus indicative data for US oil inventories. Their data indicates that US crude stocks rose 7.4 mb last week, gasoline stocks rose 3.0 mb while Distillate stocks fell 4.8 mb. Altogether an increase in commercial crude and product stocks of 5.6 mb. Commercial US crude and product stocks normally decline by 2.4 mb this time of year. So seasonally adjusted the US inventories rose 8 mb last week according to the indicative numbers by the API. That is a lot. Also, the counter seasonal trend of rising stocks versus normally declining stocks this time of year looks on a solid pace of continuation. If the API is correct then total US crude and product stocks would stand 41 mb higher than one year ago and 6 mb higher than the 2015-19 average. And if we combine this with our knowledge of a sharp increase in production and exports by OPEC(+) and a large increase in oil at sea, then the current trend in US oil inventories looks set to continue. So higher stocks and lower crude oil prices until OPEC(+) switch to cuts. Actual US oil inventory data today at 18:00 CET.
US commercial crude and product stocks rising to 1293 mb in week 41 if last nights indicative numbers from API are correct.

Crude oil soon coming to a port near you. OPEC has lifted production sharply higher this autumn. At the same time demand for oil in the Middle-East has fallen as we have moved out of summer heat and crude oil burn for power for air-conditioning. The Middle-East oil producers have thus been able to lift exports higher on both accounts. Crude oil and condensates on water has shot up by 177 mb since mid-August. This oil is now on its way to ports around the world. And when they arrive, it will likely help to lift stocks onshore higher. That is probably when we will lose the last bit of front-end backwardation the the crude oil curves. That will help to drive the front-month Brent crude oil price down to the $60/b line and revisit the high $50ies/b. Then the eyes will be all back on OPEC+ when they meet in early November and then again in early December.
Crude oil and condensates at sea have moved straight up by 177 mb since mid-August as OPEC(+) has produced more, consumed less and exported more.


Sell the rally. Trump has become predictable in his unpredictability

Gruvbolaget Boliden överträffade analytikernas förväntningar

Australien och USA investerar 8,5 miljarder USD för försörjningskedja av kritiska mineraler
Brent crude set to dip its feet into the high $50ies/b this week

Vad guldets uppgång egentligen betyder för världen

Goldman Sachs höjer prognosen för guld, tror priset når 4900 USD

Blykalla och amerikanska Oklo inleder ett samarbete

Guld nära 4000 USD och silver 50 USD, därför kan de fortsätta stiga

Leading Edge Materials är på rätt plats i rätt tid

Nytt prisrekord, guld stiger över 4000 USD
-
 Nyheter3 veckor sedan
Goldman Sachs höjer prognosen för guld, tror priset når 4900 USD
-
 Nyheter4 veckor sedan
Blykalla och amerikanska Oklo inleder ett samarbete
-
 Nyheter3 veckor sedan
Guld nära 4000 USD och silver 50 USD, därför kan de fortsätta stiga
-
 Nyheter2 veckor sedan
Leading Edge Materials är på rätt plats i rätt tid
-
 Nyheter3 veckor sedan
Nytt prisrekord, guld stiger över 4000 USD
-

 Nyheter4 veckor sedan
Ett samtal om guld, olja, koppar och stål
-
Analys4 veckor sedan
OPEC+ will likely unwind 500 kb/d of voluntary quotas in October. But a full unwind of 1.5 mb/d in one go could be in the cards
-

 Nyheter4 veckor sedan
Neptune Energy bekräftar enorma litiumfyndigheter i Tyskland