

Analys
Iranian nuclear negotiations at center stage


Brent crude is trading like it is April with snow one day and sunshine the next. We currently have spring refinery maintenance with reduced processing of crude by refineries and rising crude stocks. The strength of the crude curve is weakening, floating crude stocks are rising, speculative positions in crude are taking some exit and Brent crude prices have been ticking lower. Gasoline refinery margins are however extremely strong and oil product demand is set to revive yet more in the months to come. Over the market however hangs a dark shadow of Iran nuclear negotiations in Vienna which if successful would add more crude to the market.

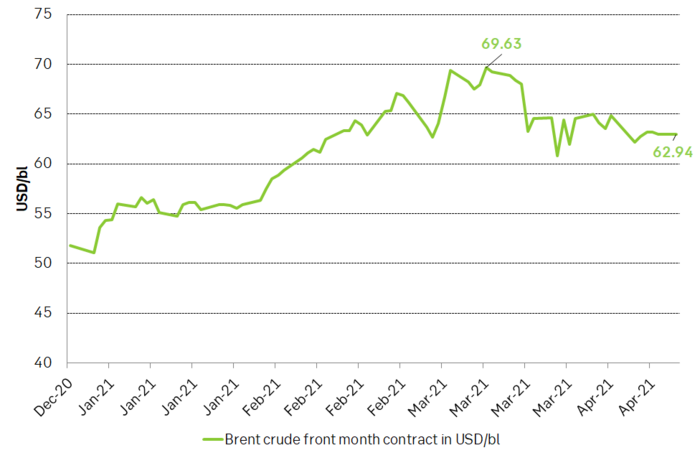
Brent crude traded down 2.9% last week with a close of USD 62.95/bl and is trading down another 0.5% this morning to USD 62.6/bl. Since 19 March Brent crude has averaged USD 63.4/bl. While currently not far from this average but in general it is clear that prices have been ticking lower since late March and still are.
Center stage in the oil market these days is the ongoing negotiations in Vienna where world powers are trying to revive the Iranian Nuclear deal (JCPOA) which Biden helped to create when he was Vice President under Obama. There is a lot of noise around the ongoing negotiations with a lot of crossing interests. Israel and Saudi Arabia probably both want Iran to be in constant lock-down rather than to revive. And the Iranian Revolutionary Gard might also want to see a continued status quo rather than a normalization and a reopening of the country as this might threaten its current grip on power. But fundamentally all parties in the negotiations in Vienna wants to see the JCPOA deal revived and reinstated. Thus, fundamentally the outcome should be successful in the end. When is of course a large open question with most observers predict a lengthy and difficult process with revival of Iranian production in late 2021 or into 2022. President Rouhani of Iran is however set to end his presidency in June this year with expectations that Iran’ hard-liners will take over which would make it more difficult to succeed. Thus, the window of opportunity might be quite narrow. And President Biden seems to want to undo all of Donald Trump’s deeds as quickly as possible. So sooner rather than later could be the outcome of the Vienna negotiations. But sitting far from Vienna this is hard to tell. But what is clear is that the ongoing Iranian nuclear negotiations in Vienna is posing a bearish risk for oil.
On the physical part of the crude oil market it is obvious that there is currently not a continued strong draw-down in crude stocks as we have seen previously, and which has underpinned the previously increasing Brent crude oil backwardation.
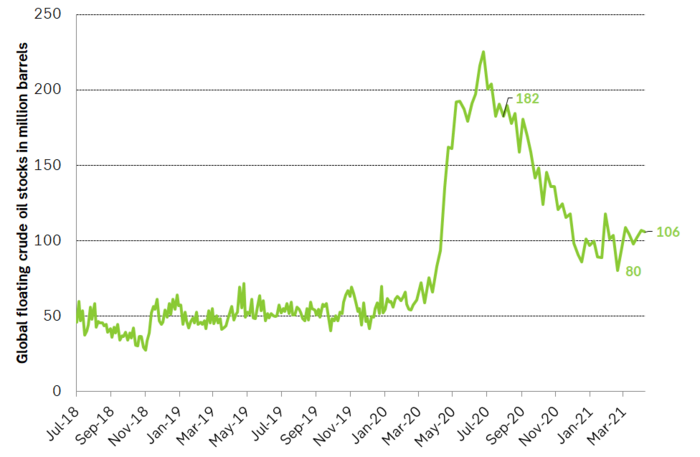
Refineries are currently in spring maintenance; Chinese crude stocks are reportedly very high and April/May refinery maintenance there is unusually strong this year as well. OPEC ME Gulf loadings rose 1.6 m bl/d month on month in March and OPEC+ production is set to rise further in May, June and July. Floating crude oil stocks have as a result of all this been ticking higher from a low of 80 m bl in February to now 106 m bl versus a normal of 50-60 m bl.
Parts of the weakness right now is clearly the refinery turnaround season in combination with further production increases lined up by OPEC+ in the months ahead (600, 700, 841 k bl/d for May, June, July).
But all is not grim, and the current crude oil weakness is clearly exacerbated by the ongoing refinery maintenance season.
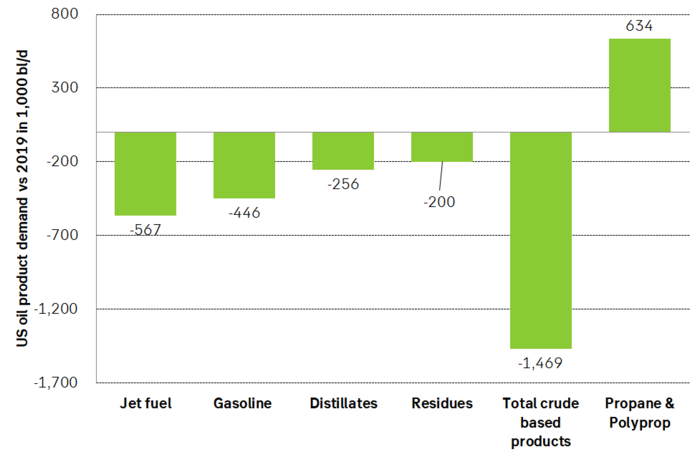
If we instead look at the oil products, we see that US crude based products are only 1.5 m bl/d below the 2019 level. And US oil demand is set to revive more. Gasoline is being shipped from east of Suez to West Africa at the highest rate since 2016 and diesel is being shipped from Europe to the US in an unusual reverse flow.
So amid all the noise of Iran JCPOA negotiations, crude oil weakness, refinery maintenance it is easy to forget the broad, underlying fundamental here that vaccines are increasingly rolled out and product demand is on its way back in the US and a little later in the EU.
Brent crude oil prices have fallen back. Ticking lower since the recent fall from USD 69.63/bl. From recent high-close to to recent low-closes we have still spanned less than USD 10/bl. Normal pull-backs during price recoveries are typically USD 10-12/bl. Thus the pull-back is still not all that big.
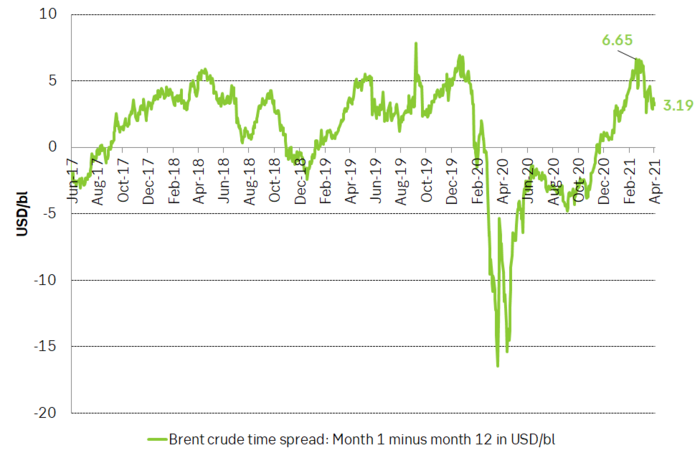
Backwardation of the Brent crude oil curve has consistently softened since late February when the front month contract traded at a premium of USD 6.6/bl vs the 12 months contract. It now trades at only USD 3.1/bl. In comparison this backwardation averaged USD 2.9/bl through 2018 and 2019. Thus, current backwardation is very normal though it is clearly on a weakening trend right now.
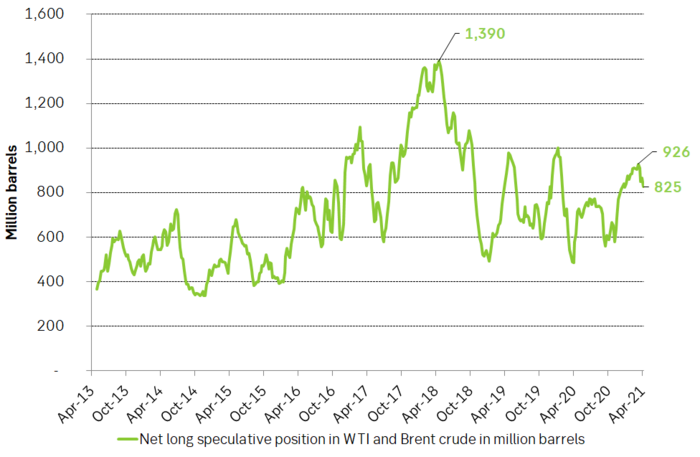
Net long speculative positions in Brent and WTI has declined about 100 m bl from 926 m bl in early March to now 825 m bl. In comparison the average position in 2019 was 733 m bl. Speculative positions are thus still some 100 m bl above this level and could draw down to below 600 m bl if speculators take more exits.
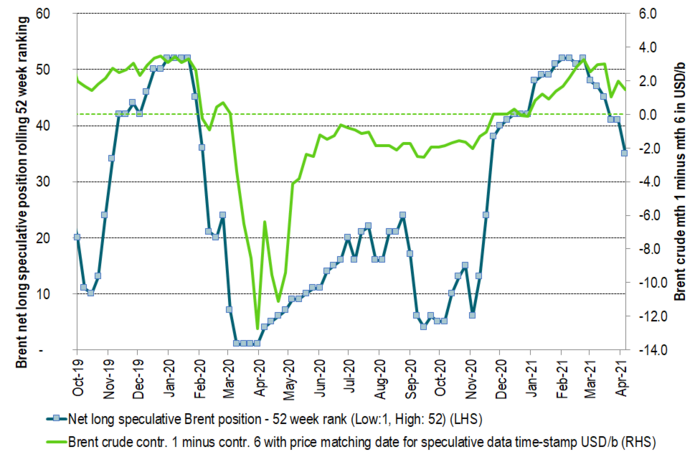
The time-spread of the Brent crude oil curve given as month 1 minus month 6 versus the ranking of net long speculative positions in Brent crude. The backwardation/contango of the Brent crude oil curve is not solely a reflection of the physical market. It is also a reflection of ebbs and flows of speculative positions. As these moves in and out of the front-end of the front-end contracts of the crude curve they typically drag front-end prices higher or lower versus longer dated contracts. Further speculative exits would weaken the Brent crude backwardation yet more (flatten the curve) with the front-end contract then moving closer to longer dated prices.
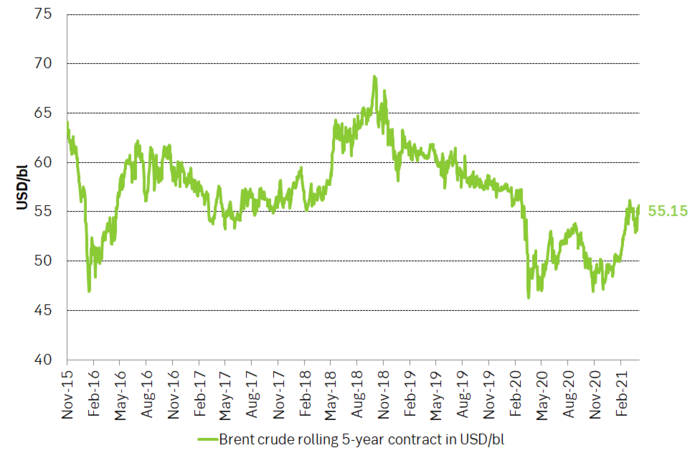
The 5-year Brent contract now trades at USD 55/bl which is just USD 3.5/bl below the average of the 5-year contract from Jan 2016 to Dec 2019 of USD 58.5/bl. Thus, longer dated Brent crude oil contracts are now very close to “normal” so to speak. In a total flattening of the Brent crude oil curve if crude stocks build more and speculative positions takes yet more exit the Brent crude prices would naturally decline to USD 55/bl where the longer dated contracts are located right now. Though this is not our main scenario it paints a picture of where Brent crude would naturally head if further bearishness unfolds. And in terms of price-pullbacks we have still not spanned a full USD 10/bl since the recent high close of USD 69.63/bl on 11 March. Pull-backs of USD 10-12/bl are normal during price recoveries.
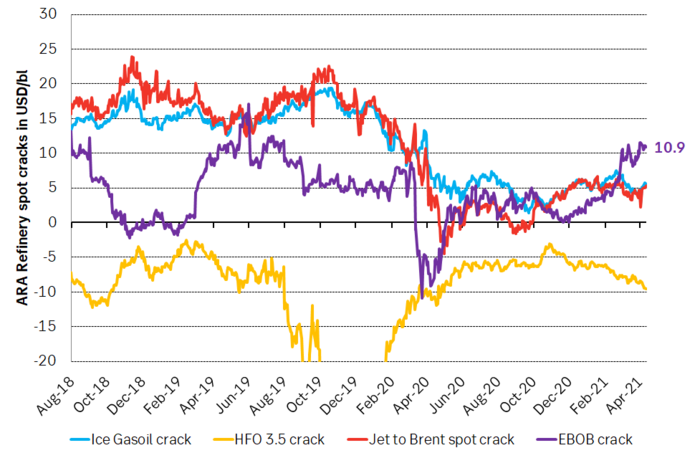
If we however look at oil products we see that gasoline refining margins are now USD 11/bl in Europe versus a more normal USD 5-6/bl. I.e. they are very strong. And with more to come. This reflects strengthening gasoline demand together with strong naphtha (for plastics) demand where both products are at the lighter end of the barrel. Diesel and middle distillate cracks are still weak versus normal as demand for jet fuel is still subdued. Fuel oil 3.5 cracks are weakening and reports are that floating stocks of 3.5% is building off the coast of Iraq as it struggles to process this part of the barrel. Increasing exports of medium sour crude from OPEC+ is also weakening this part of the complex while production of light sweet crude from the US is overall still ticking lower.
US oil product demand is now only 1.5 m bl/d below its 2019 level if we only count crude oil based products. And more demand is set to come back by the day as the US economy opens up over the coming 2 months. If we include propane and polypropylene then US product demand is already very close to normal.
Global, floating crude stocks have ticked higher from a low of 80 m barrels and now at 106 m barrels. Current refinery maintenance is part of this. The trend and the goal of OPEC+ was to move down to 50-60 million barrels (normal). But not yet.
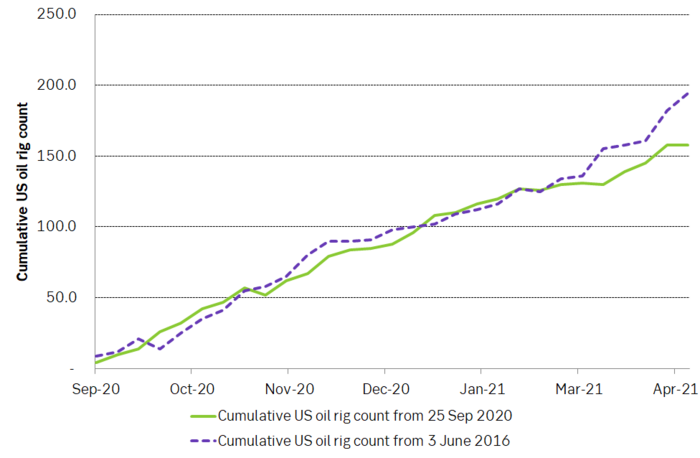
US oil rig count did not rise last week and there is now an emerging difference between the activation of drilling rigs from June 2016 versus the one that started in September 2020. Will shale oil producers actually be true to their words that this time will be different and that they won’t spend all income on drilling and instead be prudent? This emerging picture is lending support to longer dated contracts for 2022/23/24
Source: SEB, Bloomberg
Hesitant today. Brent jumped to an intraday high of $66.36/b yesterday after having touched an intraday low of $60.07/b on Monday as Indian and Chinese buyers cancelled some Russian oil purchases and instead redirected their purchases towards the Middle East due to the news US sanctions. Brent is falling back 0.4% this morning to $65.8/b.

It’s our strong view that the only sensible thing is to sell this rally. In all Trump’s unpredictability he has become increasingly predictable. Again and again he has rumbled about how he is going to be tough on Putin. Punish Putin if he won’t agree to peace in Ukraine. Recent rumbling was about the Tomahawk rockets which Trump threatened on 10 October and 12 October to sell/send to Ukraine. Then on 17 October he said that ”the U.S. didn’t want to give away weapons (Tomahawks) it needs”.
All of Trump’s threats towards Putin have been hot air. So far Trump’s threats have been all hot air and threats which later have evaporated after ”great talks with Putin”. After all these repetitions it is very hard to believe that this time will be any different. The new sanctions won’t take effect before 21. November. Trump has already said that: ”he was hoping that these new sanctions would be very short-lived in any case”. Come 21. November these new sanctions will either evaporate like all the other threats Trump has thrown at Putin before fading them. Or the sanctions will be postponed by another 4 weeks or 8 weeks with the appearance that Trump is even more angry with Putin. But so far Trump has done nothing that hurt Putin/Russia. We can’t imagine that this will be different. The only way forward in our view for a propre lasting peace in Ukraine is to turn Ukraine into defensive porcupine equipped with a stinging tail if need be.
China will likely stand up to Trump if new sanctions really materialize on 21 Nov. Just one country has really stood up to Trump in his tariff trade war this year: China. China has come of age and strength. I will no longer be bullied. Trump upped tariffs. China responded in kind. Trump cut China off from high-end computer chips. China put on the breaks on rare earth metals. China won’t be bullied any more and it has the power to stand up. Some Chinese state-owned companies like Sinopec have cancelled some of their Russian purchases. But China’s Foreign Ministry spokesperson Guo Jiakun has stated that China “oppose unilateral sanctions which lack a basis in international law and authorization of the UN Security Council”. Thus no one, not even the US shall unilaterally dictate China from whom they can buy oil or not. This is yet another opportunity for China to show its new strength and stand up to Trump in a show of force. Exactly how China choses to play this remains to be seen. But China won’t be bullied by over something as important as its oil purchases. So best guess here is that China will defy Trump on this. But probably China won’t need to make a bid deal over this. Firstly because these new sanctions will either evaporate as all the other threats or be postponed once we get to 21 November. Secondly because the sanctions are explicit towards US persons and companies but only ”may” be enforced versus non-US entities.
Sanctions is not a reduction in global supply of oil. Just some added layer of friction. Anyhow, the new sanctions won’t reduce the supply of Russian crude oil to the market. It will only increase the friction in the market with yet more need for the shadow fleet and ship to ship transfer of Russian oil to dodge the sanctions. If they materialize at all.
The jump in crude oil prices is probably due to redirections of crude purchases to the Mid-East and not because all speculators are now turned bullish. Has oil rallied because all speculators now suddenly have turned bullish? We don’t think so. Brent crude has probably jumped because some Indian and Chinese oil purchasers of have redirected their purchases from Russia towards the Mid-East just in case the sanctions really materializes on 21 November.
Parts of the Brent crude curve dipping into the high $50ies/b. Brent crude fell 2.3% over the week to Friday. It closed the week at $61.29/b, a slight gain on the day, but also traded to a low of $60.14/b that same day and just barely avoided trading into the $50ies/b. This morning it is risk-on in equities which seems to help industrial metals a little higher. But no such luck for oil. It is down 0.8% at $60.8/b. This week looks set for Brent crude to dip its feet in the $50ies/b. The Brent 3mth contract actually traded into the high $50ies/b on Friday.
The front-end backwardation has been on a weakening foot and is now about to fully disappear. The lowest point of the crude oil curve has also moved steadily lower and lower and its discount to the 5yr contract is now $6.8/b. A solid contango. The Brent 3mth contract did actually dip into the $50ies/b intraday on Friday when it traded to a low point of $59.93/b.
More weakness to come as lots of oil at sea comes to ports. Mid-East OPEC countries have boosted exports along with lower post summer consumption and higher production. The result is highly visibly in oil at sea which increased by 17 mb to 1,311 mb over the week to Sunday. Up 185 mb since mid-August. On its way to discharge at a port somewhere over the coming month or two.
Don’t forget that the oil market path ahead is all down to OPEC+. Remember that what is playing out in the oil market now is all by design by OPEC+. The group has decided that the unwind of the voluntary cuts is what it wants to do. In a combination of meeting demand from consumers as well as taking back market share. But we need to remember that how this plays out going forward is all at the mercy of what OPEC+ decides to do. It will halt the unwinding at some point. It will revert to cuts instead of unwind at some point.
A few months with Brent at $55/b and 40-50 US shale oil rigs kicked out may be what is needed. We think OPEC+ needs to see the exit of another 40-50 drilling rigs in the US shale oil patches to set US shale oil production on a path to of a 1 mb/d year on year decline Dec-25 to Dec-26. We are not there yet. But a 2-3 months period with Brent crude averaging $55/b would probably do it.
Oil on water increased 17 mb over the week to Sunday while oil in transit increased by 23 mb. So less oil was standing still. More was moving.

Crude oil floating storage (stationary more than 7 days). Down 11 mb over week to Sunday

The lowest point of the Brent crude oil curve versus the 5yr contract. Weakest so far this year.

Crude oil 1mth to 3mth time-spreads. Dubai held out strongly through summer, but then that center of strength fell apart in late September and has been leading weakness in crude curves lower since then.

Rebounding along with most markets. But concerns over solidity of Gaza peace may also contribute. Brent crude fell 0.8% yesterday to $61.91/b and its lowest close since May this year. This morning it is bouncing up 0.9% to $62.5/b along with a softer USD amid positive sentiment with both equities and industrial metals moving higher. Concerns that the peace in Gaza may be less solid than what one might hope for also yields some support to Brent. Bets on tech stocks are rebounding, defying fears of trade war. Money moving back into markets. Gold continues upwards its strong trend and a softer dollar helps it higher today as well.
US crude & products probably rose 5.6 mb last week (API) versus a normal seasonal decline of 2.4 mb. The US API last night partial and thus indicative data for US oil inventories. Their data indicates that US crude stocks rose 7.4 mb last week, gasoline stocks rose 3.0 mb while Distillate stocks fell 4.8 mb. Altogether an increase in commercial crude and product stocks of 5.6 mb. Commercial US crude and product stocks normally decline by 2.4 mb this time of year. So seasonally adjusted the US inventories rose 8 mb last week according to the indicative numbers by the API. That is a lot. Also, the counter seasonal trend of rising stocks versus normally declining stocks this time of year looks on a solid pace of continuation. If the API is correct then total US crude and product stocks would stand 41 mb higher than one year ago and 6 mb higher than the 2015-19 average. And if we combine this with our knowledge of a sharp increase in production and exports by OPEC(+) and a large increase in oil at sea, then the current trend in US oil inventories looks set to continue. So higher stocks and lower crude oil prices until OPEC(+) switch to cuts. Actual US oil inventory data today at 18:00 CET.
US commercial crude and product stocks rising to 1293 mb in week 41 if last nights indicative numbers from API are correct.

Crude oil soon coming to a port near you. OPEC has lifted production sharply higher this autumn. At the same time demand for oil in the Middle-East has fallen as we have moved out of summer heat and crude oil burn for power for air-conditioning. The Middle-East oil producers have thus been able to lift exports higher on both accounts. Crude oil and condensates on water has shot up by 177 mb since mid-August. This oil is now on its way to ports around the world. And when they arrive, it will likely help to lift stocks onshore higher. That is probably when we will lose the last bit of front-end backwardation the the crude oil curves. That will help to drive the front-month Brent crude oil price down to the $60/b line and revisit the high $50ies/b. Then the eyes will be all back on OPEC+ when they meet in early November and then again in early December.
Crude oil and condensates at sea have moved straight up by 177 mb since mid-August as OPEC(+) has produced more, consumed less and exported more.


Sell the rally. Trump has become predictable in his unpredictability

Gruvbolaget Boliden överträffade analytikernas förväntningar

Australien och USA investerar 8,5 miljarder USD för försörjningskedja av kritiska mineraler
Brent crude set to dip its feet into the high $50ies/b this week

Vad guldets uppgång egentligen betyder för världen

Goldman Sachs höjer prognosen för guld, tror priset når 4900 USD

Blykalla och amerikanska Oklo inleder ett samarbete

Guld nära 4000 USD och silver 50 USD, därför kan de fortsätta stiga

Leading Edge Materials är på rätt plats i rätt tid

Nytt prisrekord, guld stiger över 4000 USD
-
 Nyheter3 veckor sedan
Goldman Sachs höjer prognosen för guld, tror priset når 4900 USD
-
 Nyheter4 veckor sedan
Blykalla och amerikanska Oklo inleder ett samarbete
-
 Nyheter4 veckor sedan
Guld nära 4000 USD och silver 50 USD, därför kan de fortsätta stiga
-
 Nyheter2 veckor sedan
Leading Edge Materials är på rätt plats i rätt tid
-
 Nyheter3 veckor sedan
Nytt prisrekord, guld stiger över 4000 USD
-

 Nyheter4 veckor sedan
Ett samtal om guld, olja, koppar och stål
-
Analys4 veckor sedan
OPEC+ will likely unwind 500 kb/d of voluntary quotas in October. But a full unwind of 1.5 mb/d in one go could be in the cards
-

 Nyheter4 veckor sedan
Neptune Energy bekräftar enorma litiumfyndigheter i Tyskland