

Analys
Ingen tvärbroms på råvarornas supercykel

 När Kina ställer om ekonomin till att drivas mer av inhemsk konsumtion lär det leda till både lägre tillväxttal och ändrad råvarukonsumtion. Betyder det att råvarornas så kallade supercykel är över? Både ja och nej.
Kina håller i snabb takt på att ställa om ekonomin från infrastrukturinvesteringar och export av lågförädlade varor som största drivkrafter, till en mer uthållig tillväxt driven av inhemsk konsumtion. Det kommer att leda till lägre tillväxttal framöver, och till en helt annan profil på Kinas råvarukonsumtion.
I det stora perspektivet kan omställningen av Kinas tillväxtmodell bara beskrivas som helt naturlig. Det är en utveckling som ska komma när människor får det bättre, blir bättre utbildade, ökar medvetenheten om miljöpåverkan och så vidare. Drivkraften hos invånarna skiftar: Från att arbeta maximalt för att kunna skicka hem pengar till anhöriga, arbetar de för att njuta mer av livet eller kunna leva lite mer västerländskt.
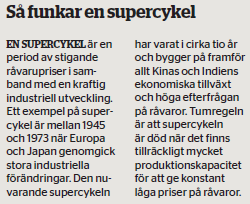 Men utvecklingen har också lett till resonemang runt att råvarornas så kallade ”supercykel” (se faktaruta), skapad av Kinas oerhörda tillväxt de senaste tio åren, är över. Det finns ett väldigt tydligt samband mellan å ena sidan hur nationer tar sig ur fattigdom och utvecklar en medelklass, och å andra sidan hur efterfrågan på råvaror ser ut. Förenklat kan man säga att industrialisering leder till stigande ekonomiskt välstånd som bygger på att en fysisk infrastruktur utvecklas, med allt från bostäder och vägar till fabriker, bilar, broar, järnvägar och flygplatser. I Kina har dessa infrastrukturprojekt antagit närmast ofattbara proportioner under de senaste två decennierna. Det har skapat en gigantisk efterfrågan på råvaror, som i sin tur lett till kraftiga prisökningar. Det mest framträdande exemplet är koppar som under de senaste tio åren stigit med 390 procent.
 Kina har under de senaste tio åren gått från cirka 3 000 dollar i BNP per capita till strax under 10 000 dollar. Just det intervallet brukar vara den mest råvaruintensiva fasen i ett lands utveckling. Efter att BNP per capita överstigit 12 000 dollar planar råvarukonsumtionen normalt ut, och ändrar framför allt karaktär.
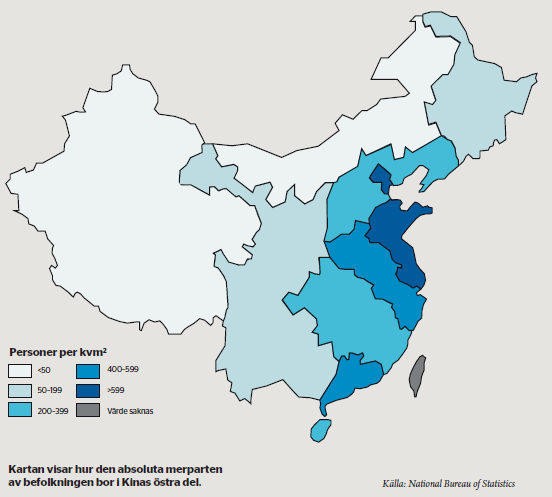
Det kan dock visa sig vara lite tidigt att dra slutsatser angående den kinesiska drakens aptit på de mer basala råvarorna såsom metaller och annat som behövs för infrastrukturbyggen. Kina är som bekant en gigantisk nation. Det är dessutom en nation med stora regionala skillnader. Detta gör att det kan vara vanskligt att använda samma analys som i andra, mindre länder. De regioner i Kina som nått längst i ”industrialiseringen” och som vid utgången av 2012 låg över 20 000 dollar i BNP per capita är Beijing och Shanghai, samt de regioner som ligger i dessa megastäders närhet. Det är dock viktigt att ha i åtanke att i dessa regioner bor ”endast” cirka 60 miljoner invånare. Tittar man på hur stor del av Kinas befolkning som ligger över 12 000 dollar i BNP per capita så landar summan på strax under en halv miljard invånare. Det är närmast ofattbart stora siffror.
 Men – det betyder i sin tur att 850 miljoner människor, framför allt i inlandet, ligger kvar på väldigt låga nivåer när det gäller välstånd, utveckling och urbanisering. Det är 100 miljoner fler invånare än vad som bor i hela Europa (inklusive Ryssland). Dessa 850 miljoner har inte gjort den resa som den mer utvecklade delen av Kina gjort, och det är dit som en allt större del av tillverkning och ysselsättning nu flyttar.
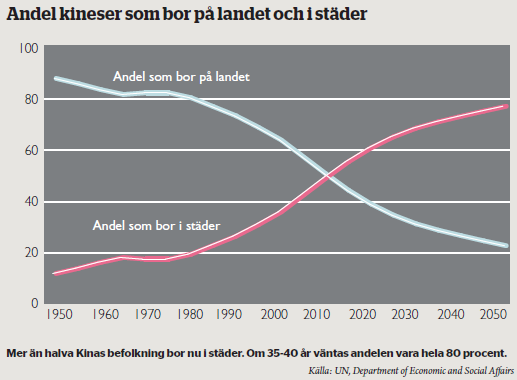
Megastäderna har nämligen blivit väldigt dyra för arbetssökande att flytta till, och löneinflationen har varit mycket hög i de heta regionerna. Det skapar ett tryck att utveckla nya regioner inne i landet, och öka urbaniseringsgraden där. Och just urbanisering är inte bara väldigt en väldig drivkraft i efterfrågan på råvaror – det är också en av de starkaste trender vi ser i världen. Enligt FN:s prognoser kommer det redan år 2030 finnas 221 städer i Kina som är större än Stockholm, och det kommer att finnas 23 städer med fler än fem miljoner invånare.
Urbaniseringstakten är i princip lika hög var man än tittar i Asien, oavsett urbaniseringsgraden. Med andra ord finns det få anledningar att tro att urbaniseringen i Kina ska avstanna, även om landet nu nått en bit över 50 procents urbaniseringsgrad. Som jämförelse ligger motsvarande siffra i Japan runt 90 procent, och där fortsätter folk att flytta till städer. Liksom här i Sverige…
Biltätheten, som är intimt knuten till den ekonomiska aktiviteten, är också den ojämnt spridd mellan den utvecklade delen av landet och de delar som inte kommit lika långt. En växande bilflotta kommer inte bara att påverka förbrukningen av bensin och diesel – den kräver också fortsatta stora investeringar i infrastruktur som vägar, broar och tunnlar.
Kinas enorma storlek i sig gör alltså att nationella jämförelser blir svåra. Skillnaderna mellan olika provinser är väldigt stora och skillnaderna mellan stad och landsbygd är enorma. Det finns all anledning att tro att Kina kommer att ha väldigt stor påverkan på den globala råvaruefterfrågan under lång tid ännu. Därför måste vi svara både ja och nej på frågan om supercykeln är över: Ja, den är över för de utvecklade och industrialiserade regionerna. Men också nej: För en gigantisk del av befolkningen har den bara börjat.


Rebounding along with most markets. But concerns over solidity of Gaza peace may also contribute. Brent crude fell 0.8% yesterday to $61.91/b and its lowest close since May this year. This morning it is bouncing up 0.9% to $62.5/b along with a softer USD amid positive sentiment with both equities and industrial metals moving higher. Concerns that the peace in Gaza may be less solid than what one might hope for also yields some support to Brent. Bets on tech stocks are rebounding, defying fears of trade war. Money moving back into markets. Gold continues upwards its strong trend and a softer dollar helps it higher today as well.

US crude & products probably rose 5.6 mb last week (API) versus a normal seasonal decline of 2.4 mb. The US API last night partial and thus indicative data for US oil inventories. Their data indicates that US crude stocks rose 7.4 mb last week, gasoline stocks rose 3.0 mb while Distillate stocks fell 4.8 mb. Altogether an increase in commercial crude and product stocks of 5.6 mb. Commercial US crude and product stocks normally decline by 2.4 mb this time of year. So seasonally adjusted the US inventories rose 8 mb last week according to the indicative numbers by the API. That is a lot. Also, the counter seasonal trend of rising stocks versus normally declining stocks this time of year looks on a solid pace of continuation. If the API is correct then total US crude and product stocks would stand 41 mb higher than one year ago and 6 mb higher than the 2015-19 average. And if we combine this with our knowledge of a sharp increase in production and exports by OPEC(+) and a large increase in oil at sea, then the current trend in US oil inventories looks set to continue. So higher stocks and lower crude oil prices until OPEC(+) switch to cuts. Actual US oil inventory data today at 18:00 CET.
US commercial crude and product stocks rising to 1293 mb in week 41 if last nights indicative numbers from API are correct.

Crude oil soon coming to a port near you. OPEC has lifted production sharply higher this autumn. At the same time demand for oil in the Middle-East has fallen as we have moved out of summer heat and crude oil burn for power for air-conditioning. The Middle-East oil producers have thus been able to lift exports higher on both accounts. Crude oil and condensates on water has shot up by 177 mb since mid-August. This oil is now on its way to ports around the world. And when they arrive, it will likely help to lift stocks onshore higher. That is probably when we will lose the last bit of front-end backwardation the the crude oil curves. That will help to drive the front-month Brent crude oil price down to the $60/b line and revisit the high $50ies/b. Then the eyes will be all back on OPEC+ when they meet in early November and then again in early December.
Crude oil and condensates at sea have moved straight up by 177 mb since mid-August as OPEC(+) has produced more, consumed less and exported more.

When it starts to move lower it moves rather quickly. Gaza, China, IEA. Brent crude is down 2.1% today to $62/b after having traded as high as $66.58/b last Thursday and above $70/b in late September. The sell-off follows the truce/peace in Gaze, a flareup in US-China trade and yet another bearish oil outlook from the IEA.
A lasting peace in Gaze could drive crude oil at sea to onshore stocks. A lasting peace in Gaza would probably calm down the Houthis and thus allow more normal shipments of crude oil to sail through the Suez Canal, the Red Sea and out through the Bab-el-Mandeb Strait. Crude oil at sea has risen from 48 mb in April to now 91 mb versus a pre-Covid normal of about 50-60 mb. The rise to 91 mb is probably the result of crude sailing around Africa to be shot to pieces by the Houthis. If sailings were to normalize through the Suez Canal, then it could free up some 40 mb in transit at sea moving onshore into stocks.
The US-China trade conflict is of course bearish for demand if it continues.
Bearish IEA yet again. Getting closer to 2026. Credibility rises. We expect OPEC to cut end of 2025. The bearish monthly report from the IEA is what it is, but the closer we get to 2026, the more likely the IEA is of being ball-park right in its outlook. In its monthly report today the IEA estimates that the need for crude oil from OPEC in 2026 will be 25.4 mb/d versus production by the group in September of 29.1 mb/d. The group thus needs to do some serious cutting at the end of 2025 if it wants to keep the market balanced and avoid inventories from skyrocketing. Given that IEA is correct that is. We do however expect OPEC to implement cuts to avoid a large increase in inventories in Q1-26. The group will probably revert to cuts either at its early December meeting when they discuss production for January or in early January when they discuss production for February. The oil price will likely head yet lower until the group reverts to cuts.
Dubai: The Mid-East anchor dragging crude oil lower. Surplus emerging in Mid-East pricing. Crude oil prices held surprisingly strong all through the summer. A sign and a key source of that strength came from the strength in the front-end backwardation of the Dubai crude oil curve. It held out strong from mid-June and all until late September with an average 1-3mth time-spread premium of $1.8/b from mid-June to end of September. The 1-3mth time-spreads for Brent and WTI however were in steady deterioration from late June while their flat prices probably were held up by the strength coming from the Persian Gulf. Then in late September the strength in the Dubai curve suddenly collapsed. Since the start of October it has been weaker than both the Brent and the WTI curves. The Dubai 1-3mth time-spread now only stands at $0.25/b. The Middle East is now exporting more as it is producing more and also consuming less following elevated summer crude burn for power (Aircon) etc.
The only bear-element missing is a sudden and solid rise in OECD stocks. The only thing that is missing for the bear-case everyone have been waiting for is a solid, visible rise in OECD stocks in general and US oil stocks specifically. So watch out for US API indications tomorrow and official US oil inventories on Thursday.
No sign of any kind of fire-sale of oil from Saudi Arabia yet. To what we can see, Saudi Arabia is not at all struggling to sell its oil. It only lowered its Official Selling Prices (OSPs) to Asia marginally for November. A surplus market + Saudi determination to sell its oil to the market would normally lead to a sharp lowering of Saudi OSPs to Asia. Not yet at least and not for November.
The 5yr contract close to fixed at $68/b. Of importance with respect to how far down oil can/will go. When the oil market moves into a surplus then the spot price starts to trade in a large discount to the 5yr contract. Typically $10-15/b below the 5yr contract on average in bear-years (2009, 2015, 2016, 2020). But the 5yr contract is usually pulled lower as well thus making this approach a moving target. But the 5yr contract price has now been rock solidly been pegged to $68/b since 2022. And in the 2022 bull-year (Brent spot average $99/b), the 5yr contract only went to $72/b on average. If we assume that the same goes for the downside and that 2026 is a bear-year then the 5yr goes to $64/b while the spot is trading at a $10-15/b discount to that. That would imply an average spot price next year of $49-54/b. But that is if OPEC doesn’t revert to cuts and instead keeps production flowing. We think OPEC(+) will trim/cut production as needed into 2026 to prevent a huge build-up in global oil stocks and a crash in prices. But for now we are still heading lower. Into the $50ies/b.
Some rebound but not much. Brent crude rebounded 1.5% yesterday to $65.47/b. This morning it is inching 0.2% up to $65.6/b. The lowest close last week was on Thursday at $64.11/b.
The curve structure is almost as week as it was before the weekend. The rebound we now have gotten post the message from OPEC+ over the weekend is to a large degree a rebound along the curve rather than much strengthening at the front-end of the curve. That part of the curve structure is almost as weak as it was last Thursday.
We are still on a weakening path. The message from OPEC+ over the weekend was we are still on a weakening path with rising supply from the group. It is just not as rapidly weakening as was feared ahead of the weekend when a quota hike of 500 kb/d/mth for November was discussed.
The Brent curve is on its way to full contango with Brent dipping into the $50ies/b. Thus the ongoing weakening we have had in the crude curve since the start of the year, and especially since early June, will continue until the Brent crude oil forward curve is in full contango along with visibly rising US and OECD oil inventories. The front-month Brent contract will then flip down towards the $60/b-line and below into the $50ies/b.
At what point will OPEC+ turn to cuts? The big question then becomes: When will OPEC+ turn around to make some cuts? At what (price) point will they choose to stabilize the market? Because for sure they will. Higher oil inventories, some more shedding of drilling rigs in US shale and Brent into the 50ies somewhere is probably where the group will step in.
There is nothing we have seen from the group so far which indicates that they will close their eyes, let the world drown in oil and the oil price crash to $40/b or below.
The message from OPEC+ is also about balance and stability. The world won’t drown in oil in 2026. The message from the group as far as we manage to interpret it is twofold: 1) Taking back market share which requires a lower price for non-OPEC+ to back off a bit, and 2) Oil market stability and balance. It is not just about 1. Thus fretting about how we are all going to drown in oil in 2026 is totally off the mark by just focusing on point 1.
When to buy cal 2026? Before Christmas when Brent hits $55/b and before OPEC+ holds its last meeting of the year which is likely to be in early December.
Brent crude oil prices have rebounded a bit along the forward curve. Not much strengthening in the structure of the curve. The front-end backwardation is not much stronger today than on its weakest level so far this year which was on Thursday last week.

The front-end backwardation fell to its weakest level so far this year on Thursday last week. A slight pickup yesterday and today, but still very close to the weakest year to date. More oil from OPEC+ in the coming months and softer demand and rising inventories. We are heading for yet softer levels.


Vad guldets uppgång egentligen betyder för världen

Spotpriset på guld över 4300 USD och silver över 54 USD
Crude oil soon coming to a port near you

Guld och silver stiger hela tiden mot nya höjder
The Mid-East anchor dragging crude oil lower

OPEC+ missar produktionsmål, stöder oljepriserna

Ett samtal om guld, olja, fjärrvärme och förnybar energi
Guld nära 4000 USD och silver 50 USD, därför kan de fortsätta stiga

Goldman Sachs höjer prognosen för guld, tror priset når 4900 USD
Are Ukraine’s attacks on Russian energy infrastructure working?
-
 Nyheter3 veckor sedan
OPEC+ missar produktionsmål, stöder oljepriserna
-
 Nyheter3 veckor sedan
Ett samtal om guld, olja, fjärrvärme och förnybar energi
-
 Nyheter2 veckor sedan
Guld nära 4000 USD och silver 50 USD, därför kan de fortsätta stiga
-
 Nyheter1 vecka sedan
Goldman Sachs höjer prognosen för guld, tror priset når 4900 USD
-
Analys3 veckor sedan
Are Ukraine’s attacks on Russian energy infrastructure working?
-

 Nyheter2 veckor sedan
Blykalla och amerikanska Oklo inleder ett samarbete
-

 Nyheter4 veckor sedan
Guldpriset uppe på nya höjder, nu 3750 USD
-
Nyheter2 veckor sedan
Ett samtal om guld, olja, koppar och stål