

Analys
Getting to zero, getting the job done


Politicians have been talking and talking for decades but with only marginal improvements in terms of emission reductions. Primarily because actually doing the job has earlier been technologically and economically almost impossible. Now suddenly renewable energy has come of age with prices set to decline yet further. And onshore transportation can soon be electrified cost efficiently. For politicians there is now a viable path. It is still a large task but now it is more and more about just getting the job done. In rough terms some € 150 – 250 bn per year to 2050 is probably needed to build EU’s new power system.

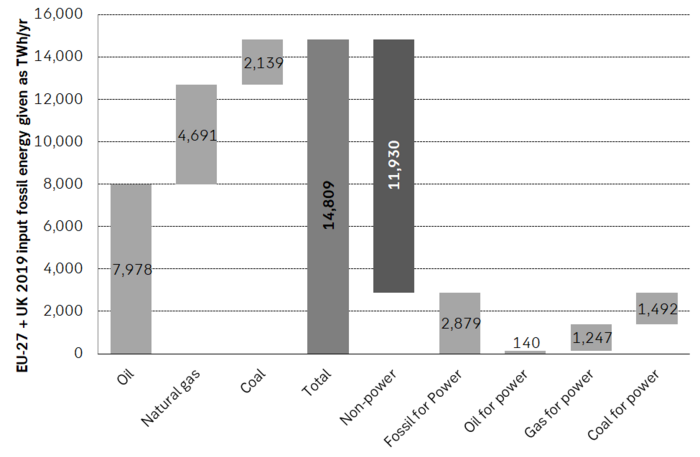
In 2019 the EU + UK consumed 15,000 worth of fossil fuels. It all needs to be gone by 2050. In 2019 the EU + UK produced 3,200 TWh of electricity of which 1,295 TWh (40%) was fossil fuel based. Thus 60% of the power supply is already non-fossil. However, if we look at the larger picture of energy we see that the region consumed nearly 15,000 TWh of raw (evaluated pre-combustion) fossil fuels that year of which only 3,000 TWh was used for power. The remaining 12,000 TWh of fossil fuel consumption was consumed for heat, transportation, petrochemical and industrial uses. I.e. the lion’s share of fossil fuel consumption in the region is non-power related.
Thus getting to zero by 2050 is far more than swapping out of the 3,000 TWh of fossil fuels (pre-combustion) used for power supply today which post combustion creates 40% and 1,295 TWh of the regions electricity supply. The challenge is also about replacing the other 12,000 TWh of fossil energy for non-power uses.
As most know the conversion of fossil fuels to useful energy and work done is highly inefficient. In cars one rarely get more than 30% of the energy converted to useful driving with the rest just lost as heat. In large, power plants the conversion ratio is usually around 35% to 55% but mostly below 50%. Gas for heating purposes is of course highly efficient as almost all of it naturally is converted to heat.
The region is now aiming to go green by 2050 and that mostly means going electric. This again means that some 15,000 TWh of fossil energy spent today needs to be replaced by non-fossil based electricity. Given the highly inefficient burn of fossil energy to useful work it is no surprise that we don’t need the same amount of electricity output to replace it but rather something like only 30% to 50% as much.
When it comes to synthetically generated “electric fuels” (power to liquids or hydrogen) we are talking about an up to 200% replacement ratio because up to 50% of the electricity is lost in the conversion of power to liquids. But for most other purposes like electrifying transportation and replacing the burning of fossil fuels for power etc. the replacement ratio is often more like 30% to 50%. When it comes to replacing gas for heating purposes it is a one-to-one replacement.
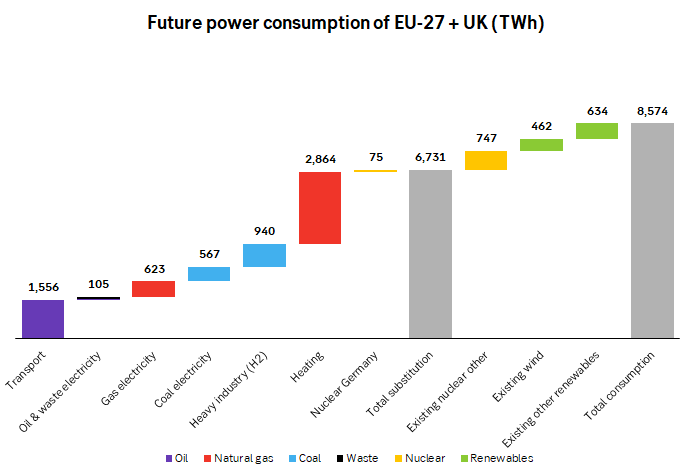
In our calculations the region is going to need 6,731 TWh of new non-fossil based electricity by 2050 in order to replace the 15,000 TWh worth (pre-combustion) of fossil energy spent today. I.e. a replacement ratio of 46%. It is thus good news that we don’t need at total of 15,000 TWh of new non-fossil based power supply by 2050 but instead “only” 6,731 TWh.
This replacement is still huge! In comparison the supply of electricity in 2019 was 3,200 TWh (including fossil based power). I.e. the region needs to build its total power supply of today more than two times over by 2050 and at that point in time reach a total power supply of 8,574 TWh.
If we equate the challenge to the number of nuclear power units needed to cover it we are talking 570 new nuclear power units each of 1,500 MW capacity. In 2013 there were 131 operational nuclear power plants and today we are probably closer to 110. Thus to do the job by nuclear we need to increase nuclear power by more than 500% by 2050.
While the job is challenging it is by no means impossible. If we take the new UK Hinkley nuclear power plant as an example in terms of capex we have the following. It will generate about 25 TWh of electricity per year and cost about € 27 bn to build. I.e. €1.1 bn for a 1 TWh/year supply rate. Multiply by the needed 6,731 TWh/year of new power supply by 2050 and we get a needed capex € 7,147 bn in total which again equates to € 238 bn/yr over the next 30 years. Nuclear power is today considered to be a quite expensive source of new electricity with renewable energy often being significantly cheaper (up to 50% cheaper) though not providing baseload supply and rather intermittent supply.
Capex spending in the EU + UK should be in the ball-park of € 150 – 250 bn per year or 1.3% of GDP. Capex spending on new power supply over the coming 30 years should probably be in the ball-park of $ 150 – 250bn/year. And then some additional investments for a lot of infrastructure adaptation. EU and UK thus needs to spend some 1.3% of its GDP per year for the energy transition (€ 238 bn/yr divided by GDP of € 18,292 bn in 2019). But that of course assumes that there is no further declines in the cost of new renewable energy which by most measures is projected to continue to fall year by year. And going electric in the transportation sector (on land) will in not too long be a pure net saving as electric cars becomes cheaper than fossil cars while electric cars are also much more energy efficient than fossil cars.
The example of nuclear energy is for simplicity purposes. It is not in the cards at all today that the region is going big-time nuclear. The direction is rather much more renewable energy.
On the table we already have a pledge of 2,100 TWh/year of offshore wind by 2050. On the drawing table we already have an announced build-out of 300 GW of new offshore wind by the EU and 100 GW of offshore wind by the UK. Both by 2050. What does that mean? At a 60% offshore wind utilization ratio this equates to 2,100 TWh/year of new power supply by 2050. Thus already today a total of 31% of the new, needed 6,731 TWh by 2050 is firmly on the drawing table.
For many decades there has been endless political discussions about climate change. As a result we have moved a little forward but not all that much. We have gotten the European emission trading scheme (EU ETS) which is good and where we now have a decent carbon price of € 42/ton which starts to matter and where abatement (carbon reductions) is happening on the margin.
We have now come to the point where it is all bout getting the job done. To actually build what needs to be replaced. However, we have now gotten to the point of crunch-time. The time to act. The time to start the real change. Now it is about figuring out how to get to zero by 2050. Now it is all about getting the job done for real. Our sense is that thousands of engineers across Europe today suddenly are mapping out detailed plans of what we actually need to do to get there. It is not easy. It does not happen by itself. But it is absolutely doable and it will require some €150 – 250/bn per year in capex spending on new non-fossil based power supply over the next 30 years. But probably less than that as the cost of renewable energy continues to decline.
The region is not going to get to zero by 2050 by marginal abatement in the EU ETS emission system. The region is going to get there by outright building the alternative and then increasingly retiring the current system. And what it looks like already is that offshore wind is going to be a major part of the solution with plans already in place to solve 30% of the challenge.
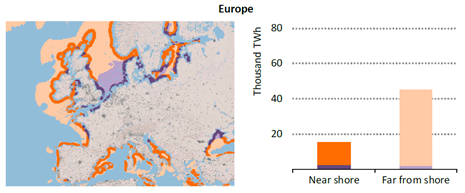
IEA estimated in a report from 2019 that technical offshore wind power resources in Europe is 60,000 TWh worth of power supply. That is almost 10 times as much as what is needed to solve EU + UK’s goal of zero emissions by 2050. And as stated above the two have already committed to build 2,100 TWh/year of offshore wind power supply by 2050. So on the drawing table we are already one third of the way.
Norway is not really on the map here yet but it could easily offer to build 2,000 TWh of offshore wind power supply if EU agreed to buy it and pay for it at an agreeable price. If so this would lead to a real offshore wind bonanza over the coming 30 years equal to the build-out of the oil and gas on the NCS.
The EU + UK needs to kick the habit of consuming close to 15,000 TWh worth of fossil fuels per year by 2050 (evaluated pre-combustion). The replacement is going to happen by building the alternative and governments will be involved big-time to get it done. The current power supply for the region needs to be build more than two times over by 2050 to get the job done.
The EU + UK produced a total of 3,200 TWh of power in 2019 of which 1,295 TWh (40%) was generated by fossil fuels. In total the EU + UK will need 6,731 TWh of new non-fossil based power supply by 2050 in order to kick 15,000 worth of fossil fuels (evaluated pre-combustion) out the door. At that point total power supply in the region needs to be 8,574 TWh/year in order for the region to go green. Of the 6,731 TWh of new non-fossil power needed we already have a pledge by the EU and the UK together of 2,100 TWh of new offshore wind power supply by 2050. Thus 31% of the power needed to go fully green by 2050 is already pledged for through offshore wind. In the following graph ”EU” is short of ”EU+UK” for the sake of abbreviation.

The following graph shows how much new non-emitting power supply the EU + UK needs for each sector to go electric and green by 2050. Today’s consumption of 15,000 TWh (pre-combustion) is mostly outside of the power sector. Some 1,900 TWh of current power supply can be kept for the future as it is non-emitting like nuclear, wind and other renewables. Total non-emitting power supply in the region needs to be 8,574 TWh by 2050 in order to go green.
Technical offshore wind potential in Europe is close to 60,000 TWh per year according to a recent report by the IEA published in November 2019. Almost 10x of what the EU + UK needs to go fully green by 2050. And much of the capacity is in the North Sea between the UK and Norway.
Brent is climbing higher. Front-month is at USD 106.3/bl this morning, close to a weekly high and a USD 9/bl jump from Mondays open. This is the move we flagged as a risk earlier in the week: the market shifting from ”a deal is around the corner” to ”this is going to take longer than we thought”.

Analyst Commodities, SEB
During April, rest-of-year Brent remained remarkably stable around USD 90/bl. A stability which rested on one single assumption: the SoH reopens around 1 May. That assumption is now slowly falling apart.
As we highlighted yesterday: every week of delay beyond 1 May adds (theoretically) ish USD 5/bl to the rest-of-year average, as global inventories draw 100 million barrels per week. i.e., a mid-May reopening implies rest-of-year Brent closer to USD 100/bl, and anything pushing into June or July takes us meaningfully higher.
What’s changed in the last 48 hours:
#1: The US military has formally warned that clearing suspected sea mines from SoH could take up to six months. That is a completely different timescale from what the financial market is pricing. Even a political deal tomorrow does not immediately reopen the strait.
#2: Trump has shifted his tone from urgency to ”strategic patience”. In yesterday’s press conference: ”Don’t rush me… I want a great deal.” The market is reading this as a president no longer feeling pressured by timelines, with the naval blockade running in the background.
#3: So far, the military activity is escalating, not de-escalating. Axios reports Iran is laying more mines in SoH. The US 3rd carrier strike group (USS George H.W. Bush) is arriving with two countermine vessels. Trump yesterday ordered the US Navy to destroy any Iranian boats caught laying mines. While CNN reports that the Pentagon is actively drawing up plans to strike Iranian SoH capabilities and individual Iranian military leaders if the ceasefire collapses. i.e., NOT a attitude consistent with an imminent deal!
Spot crude and product prices eased off the early-April highs on a combination of system rerouting and deal optimism. Both now weakening. Goldman estimates April Gulf output is reduced by 14.5 mbl/d, or 57% of pre-war supply, a number that keeps getting worse the longer this drags on.
Demand-side adaptation is ongoing: S. Korea has cut its Middle East crude dependence from 69% to 56% by pulling more from the Americas and Africa, and Japan is kicking off a second round of SPR releases from 1 May. But SPRs are finite.
Ref. to the negotiations, we should not bet on speed. The current Iranian leadership is dominated by genuine hardliners willing to absorb economic pain and run the clock to extract concessions. That is not a setup for a rapid resolution. US/Israeli media briefings keep framing the delay as ”internal Iranian divisions”, the reality is more complicated and points toward weeks and months, not days.
Our point is that the complexity is large, and higher prices have only just started (given a scenario where the negotiations drag out in time). The market spent April leaning on the USD 90/bl rest-of-year assumption; that case is diminishing by the hour. If ”early May reopening” is replaced by ”June, July or later” over the next week or two, both crude and products have meaningful room to reprice higher from here. There is a high risk being short energy and betting on any immediate political resolution(!).
Down on Friday. Up on Monday. The Brent June crude oil contract traded down 5.1% last week to a close of $90.38/b. It reached a high of $103.87/b last Monday and a low of $86.09/b on Friday as Iran announced that the Strait of Hormuz was fully open for transit. That quickly changed over the weekend as the US upheld its blockade of Iranian oil exports while Iran naturally responded by closing the SoH again. The US blew a hole in the engine room of the Iranian ship TOUSKA and took custody of the ship on Sunday. Brent crude is up 5.6% this morning to $95.4/b.

The cease-fire is expiring tomorrow. The US has said it will send a delegation for a second round of negotiations in Islamabad in Pakistan. But Iran has for now rejected a second round of talks as it views US demands as unrealistic and excessive while the US is also blocking the Strait of Hormuz.
While Brent is up 5% this morning, the financial market is still very optimistic that progress will be made. That talks will continue and that the SoH will fully open by the start of May which is consistent with a rest-of-year average Brent crude oil price of around $90/b with the market now trading that balance at around $88/b.
Financial optimism vs. physical deterioration. We have a divergence where the financial market is trading negotiations, improvements and resolution while at the same time the physical market is deteriorating day by day. Physical oil flows remain constrained by disrupted flows, longer voyage times and elevated freight and insurance costs.
Financial markets are betting that a US/Iranian resolution will save us in time from violent shortages down the road. But every day that the SoH remains closed is bringing us closer to a potentially very painful point of shortages and much higher prices.
The US blockade is also a weapon of leverage against its European and Asian allies. When Iran closed the SoH it held the world economy as a hostage against the US. The US blockade of the SoH is of course blocking Iranian oil exports. But it is also an action of disruption directed towards Europe and Asia. The US has called for the rest of the world to engaged in the war with Iran: ”If you want oil from the Persian Gulf, then go and get it”. A risk is that the US plays brinkmanship with the global oil market directed towards its European and Asian allies and maybe even towards China to force them to engage and take part. Maybe unthinkable. But unthinkable has become the norm with Trump in the White House.
Wild moves yesterday. Brent crude traded to a high of $114.43/b and a low of $96.0/b and closed at $99.94/b yesterday.
US – Iran negotiations ongoing or not? What a day. Donald Trump announced that good talks were ongoing between Iran and the US and that the 48 hour deadline before bombing Iranian power plants and energy infrastructure was postponed by five days subject to success of ongoing meetings. Iranian media meanwhile stated that no meetings were ongoing at all.
Today we are scratching our heads trying to figure out what yesterday was all about.
Friends and family playing the market? Was it just Trump and his friends and family who were playing with oil and equity markets with $580m and $1.46bn in bets being placed by someone in oil and equity markets just 15 minutes before Trump’s announcement?
Was Trump pulling a TACO as he reached his political and economic pain point: Brent at $112/b, US Gas at $4/gal, SPX below 200dma and US 10yr above 4.4%?
Different Iranian factions with Trump talking with one of them? Are there real negotiations going on but with the US talking to one faction in Iran while another, the hardliners, are not involved and are denying any such negotiations going on?
Extending the ultimatum to attack and invade Kharg island next weekend? Or, is the five day delay of the deadline a tactical decision to allow US amphibious assault ships and marines to arrive in the Gulf in the upcoming weekend while US and Israeli continues to degrade Iranian military targets till then. And then next weekend a move by the US/Israel to attack and conquer for example the Kharg island?
We do not really know which it is or maybe a combination of these.
We did get some kind of TACO ydy. But markets have been waiting for some kind of TACO to happen and yesterday we got some kind of TACO. And Brent crude is now trading at $101.5/b as a result rather than at $112-114/b as it did no the high yesterday.
But what really matters in our view is the political situation on the ground in Iran. Will hardliners continue to hold power or will a more pragmatic faction gain power?
If the hardliners remain in power then oil pain should extend all the way to US midterm elections. The hardliners were apparently still in charge as of last week. Iran immediately retaliated and damaged LNG infrastructure in Qatar after Israel hit Iranian South Pars. The SoH was still closed and all messages coming out of Iran indicated defiance. Hardliners continues in power has a huge consequence for oil prices going forward. The regime has played its ’oil-weapon’ (closing or chocking the Strait of Hormuz). It is using it to achieve political goals. Deterrence: it needs to be so politically and economically expensive to attack Iran that it won’t happen again in the future. Or at least that the US/Israel thinks 10-times over before they attack again. The highest Brent crude oil closing price since the start of the war is $112.19/b last Friday. In comparison the 20-year inflation adjusted Brent price is $103/b. So Brent crude last Friday at $112.19/b isn’t a shockingly high price. And it is still far below the nominal high of $148/b from 2008 which is $220/b if inflation adjusted. So once in a lifetime Iran activates its most powerful weapon. The oil weapon. It needs to show the power of this weapon and it needs to reap political gains. Getting Brent to $112/b and intraday high of $119.5/b (9 March) isn’t a display of the power of that weapon. And it is not a deterrence against future attacks.
So if the hardliners remain in power in Iran, then the SoH will likely remain chocked all the way to US midterm elections and Brent crude will at a minimum go above the historical nominal high of $148/b from 2008.
Thus the outlook for the oil price for the rest of the year doesn’t depend all that much of whether Trump pulls a TACO or not. Stops bombing or not. It depends more on who is in charge in Iran. If it is the hardliners, then deterrence against future attacks via chocking of the SoH and high oil prices is the likely line of action. It is impacting the world but the Iranian ’oil-weapon’ is directed towards the US president and the the US midterm elections.
If a pragmatic faction gets to power in Iran, then a very prosperous future is possible. However, if power is shifting towards a more pragmatic faction in Iran then a completely different direction could evolve. Such a faction could possibly be open for cooperation with the US and the GCC and possibly put its issues versus Israel aside. Then the prosperity we have seen evolving in Dubai could be a possible future also for Iran.
So far it looks like the hardliners are fully in charge. As far as we can see, the hardliners are still fully in control in Iran. That points towards continued chocking of the SoH and oil prices ticking higher as global inventories (the oil market buffers) are drawn lower. And not just for a few more weeks, but possibly all the way to the US midterm elections.


Solkraften pressar elpriserna dagtid

Michel Gubel ger sin syn på oljemarknaden

Svag vårflod dubblar elpriserna
Brent crude up USD 9/bl on the week… ”deal around the corner” narrative fades
Market Still Betting on Timely Resolution, But Each Day Raises Shortage Risk

Christian Kopfer om läget för oljan
Market Still Betting on Timely Resolution, But Each Day Raises Shortage Risk
Brent crude up USD 9/bl on the week… ”deal around the corner” narrative fades
Michel Gubel ger sin syn på oljemarknaden
Solkraften pressar elpriserna dagtid
-
 Nyheter4 veckor sedan
Christian Kopfer om läget för oljan
-
Analys3 veckor sedan
Market Still Betting on Timely Resolution, But Each Day Raises Shortage Risk
-
Analys3 veckor sedan
Brent crude up USD 9/bl on the week… ”deal around the corner” narrative fades
-
 Nyheter2 veckor sedan
Michel Gubel ger sin syn på oljemarknaden
-
 Nyheter2 veckor sedan
Solkraften pressar elpriserna dagtid
-
Nyheter2 veckor sedan
Svag vårflod dubblar elpriserna