

Analys
Dr. copper has been ringing the alarm bells since early June

 Price action – EM debt concerns, copper sell-off and rising US crude stocks
Brent crude yesterday rebounded 1.8% to an intraday high of $73.92/bl as the Turkish concerns eased a bit and the lira strengthened and OPEC reported that Saudi Arabia produced 10.288 k bl/d which was down 200 k bl/d m/m in July. The crude gain didn’t last out the day however as global growth concerns continued with a continued strengthening in the USD Index (+0.4%) and a further sell-off in industrial metals where copper sold off 1.8% just short of the $6000/ton line. Brent ended the day at $72.46/bl (-0.2%). It is down 1% this morning at $71.8/bl along with copper which has broken below the $6000/ton line and is down 2.2% this morning and down 19% since its peak in early June. Rising US crude stocks and EM debt concerns in focus.
Crude oil comment – Dr. copper has been ringing the alarm bells since early June

Bjarne Schieldrop, Chief analyst commodities
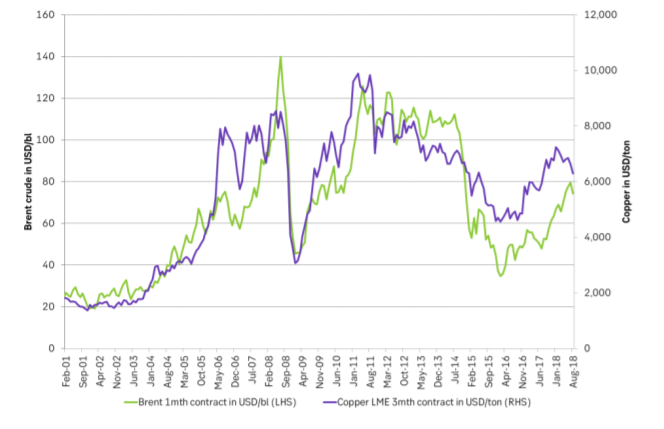
The copper alarm bells have been ringing since early June when it peaked out at $7332/ton. Since then it has been downhill. Copper has been labelled as the only metal with a Ph.D. in economics due to its “canary in the coal mine” ability to sense turning points in the global economy. This morning copper broke down below the $6000/ton line losing 1.7% only this morning.
Global growth has been sliding since January this year. Through this ongoing slide the thinking has been that this is transitory with accelerating global growth kicking in again in 2H18. That is definitely still possible. The thinking now however is increasingly that what we are seeing now in Turkey is only the first symptoms of the broad based ongoing financial tightening and exit of easy money by the world’s central banks. Bloomberg predicts that net asset purchases by the three main global central banks will decline from $100 billion a month in 2017 to zero by the end of the year.
This tightening will typically hit countries with substantial external dollar liabilities which they have accumulated during the easy money era. The Institute for International Finance estimates that debt in 30 emerging markets has increased from 143% in 2008 to 211% today (Bloomberg). Now the dollar is rallying and liquidity is tightening and dollar interest rates are rising. In addition Donald Trump tops up global growth concerns with escalating trade war talk/action and sanctions.
The USD Index continues higher and the US Fed continues its rate hike cycle and the world’s three main central banks continues to rein in easy liquidity and it all seems to come down on the shoulders of emerging market growth again hitting both sentiment and demand growth for both copper and oil.
There are many reasons to be bullish both crude and copper down the road but right here and now the arrows seem to point lower. Today we’ll have US manufacturing and retail sales data. If they continue on the strong side then the dollar gain and EM debt-pain probably has further to go with continued bearish pressure on crude and copper. We also have the weekly US oil inventory data due at 16.30 today which are expected to show a 2.5 m bl crude build with US API seeing it even higher at 3.7 m bl w/w.
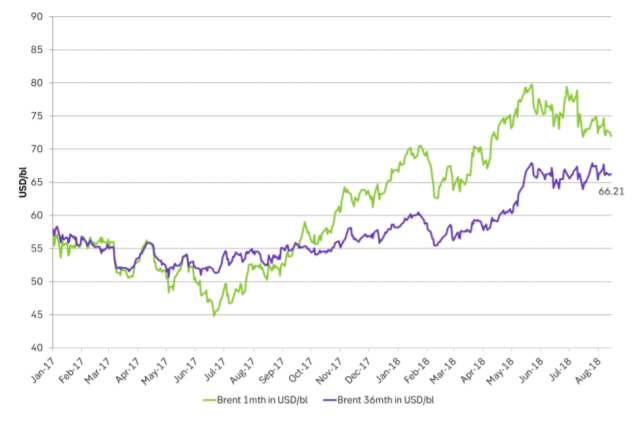
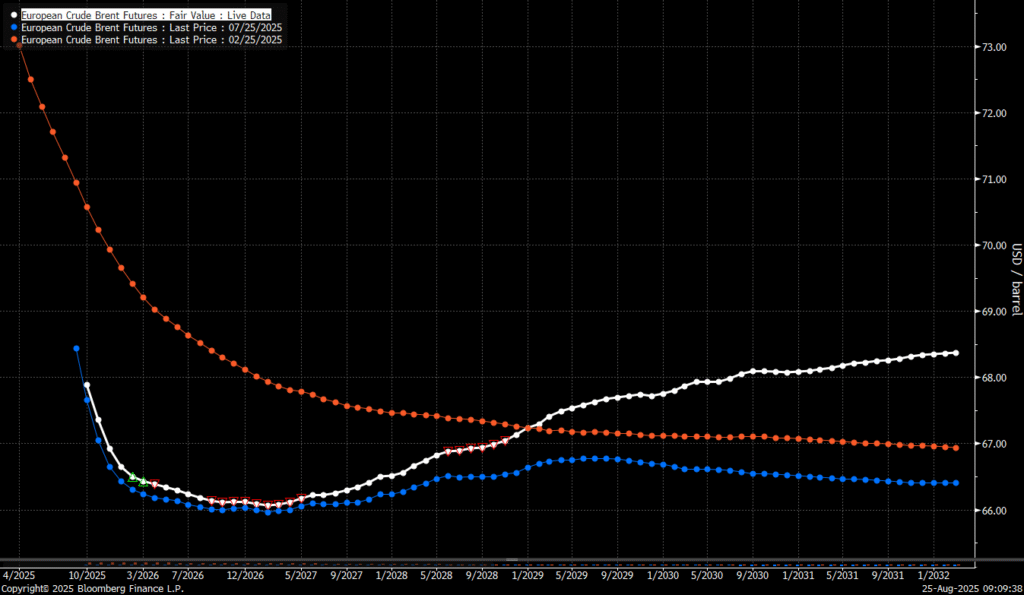
The longer dated Brent crude rolling 36 mth contract has held out well against the sell-off in the front end Brent contract. It still trades at $66/bl and more or less bang in the middle of where it has traded since early May. However, if the EM debt-pain continues to escalate along with dollar gains and US rate hikes then also the longer dated contracts are likely to cave in at some point along with the bearish pressure at the front end of the crude curve.
Counter to the copper market the oil market has OPEC to shore up the market in case of a surplus. But such action may not be immediate and historically there is definitely a very visible relationship between fluctuations in global growth, copper prices and crude oil prices. The current EM weakness and front end crude curve weakness has the clear potential to create a buying opportunity out on the curve if it at some point sells off along with the front. Consumers should definitely utilize such a sell-off if it materializes with lots of bullish factors down the road.
Ch1: Historical crude and copper prices are well related
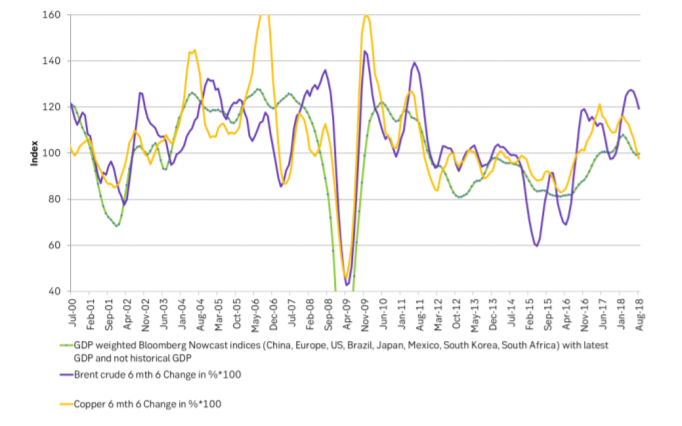
Ch2: Changes in global growth, copper prices and crude prices are visibly related historically
I.e. it is hard to hold out against fluctuations in global growth
Ch3: The rolling 36 mth Brent contract is holding out well against the front end sell-off
Price action contained withing USD 2/b last week. Likely muted today as well with US closed. The Brent November contract is the new front-month contract as of today. It traded in a range of USD 66.37-68.49/b and closed the week up a mere 0.4% at USD 67.48/b. US oil inventory data didn’t make much of an impact on the Brent price last week as it is totally normal for US crude stocks to decline 2.4 mb/d this time of year as data showed. This morning Brent is up a meager 0.5% to USD 67.8/b. It is US Labor day today with US markets closed. Today’s price action is likely going to be muted due to that.

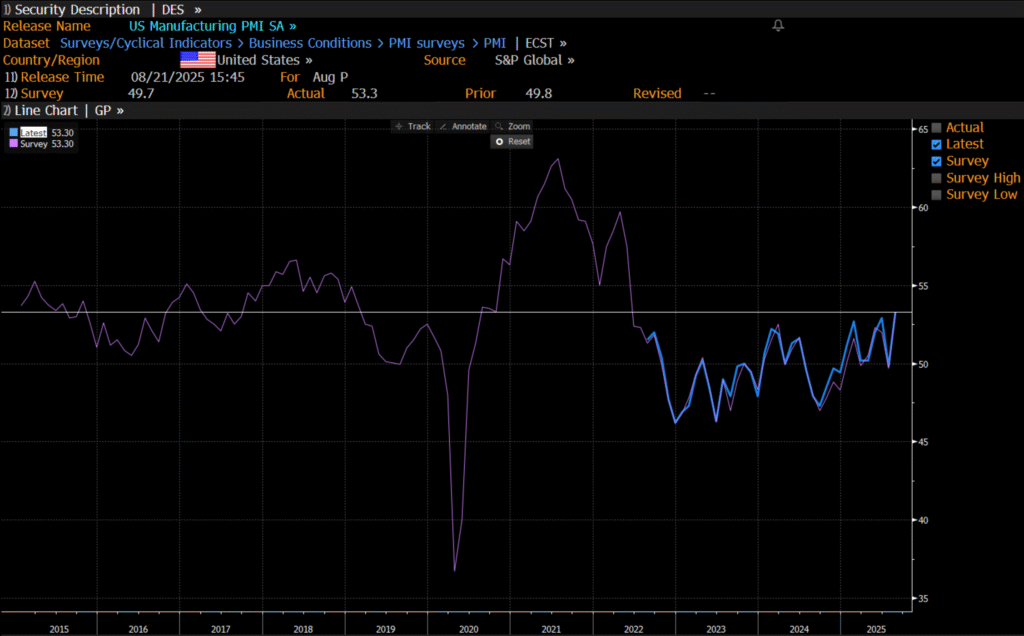
Improving manufacturing readings. China’s manufacturing PMI for August came in at 49.4 versus 49.3 for July. A marginal improvement. The total PMI index ticked up to 50.5 from 50.2 with non-manufacturing also helping it higher. The HCOB Eurozone manufacturing PMI was a disastrous 45.1 last December, but has since then been on a one-way street upwards to its current 50.5 for August. The S&P US manufacturing index jumped to 53.3 in August which was the highest since 2022 (US ISM manufacturing tomorrow). India manufacturing PMI rose further and to 59.3 for August which is the highest since at least 2022.
Are we in for global manufacturing expansion? Would help to explain copper at 10k and resilient oil. JPMorgan global manufacturing index for August is due tomorrow. It was 49.7 in July and has been below the 50-line since February. Looking at the above it looks like a good chance for moving into positive territory for global manufacturing. A copper price of USD 9935/ton, sniffing at the 10k line could be a reflection of that. An oil price holding up fairly well at close to USD 68/b despite the fact that oil balances for Q4-25 and 2026 looks bloated could be another reflection that global manufacturing may be accelerating.
US manufacturing PMI by S&P rose to 53.3 in August. It was published on 21 August, so not at all newly released. But the US ISM manufacturing PMI is due tomorrow and has the potential to follow suite with a strong manufacturing reading.
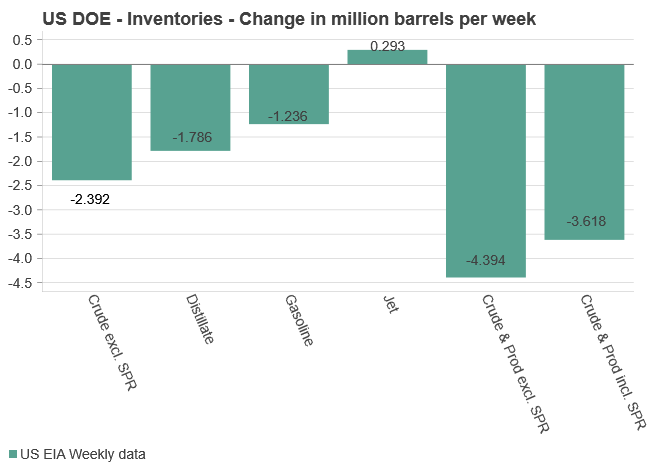
U.S. commercial crude inventories posted another draw last week, falling by 2.4 million barrels to 418.3 million barrels, according to the latest DOE report. Inventories are now 6% below the five-year seasonal average, underlining a persistently tight supply picture as we move into the post-peak demand season.

While the draw was smaller than last week’s 6 million barrel decline, the trend remains consistent with seasonal patterns. Current inventories are still well below the 2015–2022 average of around 449 million barrels.
Gasoline inventories dropped by 1.2 million barrels and are now close to the five-year average. The breakdown showed a modest increase in finished gasoline offset by a decline in blending components – hinting at steady end-user demand.
Diesel inventories saw yet another sharp move, falling by 1.8 million barrels. Stocks are now 15% below the five-year average, pointing to sustained tightness in middle distillates. In fact, diesel remains the most undersupplied segment, with current inventory levels at the very low end of the historical range (see page 3 attached).
Total commercial petroleum inventories – including crude and products but excluding the SPR – fell by 4.4 million barrels on the week, bringing total inventories to approximately 1,259 million barrels. Despite rising refinery utilization at 94.6%, the broader inventory complex remains structurally tight.
On the demand side, the DOE’s ‘products supplied’ metric – a proxy for implied consumption – stayed strong. Total product demand averaged 21.2 million barrels per day over the last four weeks, up 2.5% YoY. Diesel and jet fuel were the standouts, up 7.7% and 1.7%, respectively, while gasoline demand softened slightly, down 1.1% YoY. The figures reflect a still-solid late-summer demand environment, particularly in industrial and freight-related sectors.
Analys
Increasing risk that OPEC+ will unwind the last 1.65 mb/d of cuts when they meet on 7 September
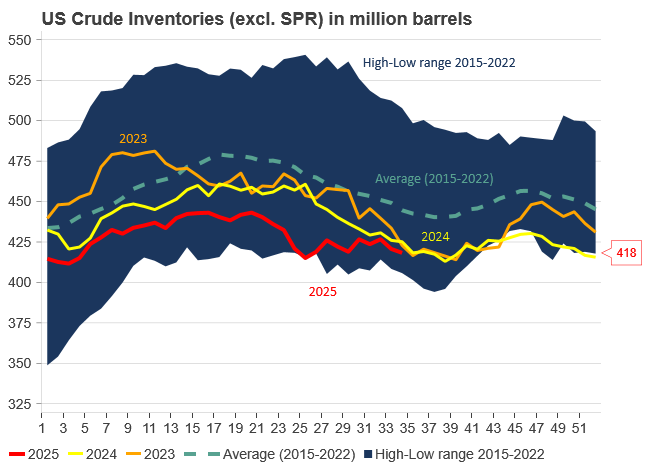
Pushed higher by falling US inventories and positive Jackson Hall signals. Brent crude traded up 2.9% last week to a close of $67.73/b. It traded between $65.3/b and $68.0/b with the low early in the week and the high on Friday. US oil inventory draws together with positive signals from Powel at Jackson Hall signaling that rate cuts are highly likely helped to drive both oil and equities higher.
Ticking higher for a fourth day in a row. Bank holiday in the UK calls for muted European session. Brent crude is inching 0.2% higher this morning to $67.9/b which if it holds will be the fourth trading day in a row with gains. Price action in the European session will likely be quite muted due to bank holiday in the UK today.
OPEC+ is lifting production but we keep waiting for the surplus to show up. The rapid unwinding of voluntary cuts by OPEC+ has placed the market in a waiting position. Waiting for the surplus to emerge and materialize. Waiting for OECD stocks to rise rapidly and visibly. Waiting for US crude and product stocks to rise. Waiting for crude oil forward curves to bend into proper contango. Waiting for increasing supply of medium sour crude from OPEC+ to push sour cracks lower and to push Mid-East sour crudes to increasing discounts to light sweet Brent crude. In anticipation of this the market has traded Brent and WTI crude benchmarks up to $10/b lower than what solely looking at present OECD inventories, US inventories and front-end backwardation would have warranted.
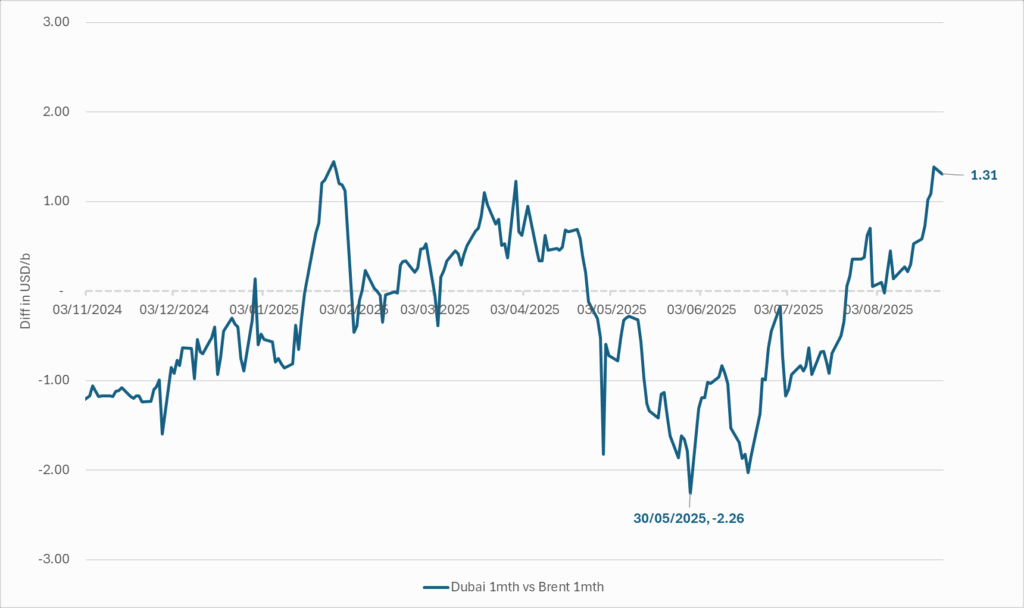
Quite a few pockets of strength. Dubai sour crude is trading at a premium to Brent crude! The front-end of the crude oil curves are still in backwardation. High sulfur fuel oil in ARA has weakened from parity with Brent crude in May, but is still only trading at a discount of $5.6/b to Brent versus a more normal discount of $10/b. ARA middle distillates are trading at a premium of $25/b versus Brent crude versus a more normal $15-20/b. US crude stocks are at the lowest seasonal level since 2018. And lastly, the Dubai sour crude marker is trading a premium to Brent crude (light sweet crude in Europe) as highlighted by Bloomberg this morning. Dubai is normally at a discount to Brent. With more medium sour crude from OPEC+ in general and the Middle East specifically, the widespread and natural expectation has been that Dubai should trade at an increasing discount to Brent. the opposite has happened. Dubai traded at a discount of $2.3/b to Brent in early June. Dubai has since then been on a steady strengthening path versus Brent crude and Dubai is today trading at a premium of $1.3/b. Quite unusual in general but especially so now that OPEC+ is supposed to produce more.
This makes the upcoming OPEC+ meeting on 7 September even more of a thrill. At stake is the next and last layer of 1.65 mb/d of voluntary cuts to unwind. The market described above shows pockets of strength blinking here and there. This clearly increases the chance that OPEC+ decides to unwind the remaining 1.65 mb/d of voluntary cuts when they meet on 7 September to discuss production in October. Though maybe they split it over two or three months of unwind. After that the group can start again with a clean slate and discuss OPEC+ wide cuts rather than voluntary cuts by a sub-group. That paves the way for OPEC+ wide cuts into Q1-26 where a large surplus is projected unless the group kicks in with cuts.
The Dubai medium sour crude oil marker usually trades at a discount to Brent crude. More oil from the Middle East as they unwind cuts should make that discount to Brent crude even more pronounced. Dubai has instead traded steadily stronger versus Brent since late May.
The Brent crude oil forward curve (latest in white) keeps stuck in backwardation at the front end of the curve. I.e. it is still a tight crude oil market at present. The smile-effect is the market anticipation of surplus down the road.

Manufacturing PMIs ticking higher lends support to both copper and oil

Ombytliga elpriser på elmarknaden

Silverpriset når 40 USD, högsta sedan 2011

Nytt produktionsrekord av olja i USA, högsta efterfrågan på 20 år
Crude stocks fall again – diesel tightness persists

Omgående mångmiljardfiasko för Equinors satsning på Ørsted och vindkraft

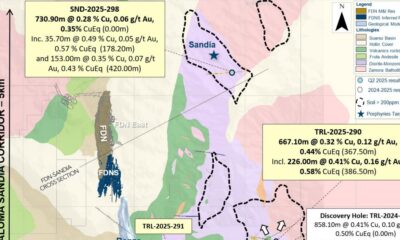
Lundin Gold hittar ny koppar-guld-fyndighet vid Fruta del Norte-gruvan

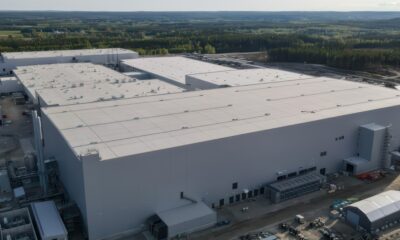
Meta bygger ett AI-datacenter på 5 GW och 2,25 GW gaskraftverk

Guld stiger till över 3500 USD på osäkerhet i världen
What OPEC+ is doing, what it is saying and what we are hearing
-
 Nyheter3 veckor sedan
Omgående mångmiljardfiasko för Equinors satsning på Ørsted och vindkraft
-
 Nyheter4 veckor sedan
Lundin Gold hittar ny koppar-guld-fyndighet vid Fruta del Norte-gruvan
-
 Nyheter2 veckor sedan
Meta bygger ett AI-datacenter på 5 GW och 2,25 GW gaskraftverk
-
 Nyheter4 veckor sedan
Guld stiger till över 3500 USD på osäkerhet i världen
-
Analys3 veckor sedan
What OPEC+ is doing, what it is saying and what we are hearing
-

 Nyheter4 veckor sedan
Alkane Resources och Mandalay Resources har gått samman, aktör inom guld och antimon
-
 Nyheter2 veckor sedan
Aker BP gör ett av Norges största oljefynd på ett decennium, stärker resurserna i Yggdrasilområdet
-
 Nyheter4 veckor sedan
Lyten, tillverkare av litium-svavelbatterier, tar över Northvolts tillgångar i Sverige och Tyskland