

Analys
Crude oil higher as Hurricanes disrupt crude supply rather than crude demand (refinery processing of crude)

 Crude oil comment – Crude oil higher as Hurricanes disrupt crude supply rather than crude demand (refinery processing of crude)
All since the end of July we have seen Brent crude trading fairly range bound between $50/b and $53.64/b. This week it broke upwards out of this trend. Brent crude hit an intraday low of $50.58/b last Wednesday on the fear that Hurricane Harvey would disrupt U.S. Gulf refineries’ consumption of crude oil for a lengthy period of time. I.e. lower refinery activity would give lower crude consumption and thus lower crude prices. When refineries gave signals that damage was not too great and restarts were on the table then Brent crude rose back up and then continued higher.
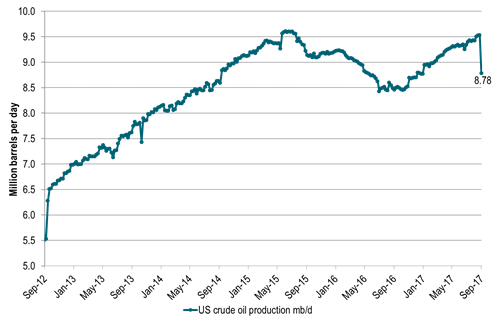
While the fear last week was for reduced oil processing by refineries due to hurricane Harvey, the coin has now flipped. Now the concern is that this may be a heavy hurricane season with the risk of substantial disruptions to crude oil production in the Gulf of Mexico. The US EIA yesterday reported that US crude oil production last week was down 749 kb/d WoW to 8,781 kb/d which is the lowest since December last year.
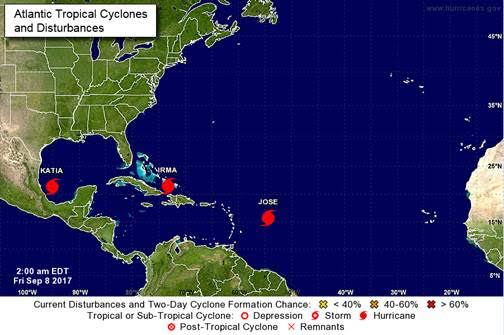
Following Harvey we now have Katia, Irma and Jose queuing up with Irma of course getting most attention as it leaves devastation in its trail as it heads for Florida. What we have seen of hurricanes so far this season may of course not be a good predictor for the rest of the hurricane season but it still setts the mind to expect more of the same. I.e. potentially more disruptions of supply.
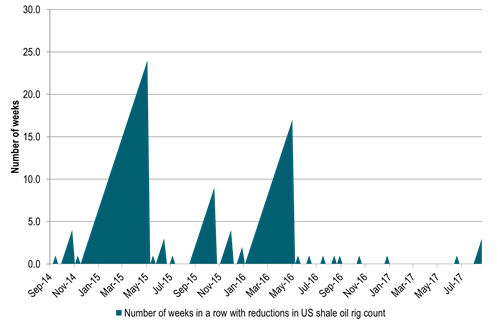
The take from the sell-off down to $50.58/b last week is that there is little risk to the downside of $50/b at the moment. The Saudi oil put is firmly in place. Cutting exports to 6.6 mb/d in August (lowest since 2011), lifting official selling prices for all grades for October delivery while stating that Saudi Arabia goes full ahead for the Aramco IPO in 2018. They are not dropping the ball anytime soon. In addition we have seen the implied US shale oil rig count declining three weeks in a row now for the first time since May 2016.
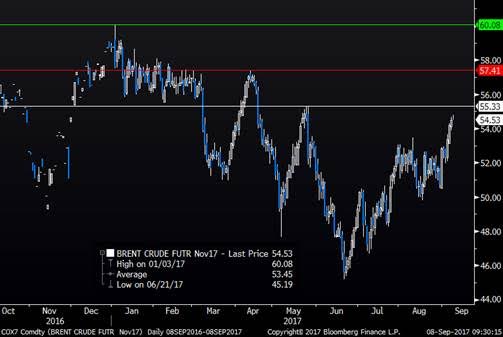
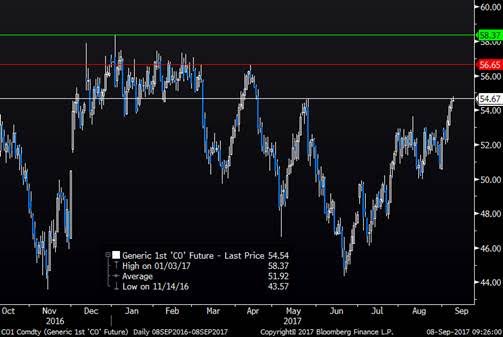
On the upside price action the market will now look at technical references. I.e. highs from earlier in 2017 both for the Brent November contract as well as for the rolling 1mth Brent contract. For the November contract we have $55.33/b (25th May), $57.41/b (12th April) and then $60.08/b (3rd Jan). In references to historical values for the front end rolling Brent contract we comparably have $54.67/b (25th May, but already reached yesterday), $56.65/b (12th April) and then $58.37/b (3rd Jan).
The ball is definitely in the court of the bulls at the moment and the price action is looking towards earlier highs this year. However, when we look forward towards 2018 we do have concerns for the global oil market balance.
We expect US crude and NGL production growth to be very strong with lots of drilled but uncompleted wells ready to be completed. The declining drilling rig count right now is thus more a bullish sentiment driver than having a strong fundamental value. Combined with a still high level of commissioning of legacy non-OPEC crude oil production in 2018 we foresee the need for production management by OPEC+ all through 2018.
Thus bullish price moves this autumn towards the higher end of the $50ies/b should be utilized for those who need to hedge the downside price risk for 2018. When the Aramco IPO is done or if OPEC+ falls apart there is definitely downside price risk on the table in 2018. We must not forget that the current market tightness with declining oil inventories is as of now artificially managed by OPEC+. If it had not been for OPEC+ we would have been running a surplus.
This evening we again have the weekly US rig count data at 19.00 CET. We expect to see yet another week of declining US shale oil rig count. Sentiment wise it should help Brent crude to take out highs from earlier in 2017.
Ch1: Hurricane Harvey is taking out supply, not just demand
Ch2: Three weeks in a row of declining US shale oil rig count (implied)
Now three weeks in a row for the first time since May 2016
Ch3: Brent crude goal One: $55.33/b
Brent crude November contract price references from earlier in 2017
$55.33/b highlighted as next in line to reach for the Nov Brent contract
Ch4: Brent crude goal two and three: $56.65/b and then $58.37/b
Brent crude rolling front month price references from earlier in 2017
Bulls eying high of the year from Jan 3rd at $58.37/b
Ch5: Three hurricanes now in action
Is this what we should expect for the rest of the hurricane season?
More dissruptions to come all through the season?
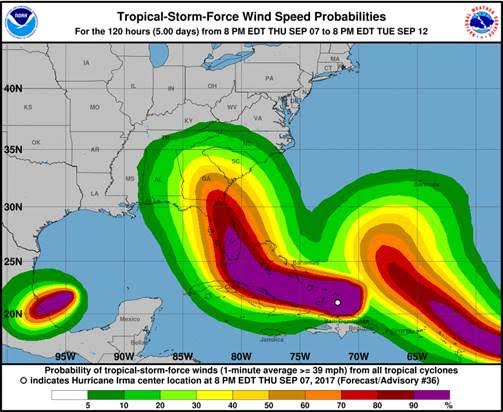
Ch6: With Irma soon to make landfall but with not too much impact on oil infrastructure
Kind regards
Bjarne Schieldrop
Chief analyst, Commodities
SEB Markets
Merchant Banking
Brent crude is essentially flat on the week, but after a volatile ride. Prices started Monday near USD 65.5/bl, climbed steadily to a mid-week high of USD 67.8/bl on Wednesday evening, before falling sharply – losing about USD 2/bl during Thursday’s session.

Brent is currently trading around USD 65.8/bl, right back where it began. The volatility reflects the market’s ongoing struggle to balance growing surplus risks against persistent geopolitical uncertainty and resilient refined product margins. Thursday’s slide snapped a three-day rally and came largely in response to a string of bearish signals, most notably from the IEA’s updated short-term outlook.
The IEA now projects record global oversupply in 2026, reinforcing concerns flagged earlier by the U.S. EIA, which already sees inventories building this quarter. The forecast comes just days after OPEC+ confirmed it will continue returning idle barrels to the market in October – albeit at a slower pace of +137,000 bl/d. While modest, the move underscores a steady push to reclaim market share and adds to supply-side pressure into year-end.
Thursday’s price drop also followed geopolitical incidences: Israeli airstrikes reportedly targeted Hamas leadership in Doha, while Russian drones crossed into Polish airspace – events that initially sent crude higher as traders covered short positions.
Yet, sentiment remains broadly cautious. Strong refining margins and low inventories at key pricing hubs like Europe continue to support the downside. Chinese stockpiling of discounted Russian barrels and tightness in refined product markets – especially diesel – are also lending support.
On the demand side, the IEA revised up its 2025 global demand growth forecast by 60,000 bl/d to 740,000 bl/d YoY, while leaving 2026 unchanged at 698,000 bl/d. Interestingly, the agency also signaled that its next long-term report could show global oil demand rising through 2050.
Meanwhile, OPEC offered a contrasting view in its latest Monthly Oil Market Report, maintaining expectations for a supply deficit both this year and next, even as its members raise output. The group kept its demand growth estimates for 2025 and 2026 unchanged at 1.29 million bl/d and 1.38 million bl/d, respectively.
We continue to watch whether the bearish supply outlook will outweigh geopolitical risk, and if Brent can continue to find support above USD 65/bl – a level increasingly seen as a soft floor for OPEC+ policy.
Brent crude makes some gains as Israel’s attack on Hamas in Qatar rattles markets. Brent crude spiked to a high of USD 67.38/b yesterday as Israel made a strike on Hamas in Qatar. But it wasn’t able to hold on to that level and only closed up 0.6% in the end at USD 66.39/b. This morning it is starting on the up with a gain of 0.9% at USD 67/b. Still rattled by Israel’s attack on Hamas in Qatar yesterday. Brent is getting some help on the margin this morning with Asian equities higher and copper gaining half a percent. But the dark cloud of surplus ahead is nonetheless hanging over the market with Brent trading two dollar lower than last Tuesday.

Geopolitical risk premiums in oil rarely lasts long unless actual supply disruption kicks in. While Israel’s attack on Hamas in Qatar is shocking, the geopolitical risk lifting crude oil yesterday and this morning is unlikely to last very long as such geopolitical risk premiums usually do not last long unless real disruption kicks in.
US API data yesterday indicated a US crude and product stock build last week of 3.1 mb. The US API last evening released partial US oil inventory data indicating that US crude stocks rose 1.3 mb and middle distillates rose 1.5 mb while gasoline rose 0.3 mb. In total a bit more than 3 mb increase. US crude and product stocks usually rise around 1 mb per week this time of year. So US commercial crude and product stock rose 2 mb over the past week adjusted for the seasonal norm. Official and complete data are due today at 16:30.
A 2 mb/week seasonally adj. US stock build implies a 1 – 1.4 mb/d global surplus if it is persistent. Assume that if the global oil market is running a surplus then some 20% to 30% of that surplus ends up in US commercial inventories. A 2 mb seasonally adjusted inventory build equals 286 kb/d. Divide by 0.2 to 0.3 and we get an implied global surplus of 950 kb/d to 1430 kb/d. A 2 mb/week seasonally adjusted build in US oil inventories is close to noise unless it is a persistent pattern every week.
US IEA STEO oil report: Robust surplus ahead and Brent averaging USD 51/b in 2026. The US EIA yesterday released its monthly STEO oil report. It projected a large and persistent surplus ahead. It estimates a global surplus of 2.2 m/d from September to December this year. A 2.4 mb/d surplus in Q1-26 and an average surplus for 2026 of 1.6 mb/d resulting in an average Brent crude oil price of USD 51/b next year. And that includes an assumption where OPEC crude oil production only averages 27.8 mb/d in 2026 versus 27.0 mb/d in 2024 and 28.6 mb/d in August.
Brent will feel the bear-pressure once US/OECD stocks starts visible build. In the meanwhile the oil market sits waiting for this projected surplus to materialize in US and OECD inventories. Once they visibly starts to build on a consistent basis, then Brent crude will likely quickly lose altitude. And unless some unforeseen supply disruption kicks in, it is bound to happen.
US IEA STEO September report. In total not much different than it was in January

US IEA STEO September report. US crude oil production contracting in 2026, but NGLs still growing. Close to zero net liquids growth in total.

Brent crude touched a low of USD 65.07 per barrel on Friday evening before rebounding sharply by USD 2 to USD 67.04 by mid-day Monday. The rally came despite confirmation from OPEC+ of a measured production increase starting next month. Prices have since eased slightly, down USD 0.6 to around USD 66.50 this morning, as the market evaluates the group’s policy, evolving demand signals, and rising geopolitical tension.
On Sunday, OPEC+ approved a 137,000 barrels-per-day increase in collective output beginning in October – a cautious first step in unwinding the final tranche of 1.66 million barrels per day in voluntary cuts, originally set to remain off the market through end-2026. Further adjustments will depend on ”evolving market conditions.” While the pace is modest – especially relative to prior monthly hikes – the signal is clear: OPEC+ is methodically re-entering the market with a strategic intent to reclaim lost market share, rather than defend high prices.
This shift in tone comes as Saudi Aramco also trimmed its official selling prices for Asian buyers, further reinforcing the group’s tilt toward a volume-over-price strategy. We see this as a clear message: OPEC+ intends to expand market share through steady production increases, and a lower price point – potentially below USD 65/b – may be necessary to stimulate demand and crowd out higher-cost competitors, particularly U.S. shale, where average break-evens remain around WTI USD 50/b.
Despite the policy shift, oil prices have held firm. Brent is still hovering near USD 66.50/b, supported by low U.S. and OECD inventories, where crude and product stocks remain well below seasonal norms, keeping front-month backwardation intact. Also, the low inventory levels at key pricing hubs in Europe and continued stockpiling by Chinese refiners are also lending resilience to prices. Tightness in refined product markets, especially diesel, has further underpinned this.
Geopolitical developments are also injecting a slight risk premium. Over the weekend, Russia launched its most intense air assault on Kyiv since the war began, damaging central government infrastructure. This escalation comes as the EU weighs fresh sanctions on Russian oil trade and financial institutions. Several European leaders are expected in Washington this week to coordinate on Ukraine strategy – and the prospect of tighter restrictions on Russian crude could re-emerge as a price stabilizer.
In Asia, China’s crude oil imports rose to 49.5 million tons in August, up 0.8% YoY. The rise coincides with increased Chinese interest in Russian Urals, offered at a discount during falling Indian demand. Chinese refiners appear to be capitalizing on this arbitrage while avoiding direct exposure to U.S. trade penalties.
Going forward, our attention turns to the data calendar. The EIA’s STEO is due today (Tuesday), followed by the IEA and OPEC monthly oil market reports on Thursday. With a pending supply surplus projected during the fourth quarter and into 2026, markets will dissect these updates for any changes in demand assumptions and non-OPEC supply growth. Stay tuned!


Aktier i guldbolag laggar priset på guld
Volatile but going nowhere. Brent crude circles USD 66 as market weighs surplus vs risk

Guld når sin högsta nivå någonsin, nu även justerat för inflation

Mahvie Minerals i en guldtrend

Det kan bli brist på sand, grus och sten i Sverige och grannländerna

Meta bygger ett AI-datacenter på 5 GW och 2,25 GW gaskraftverk
Aker BP gör ett av Norges största oljefynd på ett decennium, stärker resurserna i Yggdrasilområdet
Brent sideways on sanctions and peace talks

Ett samtal om koppar, kaffe och spannmål
Sommarens torka kan ge högre elpriser i höst
-
 Nyheter3 veckor sedan
Meta bygger ett AI-datacenter på 5 GW och 2,25 GW gaskraftverk
-
 Nyheter3 veckor sedan
Aker BP gör ett av Norges största oljefynd på ett decennium, stärker resurserna i Yggdrasilområdet
-
Analys4 veckor sedan
Brent sideways on sanctions and peace talks
-
 Nyheter4 veckor sedan
Ett samtal om koppar, kaffe och spannmål
-
 Nyheter3 veckor sedan
Sommarens torka kan ge högre elpriser i höst
-
Analys3 veckor sedan
Brent edges higher as India–Russia oil trade draws U.S. ire and Powell takes the stage at Jackson Hole
-

 Nyheter3 veckor sedan
Mahvie Minerals är verksamt i guldrikt område i Finland
-
Analys3 veckor sedan
Increasing risk that OPEC+ will unwind the last 1.65 mb/d of cuts when they meet on 7 September