

Analys
Brent crude in non-USD as expensive as in 2011 to 2014

 In order to reach a consensus and keep the OPEC+ group united the latest proposal on the table for the upcoming meeting of OPEC+ on Friday and Saturday in Vienna is a modest increase of 300 to 600 k bl/d in 2H1. The proposal before the weekend by Saudi Arabia and Russia was an increase of 1.5 m bl/d. What is most imperative in our view is that the group is adaptive to market conditions going forward. Uncertainties on both the supply side and the demand side are significant. In the eyes of emerging markets (but also Norway) the oil price in local currency is today as high as it was when Brent traded at $110/bl from 2011 to 2014 with demand destruction naturally setting in at such a cost level. Rapidly escalating US – China trade tension is adding to global growth headwinds. With large uncertainties on the supply side the group should stay ready to increase production in order to avoid escalating pain for the consumers.

Bjarne Schieldrop, Chief analyst commodities
It turns out that Donald Trump’s tweets over the past months that “OPEC is at it again creating artificially high prices” are not just a whim. It is actually one of his core views going back more than 30 years. US lawmakers have tried to pass the NOPEC bill (“Non Oil Producing and Exporting Cartels Act”) for years. It will allow the US Government to sue OPEC for oil market manipulation. Earlier attempts to pass the bill have been blocked by President vetoes. Donald is however one of the big supporters of the bill. This bill is now rolling towards OPEC+ and the group certainly do not want to stir the pot by holding back to much oil creating too high prices.
Price action – Rebounding 2.6% ydy as OPEC+ seen to aim for modest compromise. Sinking back on trade war today
Following Friday’s 3.3% sharp sell-off on the back of Saudi Arabia’s comment that an increase in production is “inevitable” the Brent price yesterday rebounded 2.6% to $75.34/bl as the group was seen to aim for a modest compromise. An increase of 1.5 m bl/d has earlier been seen as the proposal by Russia and Saudi Arabia while the latest proposal said to be discussed is an output hike of 300 to 600 k bl/d. This helped the Brent price to rebound yesterday. This morning Brent is pulling back 0.6% to $74.9/bl following the queue of the sharp sell-off in Asian equities on fear that Donald Trump will add tariffs on an additional $200 billion worth of Chinese goods exported to the US.
Aiming for a compromise but adaption to market conditions will be key
In order to hold the OPEC+ group together and appease Iran, Iraq and Venezuela who have strongly opposed any increase in production the group now seems to aim for a compromise of a modest increase of 300 to 600 k bl/d at the upcoming meeting on Friday and Saturday this week. It has all the time been argued that any revival in production will be gradual and adapted to market conditions. To be reactive and adaptive to market conditions seems to be even more important now due to significant uncertainties for both supply and demand.
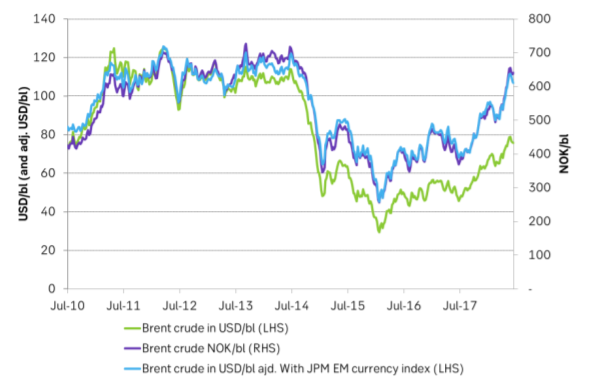
The global economy ex the US has been cooling since the start of the year and the US – China trade tension is escalating rapidly with an additional $200 billion worth of exports to the US at risk of getting tariffs. This is not good for global growth and for oil demand growth. The strengthening of the USD, especially versus emerging markets is bad both for global growth and for oil demand growth. An oil price of $75/bl seems fairly modest, neither too hot nor too cold. However, if we measure it in local currencies like the Norwegian krone the oil price now is just as high as it was during the period 2011 to 2014 when Brent crude was trading at around $110/bl. The same goes if we take JPM’s EM currency index and adjust Brent crude prices from July 2010. So in the eyes of the emerging market consumers the oil price today is just as expensive as it was during the 2011 to 2014 period. That means that demand destruction is naturally setting in at these prices for the EM’s. And, since EM’s holds the lion’s share of the world’s oil demand growth this is probably not insignificant. It is thus highly important that OPEC+ is sensitive, adaptive and reactive to oil demand conditions going forward.
The supply side is of course just as challenging to gauge as production in Venezuela is declining rapidly but could as well disrupt entirely and unpredictably. US sanctions towards Iran, a sharp decline in Nigeria’s production in June and increasing violence in Libya where the destruction of two of five crude storage tanks at Ras Lanuf“ may take years” to rebuild are all contributing to a highly unpredictable supply.
For a large share of the world’s consumers the oil price is already as high as it was during 2011 to 2014 and OPEC+ does definitely not want to risk that the oil price moves yet higher as the world economy is already facing challenges. Thus adaptivity to market conditions must be the most imperative goal of OPEC+ at the upcoming meeting this week as the goal of getting OECD inventories down to the rolling five year average has been reached. Thus aim for moderate increase in 2H18, but increase more if needed.
Ch1: The oil price for emerging markets is just as high today as it was in 2011 to 2014
Thus demand destruction is naturally setting in at such a price level with weakness in demand as a result
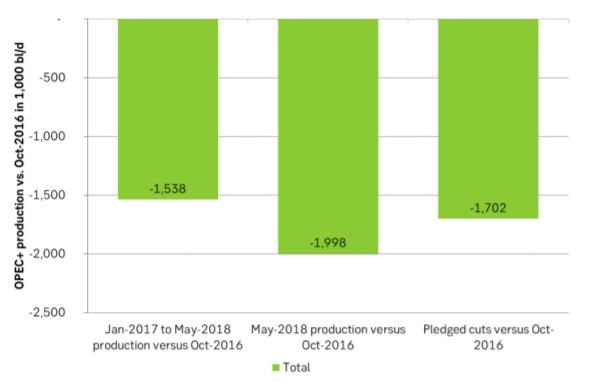
Ch2: OPEC+ produced 2 m bl/d less in May than it did in October 2016
On average since the start of 2017 the group has delivered net cuts of 1.5 m bl/d and slightly less than the pledged 1.7 m bl/d
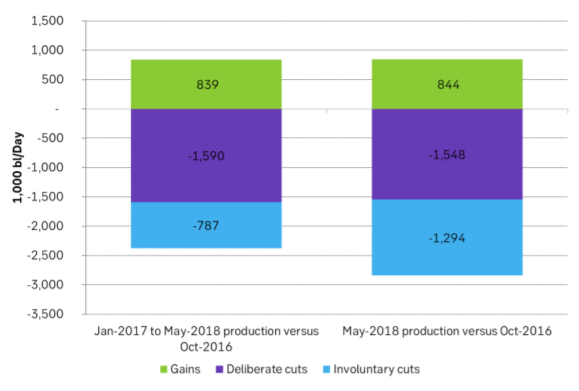
Ch3: But deliberate cuts were only 1.55 m bl/d while involuntary cuts amounted to 1.3 m bl/d
Some rebound but not much. Brent crude rebounded 1.5% yesterday to $65.47/b. This morning it is inching 0.2% up to $65.6/b. The lowest close last week was on Thursday at $64.11/b.

The curve structure is almost as week as it was before the weekend. The rebound we now have gotten post the message from OPEC+ over the weekend is to a large degree a rebound along the curve rather than much strengthening at the front-end of the curve. That part of the curve structure is almost as weak as it was last Thursday.
We are still on a weakening path. The message from OPEC+ over the weekend was we are still on a weakening path with rising supply from the group. It is just not as rapidly weakening as was feared ahead of the weekend when a quota hike of 500 kb/d/mth for November was discussed.
The Brent curve is on its way to full contango with Brent dipping into the $50ies/b. Thus the ongoing weakening we have had in the crude curve since the start of the year, and especially since early June, will continue until the Brent crude oil forward curve is in full contango along with visibly rising US and OECD oil inventories. The front-month Brent contract will then flip down towards the $60/b-line and below into the $50ies/b.
At what point will OPEC+ turn to cuts? The big question then becomes: When will OPEC+ turn around to make some cuts? At what (price) point will they choose to stabilize the market? Because for sure they will. Higher oil inventories, some more shedding of drilling rigs in US shale and Brent into the 50ies somewhere is probably where the group will step in.
There is nothing we have seen from the group so far which indicates that they will close their eyes, let the world drown in oil and the oil price crash to $40/b or below.
The message from OPEC+ is also about balance and stability. The world won’t drown in oil in 2026. The message from the group as far as we manage to interpret it is twofold: 1) Taking back market share which requires a lower price for non-OPEC+ to back off a bit, and 2) Oil market stability and balance. It is not just about 1. Thus fretting about how we are all going to drown in oil in 2026 is totally off the mark by just focusing on point 1.
When to buy cal 2026? Before Christmas when Brent hits $55/b and before OPEC+ holds its last meeting of the year which is likely to be in early December.
Brent crude oil prices have rebounded a bit along the forward curve. Not much strengthening in the structure of the curve. The front-end backwardation is not much stronger today than on its weakest level so far this year which was on Thursday last week.

The front-end backwardation fell to its weakest level so far this year on Thursday last week. A slight pickup yesterday and today, but still very close to the weakest year to date. More oil from OPEC+ in the coming months and softer demand and rising inventories. We are heading for yet softer levels.

Down to the lowest since early May. Brent crude has fallen sharply the latest four days. It closed at USD 64.11/b yesterday which is the lowest since early May. It is staging a 1.3% rebound this morning along with gains in both equities and industrial metals with an added touch of support from a softer USD on top.
What stands out the most to us this week is the collapse in the Dubai one to three months time-spread.
Dubai is medium sour crude. OPEC+ is in general medium sour crude production. Asian refineries are predominantly designed to process medium sour crude. So Dubai is the real measure of the balance between OPEC+ holding back or not versus Asian oil demand for consumption and stock building.
A sharp weakening of the front-end of the Dubai curve. The front-end of the Dubai crude curve has been holding out very solidly throughout this summer while the front-end of the Brent and WTI curves have been steadily softening. But the strength in the Dubai curve in our view was carrying the crude oil market in general. A source of strength in the crude oil market. The core of the strength.
The now finally sharp decline of the front-end of the Dubai crude curve is thus a strong shift. Weakness in the Dubai crude marker is weakness in the core of the oil market. The core which has helped to hold the oil market elevated.
Facts supports the weakening. Add in facts of Iraq lifting production from Kurdistan through Turkey. Saudi Arabia lifting production to 10 mb/d in September (normal production level) and lifting exports as well as domestic demand for oil for power for air con is fading along with summer heat. Add also in counter seasonal rise in US crude and product stocks last week. US oil stocks usually decline by 1.3 mb/week this time of year. Last week they instead rose 6.4 mb/week (+7.2 mb if including SPR). Total US commercial oil stocks are now only 2.1 mb below the 2015-19 seasonal average. US oil stocks normally decline from now to Christmas. If they instead continue to rise, then it will be strongly counter seasonal rise and will create a very strong bearish pressure on oil prices.
Will OPEC+ lift its voluntary quotas by zero, 137 kb/d, 500 kb/d or 1.5 mb/d? On Sunday of course OPEC+ will decide on how much to unwind of the remaining 1.5 mb/d of voluntary quotas for November. Will it be 137 kb/d yet again as for October? Will it be 500 kb/d as was talked about earlier this week? Or will it be a full unwind in one go of 1.5 mb/d? We think most likely now it will be at least 500 kb/d and possibly a full unwind. We discussed this in a not earlier this week: ”500 kb/d of voluntary quotas in October. But a full unwind of 1.5 mb/d”
The strength in the front-end of the Dubai curve held out through summer while Brent and WTI curve structures weakened steadily. That core strength helped to keep flat crude oil prices elevated close to the 70-line. Now also the Dubai curve has given in.

Brent crude oil forward curves

Total US commercial stocks now close to normal. Counter seasonal rise last week. Rest of year?

Total US crude and product stocks on a steady trend higher.

Analys
OPEC+ will likely unwind 500 kb/d of voluntary quotas in October. But a full unwind of 1.5 mb/d in one go could be in the cards
Down to mid-60ies as Iraq lifts production while Saudi may be tired of voluntary cut frugality. The Brent December contract dropped 1.6% yesterday to USD 66.03/b. This morning it is down another 0.3% to USD 65.8/b. The drop in the price came on the back of the combined news that Iraq has resumed 190 kb/d of production in Kurdistan with exports through Turkey while OPEC+ delegates send signals that the group will unwind the remaining 1.65 mb/d (less the 137 kb/d in October) of voluntary cuts at a pace of 500 kb/d per month pace.
Signals of accelerated unwind and Iraqi increase may be connected. Russia, Kazakhstan and Iraq were main offenders versus the voluntary quotas they had agreed to follow. Russia had a production ’debt’ (cumulative overproduction versus quota) of close to 90 mb in March this year while Kazakhstan had a ’debt’ of about 60 mb and the same for Iraq. This apparently made Saudi Arabia angry this spring. Why should Saudi Arabia hold back if the other voluntary cutters were just freeriding? Thus the sudden rapid unwinding of voluntary cuts. That is at least one angle of explanations for the accelerated unwinding.
If the offenders with production debts then refrained from lifting production as the voluntary cuts were rapidly unwinded, then they could ’pay back’ their ’debts’ as they would under-produce versus the new and steadily higher quotas.
Forget about Kazakhstan. Its production was just too far above the quotas with no hope that the country would hold back production due to cross-ownership of oil assets by international oil companies. But Russia and Iraq should be able to do it.
Iraqi cumulative overproduction versus quotas could reach 85-90 mb in October. Iraq has however steadily continued to overproduce by 3-5 mb per month. In July its new and gradually higher quota came close to equal with a cumulative overproduction of only 0.6 mb that month. In August again however its production had an overshoot of 100 kb/d or 3.1 mb for the month. Its cumulative production debt had then risen to close to 80 mb. We don’t know for September yet. But looking at October we now know that its production will likely average close to 4.5 mb/d due to the revival of 190 kb/d of production in Kurdistan. Its quota however will only be 4.24 mb/d. Its overproduction in October will thus likely be around 250 kb/d above its quota with its production debt rising another 7-8 mb to a total of close to 90 mb.
Again, why should Saudi Arabia be frugal while Iraq is freeriding. Better to get rid of the voluntary quotas as quickly as possible and then start all over with clean sheets.
Unwinding the remaining 1.513 mb/d in one go in October? If OPEC+ unwinds the remaining 1.513 mb/d of voluntary cuts in one big go in October, then Iraq’s quota will be around 4.4 mb/d for October versus its likely production of close to 4.5 mb/d for the coming month..
OPEC+ should thus unwind the remaining 1.513 mb/d (1.65 – 0.137 mb/d) in one go for October in order for the quota of Iraq to be able to keep track with Iraq’s actual production increase.
October 5 will show how it plays out. But a quota unwind of at least 500 kb/d for Oct seems likely. An overall increase of at least 500 kb/d in the voluntary quota for October looks likely. But it could be the whole 1.513 mb/d in one go. If the increase in the quota is ’only’ 500 kb/d then Iraqi cumulative production will still rise by 5.7 mb to a total of 85 mb in October.
Iraqi production debt versus quotas will likely rise by 5.7 mb in October if OPEC+ only lifts the overall quota by 500 kb/d in October. Here assuming historical production debt did not rise in September. That Iraq lifts its production by 190 kb/d in October to 4.47 mb/d (August level + 190 kb/d) and that OPEC+ unwinds 500 kb/d of the remining quotas in October when they decide on this on 5 October.


Teck Resources kan förse Nordamerika och kanske hela G7 med all germanium som behövs

Leading Edge Materials är på rätt plats i rätt tid

Oljepriset faller efter ny handelskonflikt mellan USA och Kina

Christian Kopfer kommenterar guld, koppar, olja och stål, samt några råvarubolag

Silver spränger den magiska gränsen, kostar nu över 50 USD per uns

Kinas elproduktion slog nytt rekord i augusti, vilket även kolkraft gjorde

Tyskland har så höga elpriser att företag inte har råd att använda elektricitet

Det stigande guldpriset en utmaning för smyckesköpare

OPEC+ missar produktionsmål, stöder oljepriserna

Ett samtal om guld, olja, fjärrvärme och förnybar energi
-
 Nyheter4 veckor sedan
Kinas elproduktion slog nytt rekord i augusti, vilket även kolkraft gjorde
-
Nyheter4 veckor sedan
Tyskland har så höga elpriser att företag inte har råd att använda elektricitet
-
 Nyheter4 veckor sedan
Det stigande guldpriset en utmaning för smyckesköpare
-
 Nyheter2 veckor sedan
OPEC+ missar produktionsmål, stöder oljepriserna
-
 Nyheter3 veckor sedan
Ett samtal om guld, olja, fjärrvärme och förnybar energi
-
Analys4 veckor sedan
Brent crude ticks higher on tension, but market structure stays soft
-
Analys3 veckor sedan
Are Ukraine’s attacks on Russian energy infrastructure working?
-

 Nyheter1 vecka sedan
Guld nära 4000 USD och silver 50 USD, därför kan de fortsätta stiga