

Analys
A recession is no match for OPEC+

History shows that OPEC cuts work wonderfully. When OPEC acts it changes the market no matter how deep the crisis. Massive 9.7 m b/d in May 2020. Large cuts in Dec 2008. And opposite: No-cuts in 2014 crashed the price. OPEC used to be slow and re-active. Now they are fast and re-active. Latest cut indicates a ”reaction-function” with a floor price of USD 70/b. Price could move lower than that in May, but JMMC meeting on 4 June and full OPEC+ meeting on 5-6 July would then change the course. Fresh cuts now in May will likely drive market into deficit, inventory draws, stronger prices. Sell-offs in May should be a good buying opportunities

Production cuts by OPEC+ do work. They work wonderfully. Deep cuts announced by OPEC in December 2008 made the oil price bottom at USD 33.8/b on Christmas Eve. That is USD 48.3/b adj. for CPI. The oil price then collapsed in 2014 when it became increasingly clear during the autumn that OPEC would NOT defend the oil price with confirmation of no-cuts in December that year. The creation of OPEC+ in the autumn of 2016 then managed to drive the oil price higher despite booming US shale oil production. A massive 9.7 m b/d cut in production in May 2020 onward made the oil price shoot higher after the trough in April 2020.
Historical sequence pattern is first a price-trough, then cuts, then rebound. This history however points to a typical sequence of events. First we have a trough in prices. Then we get cuts by OPEC(+) and then the oil price shoots back up. This probably creates an anticipation by the market of a likewise sequence this time. I.e. that the oil price first is going to head to USD 40/b, then deep cuts by OPEC+ and then the rebound. If we get an ugly recession.
But OPEC+ is faster and much more vigilant today. Historically OPEC met every half year. Assessed the situation and made cuts or no cuts in a very reactive fashion. That always gave the market a long lead-time both in terms of a financial sell-off and a potential physical deterioration before OPEC would react.
But markets are faster today as well with new information spreading to the world almost immediately. Impact of that is both financial and physical. The financial sell-off part is easy to understand. The physical part can be a bit more intricate. Fear itself of a recession can lead to a de-stocking of the oil supply chain where everyone suddenly starts to draw down their local inventories of crude and products with no wish to buy new supplies as demand and prices may be lower down the road. This can then lead to a rapid build-up of crude stocks in the hubs and create a sense of very weak physical demand for oil even if it is still steady.
Deep trough in prices is possible but would not last long. Faster markets and faster OPEC+ action means we could still have a deep trough in prices but they would not last very long. Oil inventories previously had time to build up significantly when OPEC acted slowly. When OPEC then finally made the cuts it would take some time to reverse the inventory build-up. So prices would stay lower for longer. Rapid action by OPEC+ today means that inventories won’t have time to build up to the same degree if everything goes wrong with the economy. Thus leading to much briefer sell-offs and sharper and faster re-bounds.
OPEC+ hasn’t really even started cutting yet. Yes, we have had some cuts announced with 1.5 m b/d reduction starting now in May. But this is only bringing Saudi Arabia’s oil production back to roughly its normal level around 10 m b/d following unusually high production of 11 m b/d in Sep 2022. So OPEC+ has lots of ”dry powder” for further cuts if needed.
OPEC reaction function: ”USD 70/b is the floor”. The most recent announced production cut gave a lot of information. It was announced on 2nd of April and super-fast following the 20th of March when Dated Brent traded to an intraday low of USD 69.27/b.
JMMC on 4 June and OPEC+ meeting on 5-6 July. Will cut if needed. OPEC+ will now spend the month of May to assess the effects of the newest cuts. The Joint Ministerial Monitoring Committee (JMMC) will then meet on 4 June and make a recommendation to the group. If it becomes clear at that time that further cuts are needed then we’ll likely get verbal intervention during June in the run-up to 5-6 July and then fresh cuts if needed.
Oil man Biden wants a price floor of USD 70/b as well. The US wants to rebuild its Strategic Petroleum Reserves (SPR) which now has been drawn down to about 50%. It stated in late 2022 that it wanted to buy if the oil price fell down to USD 67 – 72/b. Reason for this price level is of course that if it falls below that then US shale oil production would/could start to decline with deteriorating energy security for the US. Latest signals from the US administration is that the rebuilding of the SPR could start in Q3-23.
A note on shale oil activity vs. oil price. The US oil rig count has been falling since early December 2022 and has been doing so during a period when the Dated Brent price has been trading around USD 80/b.
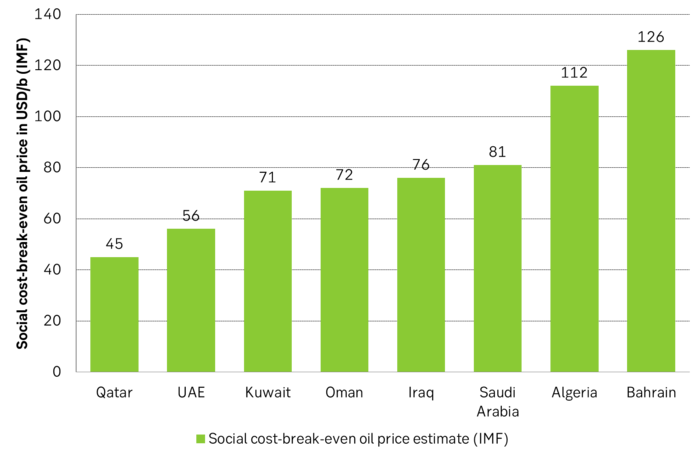
IMF estimated social cost-break-even oil price for the different Middle East countries. As long as US shale oil production is not booming there should be lots of support within OPEC+ to cut production in order to maintain the oil price above USD 70/b. Thus the ”OPEC+ reaction-function” of a USD 70/b floor price. But USD 80/b would even satisfy Saudi Arabia.
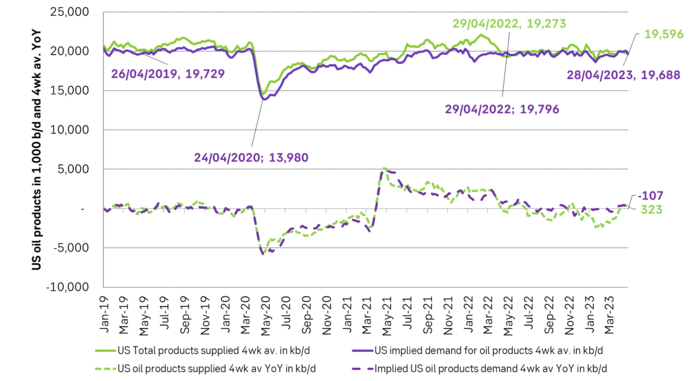
US implied demand and products delivered is holding up nicely YoY and on par with 2019. So far at least. Seen from an aggregated level.
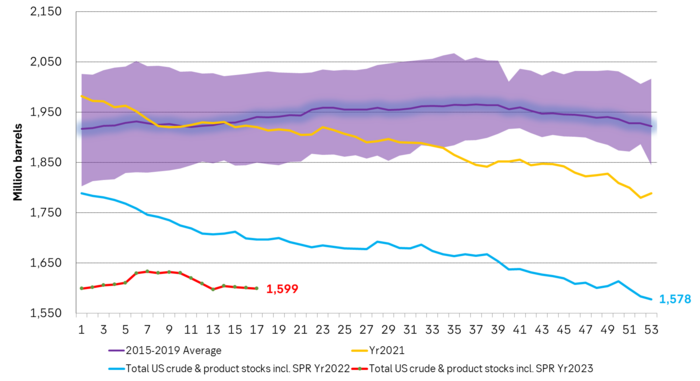
Total US crude and product stocks including SPR. Ticking lower. Could fall faster from May onward due to fresh cuts by OPEC+ of 1.5 m b/d
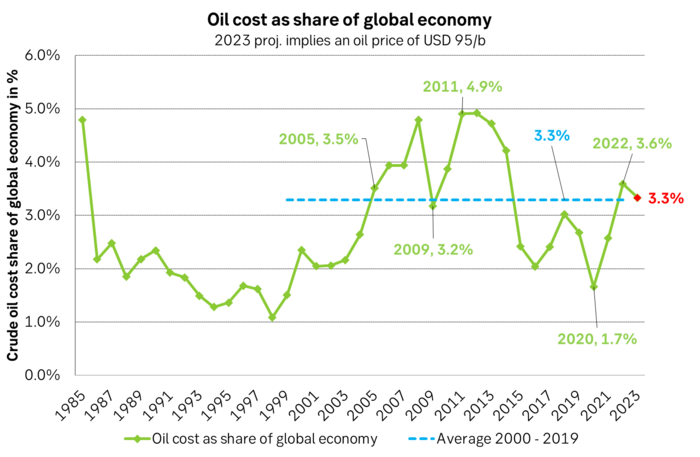
An oil price of USD 95/b in 2023 would place cost of oil to the global economy at 3.3% of Global GDP which is equal to the 2000 – 2019 average.
Some rebound but not much. Brent crude rebounded 1.5% yesterday to $65.47/b. This morning it is inching 0.2% up to $65.6/b. The lowest close last week was on Thursday at $64.11/b.

The curve structure is almost as week as it was before the weekend. The rebound we now have gotten post the message from OPEC+ over the weekend is to a large degree a rebound along the curve rather than much strengthening at the front-end of the curve. That part of the curve structure is almost as weak as it was last Thursday.
We are still on a weakening path. The message from OPEC+ over the weekend was we are still on a weakening path with rising supply from the group. It is just not as rapidly weakening as was feared ahead of the weekend when a quota hike of 500 kb/d/mth for November was discussed.
The Brent curve is on its way to full contango with Brent dipping into the $50ies/b. Thus the ongoing weakening we have had in the crude curve since the start of the year, and especially since early June, will continue until the Brent crude oil forward curve is in full contango along with visibly rising US and OECD oil inventories. The front-month Brent contract will then flip down towards the $60/b-line and below into the $50ies/b.
At what point will OPEC+ turn to cuts? The big question then becomes: When will OPEC+ turn around to make some cuts? At what (price) point will they choose to stabilize the market? Because for sure they will. Higher oil inventories, some more shedding of drilling rigs in US shale and Brent into the 50ies somewhere is probably where the group will step in.
There is nothing we have seen from the group so far which indicates that they will close their eyes, let the world drown in oil and the oil price crash to $40/b or below.
The message from OPEC+ is also about balance and stability. The world won’t drown in oil in 2026. The message from the group as far as we manage to interpret it is twofold: 1) Taking back market share which requires a lower price for non-OPEC+ to back off a bit, and 2) Oil market stability and balance. It is not just about 1. Thus fretting about how we are all going to drown in oil in 2026 is totally off the mark by just focusing on point 1.
When to buy cal 2026? Before Christmas when Brent hits $55/b and before OPEC+ holds its last meeting of the year which is likely to be in early December.
Brent crude oil prices have rebounded a bit along the forward curve. Not much strengthening in the structure of the curve. The front-end backwardation is not much stronger today than on its weakest level so far this year which was on Thursday last week.

The front-end backwardation fell to its weakest level so far this year on Thursday last week. A slight pickup yesterday and today, but still very close to the weakest year to date. More oil from OPEC+ in the coming months and softer demand and rising inventories. We are heading for yet softer levels.

Down to the lowest since early May. Brent crude has fallen sharply the latest four days. It closed at USD 64.11/b yesterday which is the lowest since early May. It is staging a 1.3% rebound this morning along with gains in both equities and industrial metals with an added touch of support from a softer USD on top.
What stands out the most to us this week is the collapse in the Dubai one to three months time-spread.
Dubai is medium sour crude. OPEC+ is in general medium sour crude production. Asian refineries are predominantly designed to process medium sour crude. So Dubai is the real measure of the balance between OPEC+ holding back or not versus Asian oil demand for consumption and stock building.
A sharp weakening of the front-end of the Dubai curve. The front-end of the Dubai crude curve has been holding out very solidly throughout this summer while the front-end of the Brent and WTI curves have been steadily softening. But the strength in the Dubai curve in our view was carrying the crude oil market in general. A source of strength in the crude oil market. The core of the strength.
The now finally sharp decline of the front-end of the Dubai crude curve is thus a strong shift. Weakness in the Dubai crude marker is weakness in the core of the oil market. The core which has helped to hold the oil market elevated.
Facts supports the weakening. Add in facts of Iraq lifting production from Kurdistan through Turkey. Saudi Arabia lifting production to 10 mb/d in September (normal production level) and lifting exports as well as domestic demand for oil for power for air con is fading along with summer heat. Add also in counter seasonal rise in US crude and product stocks last week. US oil stocks usually decline by 1.3 mb/week this time of year. Last week they instead rose 6.4 mb/week (+7.2 mb if including SPR). Total US commercial oil stocks are now only 2.1 mb below the 2015-19 seasonal average. US oil stocks normally decline from now to Christmas. If they instead continue to rise, then it will be strongly counter seasonal rise and will create a very strong bearish pressure on oil prices.
Will OPEC+ lift its voluntary quotas by zero, 137 kb/d, 500 kb/d or 1.5 mb/d? On Sunday of course OPEC+ will decide on how much to unwind of the remaining 1.5 mb/d of voluntary quotas for November. Will it be 137 kb/d yet again as for October? Will it be 500 kb/d as was talked about earlier this week? Or will it be a full unwind in one go of 1.5 mb/d? We think most likely now it will be at least 500 kb/d and possibly a full unwind. We discussed this in a not earlier this week: ”500 kb/d of voluntary quotas in October. But a full unwind of 1.5 mb/d”
The strength in the front-end of the Dubai curve held out through summer while Brent and WTI curve structures weakened steadily. That core strength helped to keep flat crude oil prices elevated close to the 70-line. Now also the Dubai curve has given in.

Brent crude oil forward curves

Total US commercial stocks now close to normal. Counter seasonal rise last week. Rest of year?

Total US crude and product stocks on a steady trend higher.

Analys
OPEC+ will likely unwind 500 kb/d of voluntary quotas in October. But a full unwind of 1.5 mb/d in one go could be in the cards
Down to mid-60ies as Iraq lifts production while Saudi may be tired of voluntary cut frugality. The Brent December contract dropped 1.6% yesterday to USD 66.03/b. This morning it is down another 0.3% to USD 65.8/b. The drop in the price came on the back of the combined news that Iraq has resumed 190 kb/d of production in Kurdistan with exports through Turkey while OPEC+ delegates send signals that the group will unwind the remaining 1.65 mb/d (less the 137 kb/d in October) of voluntary cuts at a pace of 500 kb/d per month pace.
Signals of accelerated unwind and Iraqi increase may be connected. Russia, Kazakhstan and Iraq were main offenders versus the voluntary quotas they had agreed to follow. Russia had a production ’debt’ (cumulative overproduction versus quota) of close to 90 mb in March this year while Kazakhstan had a ’debt’ of about 60 mb and the same for Iraq. This apparently made Saudi Arabia angry this spring. Why should Saudi Arabia hold back if the other voluntary cutters were just freeriding? Thus the sudden rapid unwinding of voluntary cuts. That is at least one angle of explanations for the accelerated unwinding.
If the offenders with production debts then refrained from lifting production as the voluntary cuts were rapidly unwinded, then they could ’pay back’ their ’debts’ as they would under-produce versus the new and steadily higher quotas.
Forget about Kazakhstan. Its production was just too far above the quotas with no hope that the country would hold back production due to cross-ownership of oil assets by international oil companies. But Russia and Iraq should be able to do it.
Iraqi cumulative overproduction versus quotas could reach 85-90 mb in October. Iraq has however steadily continued to overproduce by 3-5 mb per month. In July its new and gradually higher quota came close to equal with a cumulative overproduction of only 0.6 mb that month. In August again however its production had an overshoot of 100 kb/d or 3.1 mb for the month. Its cumulative production debt had then risen to close to 80 mb. We don’t know for September yet. But looking at October we now know that its production will likely average close to 4.5 mb/d due to the revival of 190 kb/d of production in Kurdistan. Its quota however will only be 4.24 mb/d. Its overproduction in October will thus likely be around 250 kb/d above its quota with its production debt rising another 7-8 mb to a total of close to 90 mb.
Again, why should Saudi Arabia be frugal while Iraq is freeriding. Better to get rid of the voluntary quotas as quickly as possible and then start all over with clean sheets.
Unwinding the remaining 1.513 mb/d in one go in October? If OPEC+ unwinds the remaining 1.513 mb/d of voluntary cuts in one big go in October, then Iraq’s quota will be around 4.4 mb/d for October versus its likely production of close to 4.5 mb/d for the coming month..
OPEC+ should thus unwind the remaining 1.513 mb/d (1.65 – 0.137 mb/d) in one go for October in order for the quota of Iraq to be able to keep track with Iraq’s actual production increase.
October 5 will show how it plays out. But a quota unwind of at least 500 kb/d for Oct seems likely. An overall increase of at least 500 kb/d in the voluntary quota for October looks likely. But it could be the whole 1.513 mb/d in one go. If the increase in the quota is ’only’ 500 kb/d then Iraqi cumulative production will still rise by 5.7 mb to a total of 85 mb in October.
Iraqi production debt versus quotas will likely rise by 5.7 mb in October if OPEC+ only lifts the overall quota by 500 kb/d in October. Here assuming historical production debt did not rise in September. That Iraq lifts its production by 190 kb/d in October to 4.47 mb/d (August level + 190 kb/d) and that OPEC+ unwinds 500 kb/d of the remining quotas in October when they decide on this on 5 October.


Teck Resources kan förse Nordamerika och kanske hela G7 med all germanium som behövs

Leading Edge Materials är på rätt plats i rätt tid

Oljepriset faller efter ny handelskonflikt mellan USA och Kina

Christian Kopfer kommenterar guld, koppar, olja och stål, samt några råvarubolag

Silver spränger den magiska gränsen, kostar nu över 50 USD per uns

Kinas elproduktion slog nytt rekord i augusti, vilket även kolkraft gjorde

Tyskland har så höga elpriser att företag inte har råd att använda elektricitet

Det stigande guldpriset en utmaning för smyckesköpare

Ett samtal om guld, olja, fjärrvärme och förnybar energi

OPEC+ missar produktionsmål, stöder oljepriserna
-
 Nyheter4 veckor sedan
Kinas elproduktion slog nytt rekord i augusti, vilket även kolkraft gjorde
-
Nyheter4 veckor sedan
Tyskland har så höga elpriser att företag inte har råd att använda elektricitet
-
 Nyheter4 veckor sedan
Det stigande guldpriset en utmaning för smyckesköpare
-
 Nyheter3 veckor sedan
Ett samtal om guld, olja, fjärrvärme och förnybar energi
-
 Nyheter2 veckor sedan
OPEC+ missar produktionsmål, stöder oljepriserna
-
Analys4 veckor sedan
Brent crude ticks higher on tension, but market structure stays soft
-
Analys3 veckor sedan
Are Ukraine’s attacks on Russian energy infrastructure working?
-

 Nyheter1 vecka sedan
Guld nära 4000 USD och silver 50 USD, därför kan de fortsätta stiga