Analys
A recession is no match for OPEC+

History shows that OPEC cuts work wonderfully. When OPEC acts it changes the market no matter how deep the crisis. Massive 9.7 m b/d in May 2020. Large cuts in Dec 2008. And opposite: No-cuts in 2014 crashed the price. OPEC used to be slow and re-active. Now they are fast and re-active. Latest cut indicates a ”reaction-function” with a floor price of USD 70/b. Price could move lower than that in May, but JMMC meeting on 4 June and full OPEC+ meeting on 5-6 July would then change the course. Fresh cuts now in May will likely drive market into deficit, inventory draws, stronger prices. Sell-offs in May should be a good buying opportunities


Production cuts by OPEC+ do work. They work wonderfully. Deep cuts announced by OPEC in December 2008 made the oil price bottom at USD 33.8/b on Christmas Eve. That is USD 48.3/b adj. for CPI. The oil price then collapsed in 2014 when it became increasingly clear during the autumn that OPEC would NOT defend the oil price with confirmation of no-cuts in December that year. The creation of OPEC+ in the autumn of 2016 then managed to drive the oil price higher despite booming US shale oil production. A massive 9.7 m b/d cut in production in May 2020 onward made the oil price shoot higher after the trough in April 2020.
Historical sequence pattern is first a price-trough, then cuts, then rebound. This history however points to a typical sequence of events. First we have a trough in prices. Then we get cuts by OPEC(+) and then the oil price shoots back up. This probably creates an anticipation by the market of a likewise sequence this time. I.e. that the oil price first is going to head to USD 40/b, then deep cuts by OPEC+ and then the rebound. If we get an ugly recession.
But OPEC+ is faster and much more vigilant today. Historically OPEC met every half year. Assessed the situation and made cuts or no cuts in a very reactive fashion. That always gave the market a long lead-time both in terms of a financial sell-off and a potential physical deterioration before OPEC would react.
But markets are faster today as well with new information spreading to the world almost immediately. Impact of that is both financial and physical. The financial sell-off part is easy to understand. The physical part can be a bit more intricate. Fear itself of a recession can lead to a de-stocking of the oil supply chain where everyone suddenly starts to draw down their local inventories of crude and products with no wish to buy new supplies as demand and prices may be lower down the road. This can then lead to a rapid build-up of crude stocks in the hubs and create a sense of very weak physical demand for oil even if it is still steady.
Deep trough in prices is possible but would not last long. Faster markets and faster OPEC+ action means we could still have a deep trough in prices but they would not last very long. Oil inventories previously had time to build up significantly when OPEC acted slowly. When OPEC then finally made the cuts it would take some time to reverse the inventory build-up. So prices would stay lower for longer. Rapid action by OPEC+ today means that inventories won’t have time to build up to the same degree if everything goes wrong with the economy. Thus leading to much briefer sell-offs and sharper and faster re-bounds.
OPEC+ hasn’t really even started cutting yet. Yes, we have had some cuts announced with 1.5 m b/d reduction starting now in May. But this is only bringing Saudi Arabia’s oil production back to roughly its normal level around 10 m b/d following unusually high production of 11 m b/d in Sep 2022. So OPEC+ has lots of ”dry powder” for further cuts if needed.
OPEC reaction function: ”USD 70/b is the floor”. The most recent announced production cut gave a lot of information. It was announced on 2nd of April and super-fast following the 20th of March when Dated Brent traded to an intraday low of USD 69.27/b.
JMMC on 4 June and OPEC+ meeting on 5-6 July. Will cut if needed. OPEC+ will now spend the month of May to assess the effects of the newest cuts. The Joint Ministerial Monitoring Committee (JMMC) will then meet on 4 June and make a recommendation to the group. If it becomes clear at that time that further cuts are needed then we’ll likely get verbal intervention during June in the run-up to 5-6 July and then fresh cuts if needed.
Oil man Biden wants a price floor of USD 70/b as well. The US wants to rebuild its Strategic Petroleum Reserves (SPR) which now has been drawn down to about 50%. It stated in late 2022 that it wanted to buy if the oil price fell down to USD 67 – 72/b. Reason for this price level is of course that if it falls below that then US shale oil production would/could start to decline with deteriorating energy security for the US. Latest signals from the US administration is that the rebuilding of the SPR could start in Q3-23.
A note on shale oil activity vs. oil price. The US oil rig count has been falling since early December 2022 and has been doing so during a period when the Dated Brent price has been trading around USD 80/b.
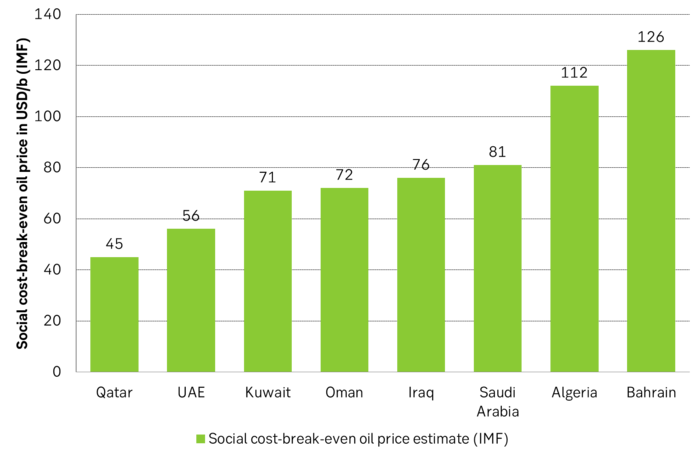
IMF estimated social cost-break-even oil price for the different Middle East countries. As long as US shale oil production is not booming there should be lots of support within OPEC+ to cut production in order to maintain the oil price above USD 70/b. Thus the ”OPEC+ reaction-function” of a USD 70/b floor price. But USD 80/b would even satisfy Saudi Arabia.

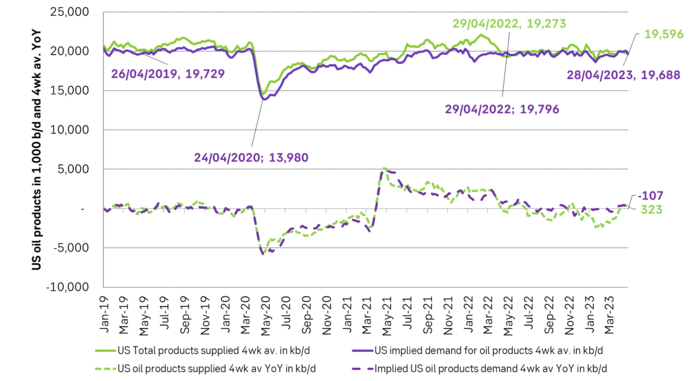
US implied demand and products delivered is holding up nicely YoY and on par with 2019. So far at least. Seen from an aggregated level.

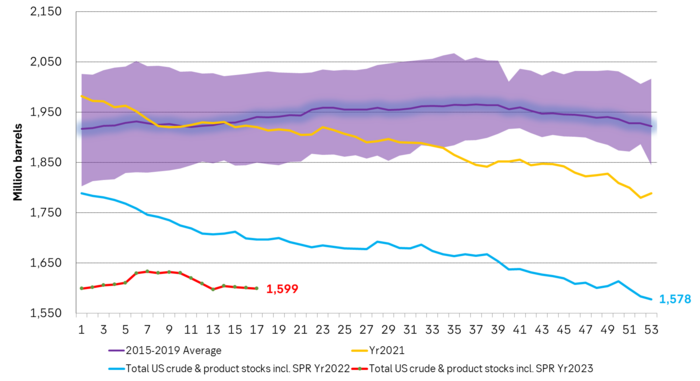
Total US crude and product stocks including SPR. Ticking lower. Could fall faster from May onward due to fresh cuts by OPEC+ of 1.5 m b/d
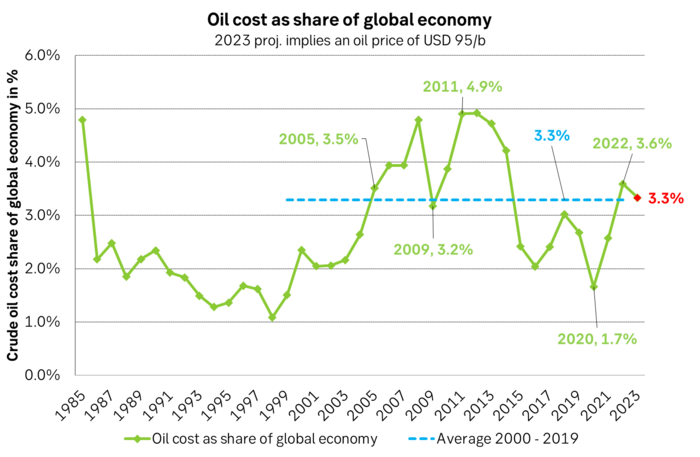
An oil price of USD 95/b in 2023 would place cost of oil to the global economy at 3.3% of Global GDP which is equal to the 2000 – 2019 average.