

Analys
Mixed signals on demand but world will need more oil from OPEC but the group is cutting

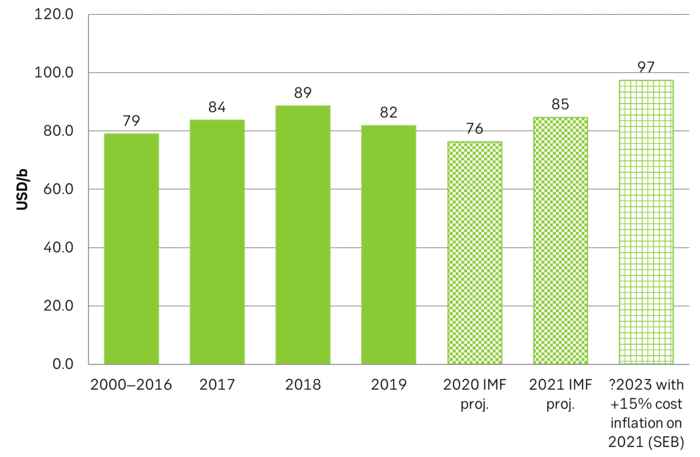
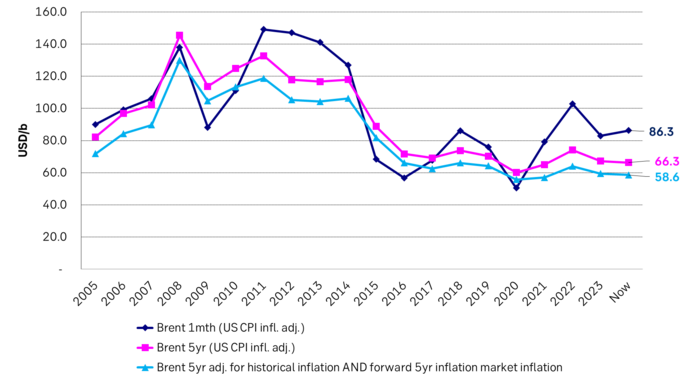
A world where OPEC(+) is in charge is a very different world than we are used to during the ultra-bearish 2015-19 period where US shale AND offshore non-OPEC production both were booming. Brent averaged USD 58/b nominal and USD 70/b in real terms that period. The Brent 5yr contract is trading at USD 66/b nominal or USD 58.6/b in real-terms assuming no market power to OPEC+ in 2028. Could be, but we don’t think so as US Permian shale is projected by major players to peak next 5yrs. When OPEC(+) is in charge the group will cut according to needs. For Saudi that is around USD 85/b but maybe as high as USD 97/b if budget costs rise with inflation

No major revisions to outlook by the IEA last week in its monthly Oil Market Report.
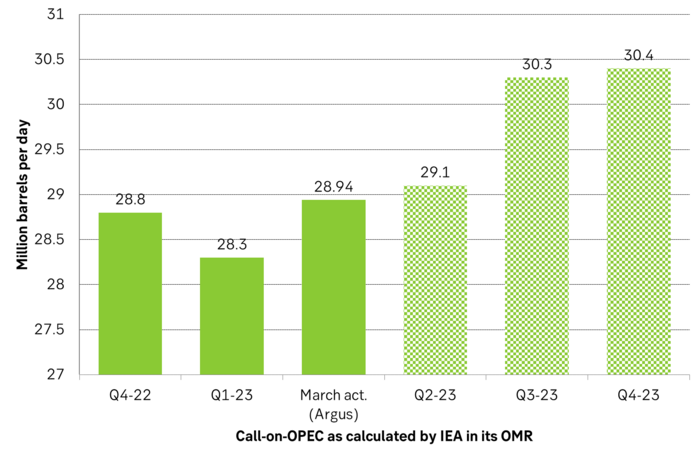
Total demand to rise 2 m b/d, 90% of demand growth from non-OECD and 57% from Jet fuel. Total demand to rise by 2 m b/d YoY to 101.9 m b/d where 90% of the gain is non-OECD. Jet fuel demand to account for 57% of demand growth as global aviation continues to normalize post Covid-19. Demand for 2022 revised down by 0.1 m b/d and as a result so was the 2023 outlook (to 101.9 m b/d). Non-OPEC supply for 2023 was revised up by 0.1 m b/d. Call-on-OPEC 2023 was reduced by 0.2 m b/d as a result to 29.5 m b/d. Call-on-OPEC was 28.8 m b/d in Q4-22. The group produced 28.94 m b/d in Mar (Argus).
World will need more oil from OPEC. Call-on-OPEC to rise 1.6 m b/d from Q4-22 to Q4-23. IEA is forecasting a call-on-OPEC in Q4-23 of 30.4 m b/d. The world will thus need 1.6 m b/d more oil from OPEC YoY in Q4-23 and 0.46 m b/d more than it produced in March. Counter to this though the OPEC group decided to cut production by 1 m b/d from May to the end of the year. So from May onward the group will produce around 28 m b/d while call-on-OPEC will be 29.1 m b/d, 30.3 m b/d and 30.4 m b/d in Q2,3,4-23.
If the IEA is right about demand then the coming OPEC cuts should drive inventories significantly lower and oil prices higher.
But the market doesn’t quite seem to buy into this outlook. If it had then prices would have moved higher. Prices bumped up to USD 87.49/b intraday on 12 April but have since fallen back and Brent is falling back half a percent today to USD 85.9/b.
Market is concerned for declining OECD manufacturing PMI’s. It is of course the darkening clouds on the macro-sky which is making investors concerned about the outlook for oil products demand and thus crude oil demand. Cross-currents in global oil product demand is making the situation difficult to assess. On the one hand there are significant weakening signals in global diesel demand along with falling manufacturing PMIs. The stuff which makes the industrial world go round. Manufacturing, trucking, mining and heavy duty vehicles all need diesel. (Great Blbrg story on diesel here.) Historically recessions implies a cyclical trough in manufacturing activity, softer diesel demand and falling oil prices. So oil investors are naturally cautious about buying into the bull-story based on OPEC cuts alone.
Cross-currents is making demand growth hard to assess. But the circumstances are much more confusing this time around than in normal recession cycles because: 1) Global Jet fuel demand is reviving/recovering post Covid-19 and along with China’s recent reopening. IEA’s assessment is that 57% of global demand growth this year will be from Jet fuel. And 2) Manufacturing PMIs in China and India are rising while OECD PMIs are falling.
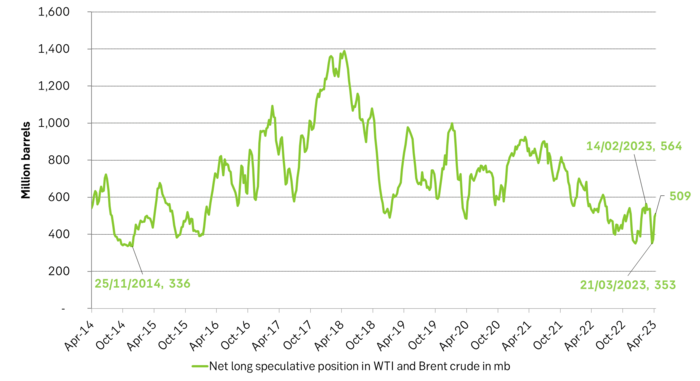
These cross-currents in the demand picture is what makes the current oil market so difficult to assess for everyone and why oil prices are not rallying directly to + USD 100/b. Investors are cautious. Though net-long specs have rallied 137 m b to 509 m b since the recent OPEC cuts were announced.
The world will need more oil from OPEC in 2023 but OPEC is cutting. The IEA is projecting that non-OPEC+ supply will grow by 1.9 m b/d YoY and OPEC+ will decline by 0.8 m b/d and in total that global supply will rise 1.2 m b/d in 2023. In comparison global demand will rise by 2.0 m b/d. At the outset this is a very bullish outlook but the global macro-backdrop could of course deteriorate further thus eroding the current projected demand growth of 2 m b/d. But OPEC can cut more if needed since latest cuts have only brought Saudi Arabia’s production down to its normal level.
OPEC has good reasons to cut production if it can. IEA expects global oil demand to rise 2 m b/d YoY in 2023 and that call-on-OPEC will lift 1.6 m b/d from Q4-22 to Q4-23. I.e. the world needs more oil from OPEC in 2023. But OPEC will likely produce closer to 28 m b/d from May to Dec following latest announced production cuts
Market has tightened with stronger backwardation and investors have increased their long positions
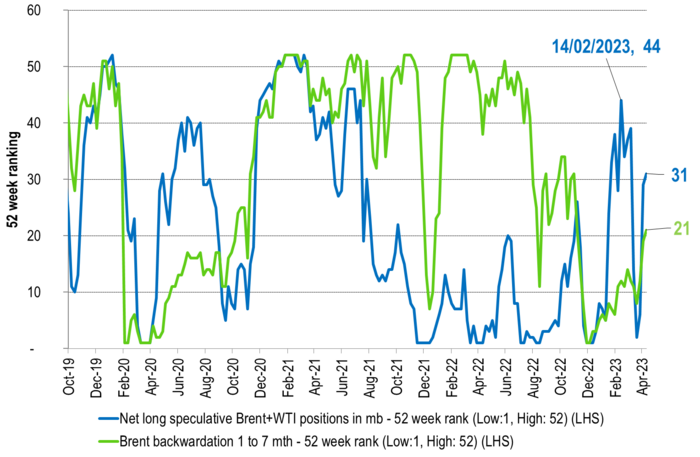
Net long specs in Brent + WTI has bounced since OPEC announcement on coming cuts.
Saudi Arabia’s fiscal cost-break-even was USD 85/b in 2021 projected the IMF earlier. Don’t know when it was projected, but looks like it was before 2020 and thus before the strong rise in inflation. If we add 15% US inflation to the 2021 number we get USD 97/b. Inflation should lift budget costs in Saudi Arabia as it is largely a USD based economy. Though Saudi Arabia’s inflation since Q4-19 is reported as 8% to data while Saudi cost-of-living-index is up by 11%. Good reason for Saudi Arabia to cut if it can cut without loosing market share to US shale.
Adjusting for inflation both on a backward and forward basis. The 5yr Brent price is today at USD 66.3/b but if we adjust for US 5yr inflation it is USD 58.6/b in real terms. That is basically equal to the average Brent spot price from 2015-2019 which was very bearish with booming shale and booming offshore non-OPEC. Market is basically currently pricing that Brent oil market in 5yrs time will be just as bearish as the ultra-bearish period from 2015-2019. It won’t take a lot to beat that when it comes to actual delivery in 2028.
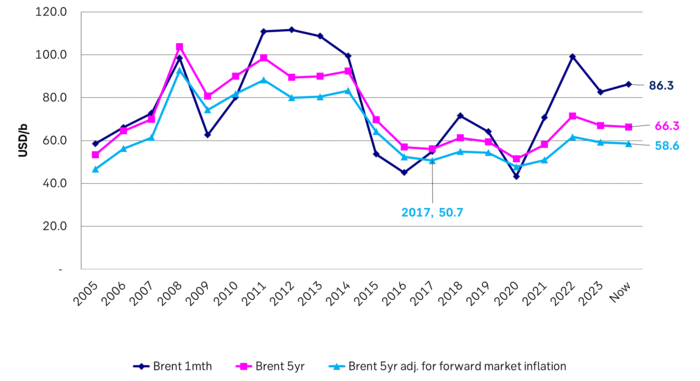
Nominal Brent oil prices and 5yr Brent adj. for 5yr forward inflation expectations only
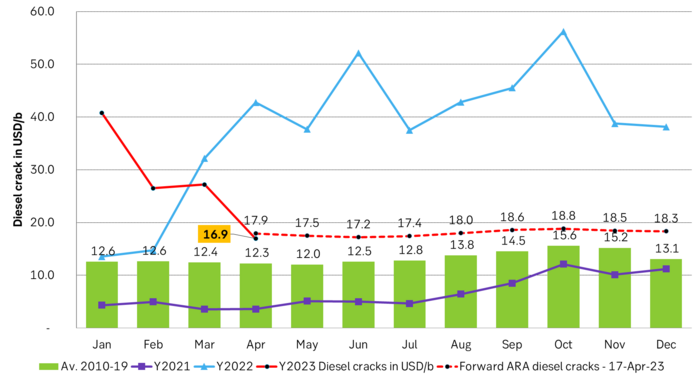
ARA Diesel cracks to Brent were exceptionally low in 2020/21 and exceptionally high in 2022. Now they are normalizing. Large additions to refining capacity through 2023 will increase competition in refining and reduce margins. Cuts by OPEC+ will at the same time make crude oil expensive. But diesel cracks are still significantly higher than normal. So more downside before back to normal is achieved.
Market is starting to take US/Iran headlines with a pinch of salt. Brent crude rose $2.8/b yesterday to an official close of $112.1/b. But after that it traded as low as $108.05/b before ending late night at around $109.7/b. Through the day it traded in a range of $106.87 – 112.72/b amid a flurry of news or rumors from Iran and the US. ”US temporary sanctions during negotiations” (falls alarm). ”We will bomb Iran” (not anyhow),… etc. While the market is still fluctuating to this kind of news flow, it is starting to take such headlines with a pinch of salt.

We’ll see. Maybe, maybe not. The Brent M1 contract is trading at $110.2/b this morning which very close to the average ticks through yesterday of $110.4/b.
Trump with bearish, verbal intervention whenever Brent trades above $110/b it seems. What seems to be a pattern is that Trump states something like ”very good negotiations going on with Iran”, ”New leaders in Iran are great,..”, ”Great progress in negotiations,…”, ”Deal in sight,..” etc whenever the Brent M1 contract trades above $110/b. An effort to cool the market. These hot air verbal interventions from Trump used to have a heavy bearish impact on prices, but they now seems to have less and less effect unless they are backed by reality.
As far as we can see there has been no real progress in the negotiations between the US and Iran with both sides still standing by their previous demands.
Iran is getting stronger while the cease fire lasts making a return to war for Trump yet harder. Iran is naturally in constant preparation for a return to war given Trump’s steady threats of bombing Iran again. Iran is naturally doing what ever is possible to prepare for a return to war. And every day the cease fire lasts it is better prepared. This naturally makes it more and more difficult and dangerous for the US to return to warring activity versus Iran as the consequences for energy infrastructure in the Persian Gulf will be more and more severe the longer the cease fire lasts. Israel seems to see it this way as well. That the war is not won and that current frozen state of a cease fire gives Iran opportunity to rebuild military and politically.
Global inventories are drawing down day by day. How much? In the meantime the Strait of Hormuz stays closed. There is varying measures and estimates of how much global inventories are drawing down. Our rough estimate, back of the envelope, is that global inventories are drawing down by at least some 10 mb/d or about 300 mb/d in a balance between loss of supply versus demand destruction. Other estimates we see are a monthly draw of 250-270 mb/d. The IEA only ’measured’ a draw in global observable stocks of 117 mb in April with oil on water rising 53 mb while on shore stocks fell 170 mb. But global stocks are hard to measure with large invisible, unmeasured stocks. As such a back of the envelope approach may be better.
Oil products is what the world is consuming. Oil product prices likely to rise while product stocks fall. Strategic Petroleum Reserves (SPR) are predominantly crude oil. Discharging oil from OECD SPR stocks, a sharp reduction in Chinese crude imports and a reduction in global refinery throughput of 6-7 mb/d has helped to keep crude oil markets satisfactorily supplied. But global inventories are drawing down none the less. And oil products is really what the world is consuming. So if global refinery throughput stays subdued, then demand will eventually have to match the supply of oil products. The likely path forward this summer is a steady draw down in jet fuel, diesel and gasoline. Higher prices for these. Then, if possible, higher refinery throughput and higher usage of crude in response to very profitable refinery margins. And lastly sharper draw in crude stocks and higher prices for these. But some 6 mb/d of oil products used to be exported through the Strait of Hormuz. And it may not be so easy to ramp up refinery activity across the world to compensate. Especially as Ukraine continues to damage Russian refineries as well as Russian crude production and export facilities.
Watch oil product stocks and prices as well as Brent calendar 2027. What to watch for this summer is thus oil product inventories falling and oil product premiums to crude rising. Another measure to watch is the Brent crude 2027 contract as it rises steadily day by day as the Strait of Hormuz stays closed and global oil inventories decline. The latter is close to the highest level since the start of the war and keeps rising.
The Brent M1 contract and the Brent 2027 prices and current price of jet fuel in Europe (ARA). All in USD/b

Our back of the envelope calculation of the global shortage created by the closure of the Strait of Hormuz. Note that 3.5 mb/d of discharge from SPR is also a draw. Note also that ’Forced demand loss’ of 2.5 mb/d is probably temporary and will fall back towards zero as logistics are sorted out leaving ’Price demand loss’ to do the job of balancing the market. Thus a shortfall of at least 9 mb/d created by the closure. More if SPR discharge is included and more if Forced demand loss recedes.

Brent is climbing higher. Front-month is at USD 106.3/bl this morning, close to a weekly high and a USD 9/bl jump from Mondays open. This is the move we flagged as a risk earlier in the week: the market shifting from ”a deal is around the corner” to ”this is going to take longer than we thought”.

Analyst Commodities, SEB
During April, rest-of-year Brent remained remarkably stable around USD 90/bl. A stability which rested on one single assumption: the SoH reopens around 1 May. That assumption is now slowly falling apart.
As we highlighted yesterday: every week of delay beyond 1 May adds (theoretically) ish USD 5/bl to the rest-of-year average, as global inventories draw 100 million barrels per week. i.e., a mid-May reopening implies rest-of-year Brent closer to USD 100/bl, and anything pushing into June or July takes us meaningfully higher.
What’s changed in the last 48 hours:
#1: The US military has formally warned that clearing suspected sea mines from SoH could take up to six months. That is a completely different timescale from what the financial market is pricing. Even a political deal tomorrow does not immediately reopen the strait.
#2: Trump has shifted his tone from urgency to ”strategic patience”. In yesterday’s press conference: ”Don’t rush me… I want a great deal.” The market is reading this as a president no longer feeling pressured by timelines, with the naval blockade running in the background.
#3: So far, the military activity is escalating, not de-escalating. Axios reports Iran is laying more mines in SoH. The US 3rd carrier strike group (USS George H.W. Bush) is arriving with two countermine vessels. Trump yesterday ordered the US Navy to destroy any Iranian boats caught laying mines. While CNN reports that the Pentagon is actively drawing up plans to strike Iranian SoH capabilities and individual Iranian military leaders if the ceasefire collapses. i.e., NOT a attitude consistent with an imminent deal!
Spot crude and product prices eased off the early-April highs on a combination of system rerouting and deal optimism. Both now weakening. Goldman estimates April Gulf output is reduced by 14.5 mbl/d, or 57% of pre-war supply, a number that keeps getting worse the longer this drags on.
Demand-side adaptation is ongoing: S. Korea has cut its Middle East crude dependence from 69% to 56% by pulling more from the Americas and Africa, and Japan is kicking off a second round of SPR releases from 1 May. But SPRs are finite.
Ref. to the negotiations, we should not bet on speed. The current Iranian leadership is dominated by genuine hardliners willing to absorb economic pain and run the clock to extract concessions. That is not a setup for a rapid resolution. US/Israeli media briefings keep framing the delay as ”internal Iranian divisions”, the reality is more complicated and points toward weeks and months, not days.
Our point is that the complexity is large, and higher prices have only just started (given a scenario where the negotiations drag out in time). The market spent April leaning on the USD 90/bl rest-of-year assumption; that case is diminishing by the hour. If ”early May reopening” is replaced by ”June, July or later” over the next week or two, both crude and products have meaningful room to reprice higher from here. There is a high risk being short energy and betting on any immediate political resolution(!).
Down on Friday. Up on Monday. The Brent June crude oil contract traded down 5.1% last week to a close of $90.38/b. It reached a high of $103.87/b last Monday and a low of $86.09/b on Friday as Iran announced that the Strait of Hormuz was fully open for transit. That quickly changed over the weekend as the US upheld its blockade of Iranian oil exports while Iran naturally responded by closing the SoH again. The US blew a hole in the engine room of the Iranian ship TOUSKA and took custody of the ship on Sunday. Brent crude is up 5.6% this morning to $95.4/b.
The cease-fire is expiring tomorrow. The US has said it will send a delegation for a second round of negotiations in Islamabad in Pakistan. But Iran has for now rejected a second round of talks as it views US demands as unrealistic and excessive while the US is also blocking the Strait of Hormuz.
While Brent is up 5% this morning, the financial market is still very optimistic that progress will be made. That talks will continue and that the SoH will fully open by the start of May which is consistent with a rest-of-year average Brent crude oil price of around $90/b with the market now trading that balance at around $88/b.
Financial optimism vs. physical deterioration. We have a divergence where the financial market is trading negotiations, improvements and resolution while at the same time the physical market is deteriorating day by day. Physical oil flows remain constrained by disrupted flows, longer voyage times and elevated freight and insurance costs.
Financial markets are betting that a US/Iranian resolution will save us in time from violent shortages down the road. But every day that the SoH remains closed is bringing us closer to a potentially very painful point of shortages and much higher prices.
The US blockade is also a weapon of leverage against its European and Asian allies. When Iran closed the SoH it held the world economy as a hostage against the US. The US blockade of the SoH is of course blocking Iranian oil exports. But it is also an action of disruption directed towards Europe and Asia. The US has called for the rest of the world to engaged in the war with Iran: ”If you want oil from the Persian Gulf, then go and get it”. A risk is that the US plays brinkmanship with the global oil market directed towards its European and Asian allies and maybe even towards China to force them to engage and take part. Maybe unthinkable. But unthinkable has become the norm with Trump in the White House.


Sommarväder skapar prisrally på elbörsen
Oil product price pain is set to rise as the Strait of Hormuz stays closed into summer

Solkraften pressar elpriserna dagtid

Michel Gubel ger sin syn på oljemarknaden