

Analys
Mixed signals on demand but world will need more oil from OPEC but the group is cutting

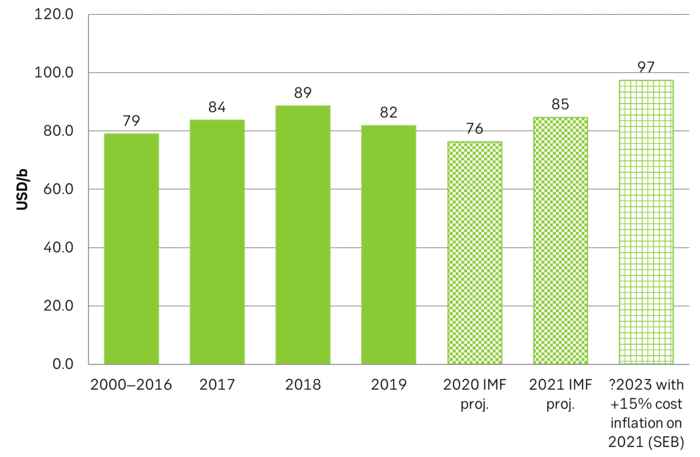
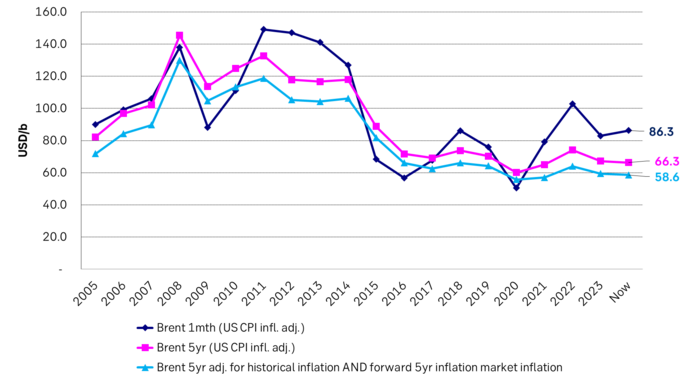
A world where OPEC(+) is in charge is a very different world than we are used to during the ultra-bearish 2015-19 period where US shale AND offshore non-OPEC production both were booming. Brent averaged USD 58/b nominal and USD 70/b in real terms that period. The Brent 5yr contract is trading at USD 66/b nominal or USD 58.6/b in real-terms assuming no market power to OPEC+ in 2028. Could be, but we don’t think so as US Permian shale is projected by major players to peak next 5yrs. When OPEC(+) is in charge the group will cut according to needs. For Saudi that is around USD 85/b but maybe as high as USD 97/b if budget costs rise with inflation

No major revisions to outlook by the IEA last week in its monthly Oil Market Report.
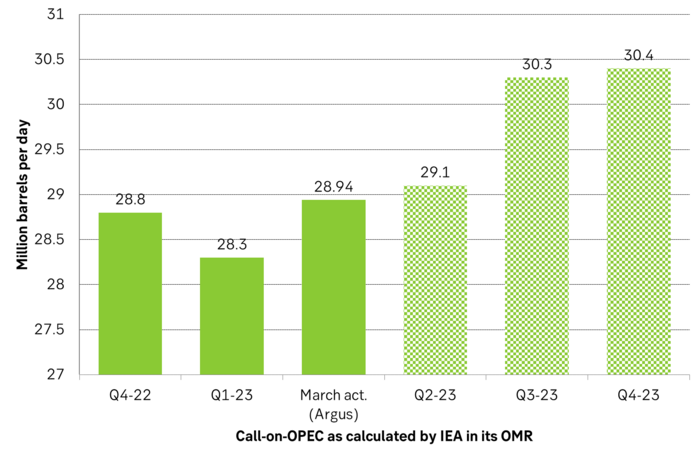
Total demand to rise 2 m b/d, 90% of demand growth from non-OECD and 57% from Jet fuel. Total demand to rise by 2 m b/d YoY to 101.9 m b/d where 90% of the gain is non-OECD. Jet fuel demand to account for 57% of demand growth as global aviation continues to normalize post Covid-19. Demand for 2022 revised down by 0.1 m b/d and as a result so was the 2023 outlook (to 101.9 m b/d). Non-OPEC supply for 2023 was revised up by 0.1 m b/d. Call-on-OPEC 2023 was reduced by 0.2 m b/d as a result to 29.5 m b/d. Call-on-OPEC was 28.8 m b/d in Q4-22. The group produced 28.94 m b/d in Mar (Argus).
World will need more oil from OPEC. Call-on-OPEC to rise 1.6 m b/d from Q4-22 to Q4-23. IEA is forecasting a call-on-OPEC in Q4-23 of 30.4 m b/d. The world will thus need 1.6 m b/d more oil from OPEC YoY in Q4-23 and 0.46 m b/d more than it produced in March. Counter to this though the OPEC group decided to cut production by 1 m b/d from May to the end of the year. So from May onward the group will produce around 28 m b/d while call-on-OPEC will be 29.1 m b/d, 30.3 m b/d and 30.4 m b/d in Q2,3,4-23.
If the IEA is right about demand then the coming OPEC cuts should drive inventories significantly lower and oil prices higher.
But the market doesn’t quite seem to buy into this outlook. If it had then prices would have moved higher. Prices bumped up to USD 87.49/b intraday on 12 April but have since fallen back and Brent is falling back half a percent today to USD 85.9/b.
Market is concerned for declining OECD manufacturing PMI’s. It is of course the darkening clouds on the macro-sky which is making investors concerned about the outlook for oil products demand and thus crude oil demand. Cross-currents in global oil product demand is making the situation difficult to assess. On the one hand there are significant weakening signals in global diesel demand along with falling manufacturing PMIs. The stuff which makes the industrial world go round. Manufacturing, trucking, mining and heavy duty vehicles all need diesel. (Great Blbrg story on diesel here.) Historically recessions implies a cyclical trough in manufacturing activity, softer diesel demand and falling oil prices. So oil investors are naturally cautious about buying into the bull-story based on OPEC cuts alone.
Cross-currents is making demand growth hard to assess. But the circumstances are much more confusing this time around than in normal recession cycles because: 1) Global Jet fuel demand is reviving/recovering post Covid-19 and along with China’s recent reopening. IEA’s assessment is that 57% of global demand growth this year will be from Jet fuel. And 2) Manufacturing PMIs in China and India are rising while OECD PMIs are falling.
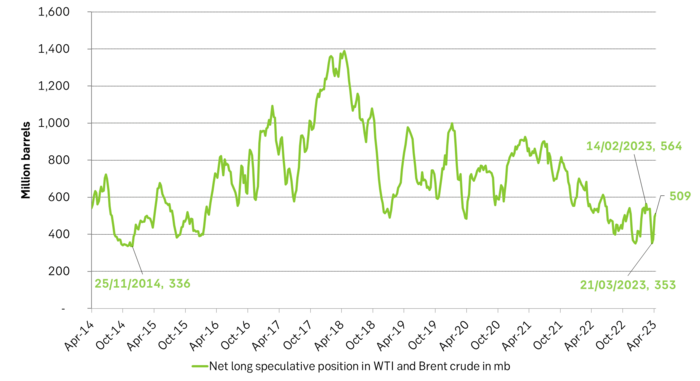
These cross-currents in the demand picture is what makes the current oil market so difficult to assess for everyone and why oil prices are not rallying directly to + USD 100/b. Investors are cautious. Though net-long specs have rallied 137 m b to 509 m b since the recent OPEC cuts were announced.
The world will need more oil from OPEC in 2023 but OPEC is cutting. The IEA is projecting that non-OPEC+ supply will grow by 1.9 m b/d YoY and OPEC+ will decline by 0.8 m b/d and in total that global supply will rise 1.2 m b/d in 2023. In comparison global demand will rise by 2.0 m b/d. At the outset this is a very bullish outlook but the global macro-backdrop could of course deteriorate further thus eroding the current projected demand growth of 2 m b/d. But OPEC can cut more if needed since latest cuts have only brought Saudi Arabia’s production down to its normal level.
OPEC has good reasons to cut production if it can. IEA expects global oil demand to rise 2 m b/d YoY in 2023 and that call-on-OPEC will lift 1.6 m b/d from Q4-22 to Q4-23. I.e. the world needs more oil from OPEC in 2023. But OPEC will likely produce closer to 28 m b/d from May to Dec following latest announced production cuts
Market has tightened with stronger backwardation and investors have increased their long positions
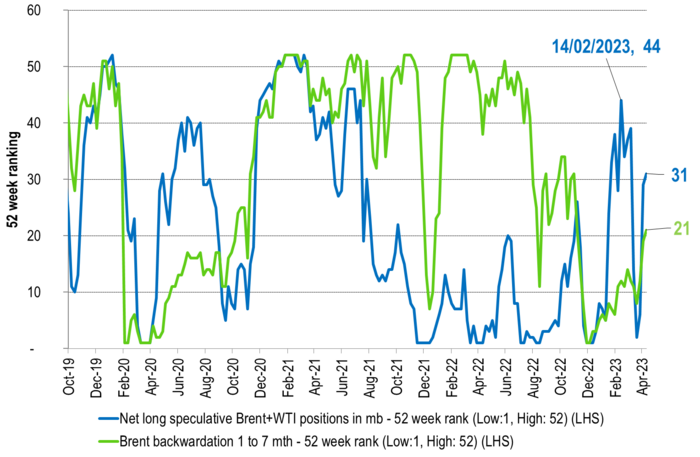
Net long specs in Brent + WTI has bounced since OPEC announcement on coming cuts.
Saudi Arabia’s fiscal cost-break-even was USD 85/b in 2021 projected the IMF earlier. Don’t know when it was projected, but looks like it was before 2020 and thus before the strong rise in inflation. If we add 15% US inflation to the 2021 number we get USD 97/b. Inflation should lift budget costs in Saudi Arabia as it is largely a USD based economy. Though Saudi Arabia’s inflation since Q4-19 is reported as 8% to data while Saudi cost-of-living-index is up by 11%. Good reason for Saudi Arabia to cut if it can cut without loosing market share to US shale.
Adjusting for inflation both on a backward and forward basis. The 5yr Brent price is today at USD 66.3/b but if we adjust for US 5yr inflation it is USD 58.6/b in real terms. That is basically equal to the average Brent spot price from 2015-2019 which was very bearish with booming shale and booming offshore non-OPEC. Market is basically currently pricing that Brent oil market in 5yrs time will be just as bearish as the ultra-bearish period from 2015-2019. It won’t take a lot to beat that when it comes to actual delivery in 2028.
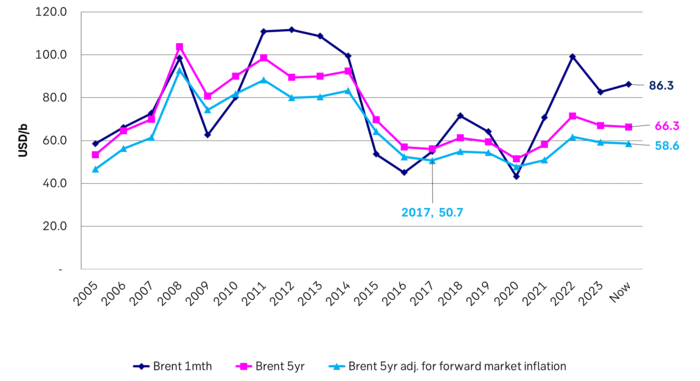
Nominal Brent oil prices and 5yr Brent adj. for 5yr forward inflation expectations only
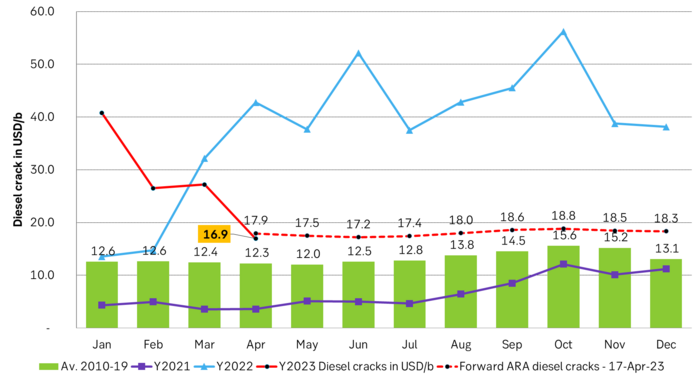
ARA Diesel cracks to Brent were exceptionally low in 2020/21 and exceptionally high in 2022. Now they are normalizing. Large additions to refining capacity through 2023 will increase competition in refining and reduce margins. Cuts by OPEC+ will at the same time make crude oil expensive. But diesel cracks are still significantly higher than normal. So more downside before back to normal is achieved.
Down on Friday. Up on Monday. The Brent June crude oil contract traded down 5.1% last week to a close of $90.38/b. It reached a high of $103.87/b last Monday and a low of $86.09/b on Friday as Iran announced that the Strait of Hormuz was fully open for transit. That quickly changed over the weekend as the US upheld its blockade of Iranian oil exports while Iran naturally responded by closing the SoH again. The US blew a hole in the engine room of the Iranian ship TOUSKA and took custody of the ship on Sunday. Brent crude is up 5.6% this morning to $95.4/b.

The cease-fire is expiring tomorrow. The US has said it will send a delegation for a second round of negotiations in Islamabad in Pakistan. But Iran has for now rejected a second round of talks as it views US demands as unrealistic and excessive while the US is also blocking the Strait of Hormuz.
While Brent is up 5% this morning, the financial market is still very optimistic that progress will be made. That talks will continue and that the SoH will fully open by the start of May which is consistent with a rest-of-year average Brent crude oil price of around $90/b with the market now trading that balance at around $88/b.
Financial optimism vs. physical deterioration. We have a divergence where the financial market is trading negotiations, improvements and resolution while at the same time the physical market is deteriorating day by day. Physical oil flows remain constrained by disrupted flows, longer voyage times and elevated freight and insurance costs.
Financial markets are betting that a US/Iranian resolution will save us in time from violent shortages down the road. But every day that the SoH remains closed is bringing us closer to a potentially very painful point of shortages and much higher prices.
The US blockade is also a weapon of leverage against its European and Asian allies. When Iran closed the SoH it held the world economy as a hostage against the US. The US blockade of the SoH is of course blocking Iranian oil exports. But it is also an action of disruption directed towards Europe and Asia. The US has called for the rest of the world to engaged in the war with Iran: ”If you want oil from the Persian Gulf, then go and get it”. A risk is that the US plays brinkmanship with the global oil market directed towards its European and Asian allies and maybe even towards China to force them to engage and take part. Maybe unthinkable. But unthinkable has become the norm with Trump in the White House.
Wild moves yesterday. Brent crude traded to a high of $114.43/b and a low of $96.0/b and closed at $99.94/b yesterday.
US – Iran negotiations ongoing or not? What a day. Donald Trump announced that good talks were ongoing between Iran and the US and that the 48 hour deadline before bombing Iranian power plants and energy infrastructure was postponed by five days subject to success of ongoing meetings. Iranian media meanwhile stated that no meetings were ongoing at all.
Today we are scratching our heads trying to figure out what yesterday was all about.
Friends and family playing the market? Was it just Trump and his friends and family who were playing with oil and equity markets with $580m and $1.46bn in bets being placed by someone in oil and equity markets just 15 minutes before Trump’s announcement?
Was Trump pulling a TACO as he reached his political and economic pain point: Brent at $112/b, US Gas at $4/gal, SPX below 200dma and US 10yr above 4.4%?
Different Iranian factions with Trump talking with one of them? Are there real negotiations going on but with the US talking to one faction in Iran while another, the hardliners, are not involved and are denying any such negotiations going on?
Extending the ultimatum to attack and invade Kharg island next weekend? Or, is the five day delay of the deadline a tactical decision to allow US amphibious assault ships and marines to arrive in the Gulf in the upcoming weekend while US and Israeli continues to degrade Iranian military targets till then. And then next weekend a move by the US/Israel to attack and conquer for example the Kharg island?
We do not really know which it is or maybe a combination of these.
We did get some kind of TACO ydy. But markets have been waiting for some kind of TACO to happen and yesterday we got some kind of TACO. And Brent crude is now trading at $101.5/b as a result rather than at $112-114/b as it did no the high yesterday.
But what really matters in our view is the political situation on the ground in Iran. Will hardliners continue to hold power or will a more pragmatic faction gain power?
If the hardliners remain in power then oil pain should extend all the way to US midterm elections. The hardliners were apparently still in charge as of last week. Iran immediately retaliated and damaged LNG infrastructure in Qatar after Israel hit Iranian South Pars. The SoH was still closed and all messages coming out of Iran indicated defiance. Hardliners continues in power has a huge consequence for oil prices going forward. The regime has played its ’oil-weapon’ (closing or chocking the Strait of Hormuz). It is using it to achieve political goals. Deterrence: it needs to be so politically and economically expensive to attack Iran that it won’t happen again in the future. Or at least that the US/Israel thinks 10-times over before they attack again. The highest Brent crude oil closing price since the start of the war is $112.19/b last Friday. In comparison the 20-year inflation adjusted Brent price is $103/b. So Brent crude last Friday at $112.19/b isn’t a shockingly high price. And it is still far below the nominal high of $148/b from 2008 which is $220/b if inflation adjusted. So once in a lifetime Iran activates its most powerful weapon. The oil weapon. It needs to show the power of this weapon and it needs to reap political gains. Getting Brent to $112/b and intraday high of $119.5/b (9 March) isn’t a display of the power of that weapon. And it is not a deterrence against future attacks.
So if the hardliners remain in power in Iran, then the SoH will likely remain chocked all the way to US midterm elections and Brent crude will at a minimum go above the historical nominal high of $148/b from 2008.
Thus the outlook for the oil price for the rest of the year doesn’t depend all that much of whether Trump pulls a TACO or not. Stops bombing or not. It depends more on who is in charge in Iran. If it is the hardliners, then deterrence against future attacks via chocking of the SoH and high oil prices is the likely line of action. It is impacting the world but the Iranian ’oil-weapon’ is directed towards the US president and the the US midterm elections.
If a pragmatic faction gets to power in Iran, then a very prosperous future is possible. However, if power is shifting towards a more pragmatic faction in Iran then a completely different direction could evolve. Such a faction could possibly be open for cooperation with the US and the GCC and possibly put its issues versus Israel aside. Then the prosperity we have seen evolving in Dubai could be a possible future also for Iran.
So far it looks like the hardliners are fully in charge. As far as we can see, the hardliners are still fully in control in Iran. That points towards continued chocking of the SoH and oil prices ticking higher as global inventories (the oil market buffers) are drawn lower. And not just for a few more weeks, but possibly all the way to the US midterm elections.
A brief sigh of relief yesterday as oil infra at Kharg wasn’t damaged. But higher today. Brent crude dabbled around a bit yesterday in relief that oil infrastructure at Iran’s Kharg island wasn’t damaged. It traded briefly below the 100-line and in a range of $99.54 – 106.5/b. Its close was near the low at $100.21/b.
No easy victorious way out for Trump. So no end in sight yet. Brent is up 3.2% today to $103.4/b with no signs that the war will end anytime soon. Trump has no easy way to declare victory and mission accomplished as long as Iran is in full control of the Strait of Hormuz while also holding some 440 kg of uranium enriched to 60% and not far from weapons grade at 90%. As long as these two factors are unresolved it is difficult for Trump to pull out of the Middle East. Naturally he gets increasingly frustrated over the situation as the oil price and US retail gas prices keeps ticking higher while the US is tied into the mess in the Middle East. Trying to drag NATO members into his mess but not much luck there.
When commodity prices spike they spike 2x, 3x, 4x or 5x. Supply and demand for commodities are notoriously inflexible. When either of them shifts sharply, the the price can easily go to zero (April 2022) or multiply 2x, 3x, or even 5x of normal. Examples in case cobalt in 2025 where Kongo restricted supply and the price doubled. Global LNG in 2022 where the price went 5x normal for the full year average. Demand for tungsten in ammunition is up strongly along with full war in the middle east. And its price? Up 537%.
Why hasn’t the Brent crude oil price gone 2x, 3x, 4x or 5x versus its normal of $68/b given close to full stop in the flow of oil of the Strait of Hormuz? We are after all talking about close to 20% of global supply being disrupted. The reason is the buffers. It is fairly easy to store oil. Commercial operators only hold stocks for logistical variations. It is a lot of oil in commercial stocks, but that is predominantly because the whole oil system is so huge. In addition we have Strategic Petroleum Reserves (SPRs) of close to 2500 mb of crude and 1000 mb of oil products. The IEA last week decided to release 400 mb from global SPR. Equal to 20 days of full closure of the Strait of Hormuz. Thus oil in commercial stocks on land, commercial oil in transit at sea and release of oil from SPRs is currently buffering the situation.
But we are running the buffers down day by day. As a result we see gradually increasing stress here and there in the global oil market. Asia is feeling the pinch the most. It has very low self sufficiency of oil and most of the exports from the Gulf normally head to Asia. Availability of propane and butane many places in India (LPG) has dried up very quickly. Local prices have tripled as a result. Local availability of crude, bunker oil, fuel oil, jet fuel, naphtha and other oil products is quickly running down to critical levels many places in Asia with prices shooting up. Oman crude oil is marked at $153/b. Jet fuel in Singapore is marked at $191/b.
Oil at sea originating from Strait of Hormuz from before 28 Feb is rapidly emptied. Oil at sea is a large pool of commercial oil. An inventory of oil in constant move. If we assume that the average journey from the Persian Gulf to its destinations has a volume weighted average of 13.5 days then the amount of oil at sea originating from the Persian Gulf when the the US/Israel attacked on 28 Feb was 13.5 days * 20 mb/d = 269 mb. Since the strait closed, this oil has increasingly been delivered at its destinations. Those closest to the Strait, like Pakistan, felt the emptying of this supply chain the fastest. Propane prices shooting to 3x normal there already last week and restaurants serving cold food this week is a result of that. Some 50-60% of Asia’s imports of Naphtha normally originates from the Persian Gulf. So naphtha is a natural pain point for Asia. The Gulf also a large and important exporter of Jet fuel. That shut in has lifted jet prices above $200/b.
To simplify our calculations we assume that no oil has left the Strait since that date and that there is no increase in Saudi exports from Yanbu. Then the draining of this inventory at sea originated from the Persian Gulf will essentially look like this:
The supply chain of oil at sea originating from the Strait of Hormuz is soon empty. Except for oil allowed through the Strait of Hormuz by Iran and increased exports from Yanbu in the Red Sea. Not included here.

Oil at sea is falling fast as oil is delivered without any new refill in the Persian Gulf. Waivers for Russian crude is also shifting Russian crude to consumers. Brent crude will likely start to feel the pinch much more forcefully when oil at sea is drawn down another 200 mb to around 1000 mb. That is not much more than 10 days from here.

Oil and oil products are starting to become very pricy many places. Brent crude has still been shielded from spiking like the others.


Market Still Betting on Timely Resolution, But Each Day Raises Shortage Risk

Christian Kopfer om läget för oljan

Marknaden måste börja betrakta de höga kopparpriserna som det nya normala

Det fysiska spotpriset på brentolja har slagit nytt rekord

40 minuter med Javier Blas om hur världen verkligen påverkas av energikrisen
40 minuter med Javier Blas om hur världen verkligen påverkas av energikrisen

Elpriserna fördubblas, stor osäkerhet inför sommaren

MP Materials, USA:s svar på Kinas dominans över sällsynta jordartsmetaller
Det fysiska spotpriset på brentolja har slagit nytt rekord

Studsvik har idag ansökt om att få bygga 1200-1600 MW kärnkraft i Valdemarsvik
-
 Nyheter3 veckor sedan
40 minuter med Javier Blas om hur världen verkligen påverkas av energikrisen
-
 Nyheter4 veckor sedan
Elpriserna fördubblas, stor osäkerhet inför sommaren
-
 Nyheter4 veckor sedan
MP Materials, USA:s svar på Kinas dominans över sällsynta jordartsmetaller
-
 Nyheter2 veckor sedan
Det fysiska spotpriset på brentolja har slagit nytt rekord
-
 Nyheter4 veckor sedan
Studsvik har idag ansökt om att få bygga 1200-1600 MW kärnkraft i Valdemarsvik
-
 Nyheter2 veckor sedan
Marknaden måste börja betrakta de höga kopparpriserna som det nya normala
-
Analys4 veckor sedan
TACO (or Whatever It Was) Sends Oil Lower — Iran Keeps Choking Hormuz
-

 Nyheter4 veckor sedan
Matproduktion är beroende av gödsel, Gulfkriget skapar brist