

Analys
OPEC meeting: Holding back is easy as Iran and Venezuela takes all the pain


Brent crude jumps 2.8% this morning to $66.6/bl following news that Saudi Arabia and Russia are in agreement of an extension of current cuts for another 6 to 9 months and that this plan is also endorsed by Iran’s oil minister Zanganeh. A trade truce between US and China also adds strength to the oil price this morning.
OPEC being “between a rock and a hard place” has been the description of OPEC’s situation in the run-up to this OPEC meeting. Losing market share to booming US shale oil production on the one hand while facing weakening oil demand growth along with slowing global growth on the other hand. It is true that OPEC as a whole is losing market share. But this burden is not evenly distributed as it is Venezuela and Iran who are taking almost all the pain. The other OPEC members (and OPEC+ members) are basically not taking any heat at all.

From Jan to May Saudi Arabia produced only 173 k bl/d below its 2014-2018 average while Russia produced 371 k bl/d above that average.
It is thus easy for the main producers to decide to roll cuts forward as they do not really cost them anything, or very little to do so. The only price they have to pay is to hold back supply slightly and refrain from growing their production along with global oil demand growth while harvesting an oil price of $60-70/bl.
It will of course be problematic when Iran and Venezuela eventually returns to the market. And that could indeed be a very bearish moment in the oil market. Given the large range of uncertainties in the oil market OPEC has learned to act reactively rather than trying to act pre-emptively. Thus OPEC will have to deal with the return of Venezuela and Iran at some point in the future but then it will deal with that rainy day when it comes. Right now things are as they are and it is easy for OPEC’s key members and Russia to roll the cuts forward into H2-19 and also likely into Q1-20.
It is clear that the global economy is still in a slow-down mode and so is global oil demand growth. Global oil demand growth is however rarely below +1% y/y unless the global economy is in a recession and as far as we can see we are not there yet at all.
Global oil demand seasonally jumps roughly 1 m bl/d from Q2 to H2. US shale oil production is currently growing at a marginal annualized rate of about 0.8 m bl/d YoY and in addition comes US NGL growth. US crude production will thus probably be 0.4 m bl/d higher at year end but on average just 0.2 m bl/d higher in H2 than in June. So OPEC+ will probably have to produce more in H2 than they did in H1 in order to satisfy seasonally higher demand unless the global economy tanks completely. Thus if Russia, Saudi Arabia and the other key OPEC members keeps production at the levels they produced in H1-19 they will ensure that the global oil market is not flowing over. They will only have to pay a small restraint while reaping a nice oil price of $60-70/bl
Two factors are coming into play in H2-19 in addition to global oil demand growth. The first is a large ramp-up of oil pipelines coming online from the Permian basin and out to the US Gulf. Cactus, EPIC and Grey Oak will add a total capacity of between 2.2 and 2.5 m bl/d from Permian to the USGC which effectively (80%) will amount to 1.7 to 2.0 m bl/d. This will help to release surplus oil inventories in the US into the global market place, tighten up the US market while easing the global situation. It will help to tighten up the WTI crude price curve while helping to ease the Brent crude price curve in relative terms. The oil market has a tendency to trade the global oil price on the back of US oil data due to lacking availability of high quality global data. Thus a draining of US oil inventories could be interpreted bullishly even though it is only shifting inventories from the US to non-US.
The other factor is the IMO – 2020 shift of fuel quality in global shipping from maximum 3.5% sulphur to only 0.5% sulphur in January 2020. In general this will add a lot of Marine Gasoil (MGO) demand from global shipping and especially so in Q4-19 and H1-2020. Global refineries will need to run hard to satisfy elevated stock building and demand already in Q4-19. This will be bullish for global crude oil demand already in H2-19. Ballpark figures are that shipping will need an additional 2 m bl/d of MGO in this period. Global refineries will probably have to process another 4-5 m bl/d of crude in order to satisfy this added MGO demand.
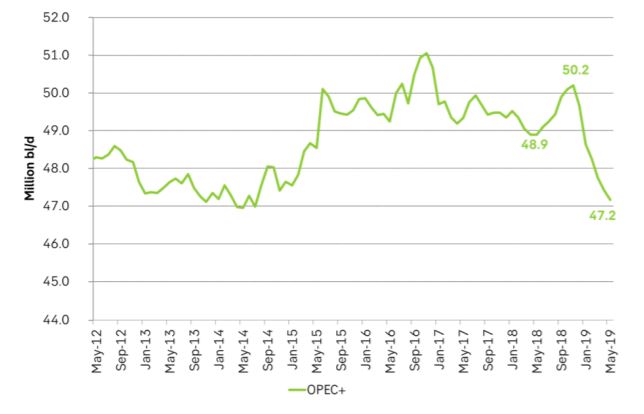
Ch1: Supply from OPEC+ declined 3.0 m bl/d from a peak in November last year. It looks like a decisive cut. To a large degree it is the misfortune of Iran and Venezuela. OPEC+ also boosted production from May to Nov last year and then cut from a peak.
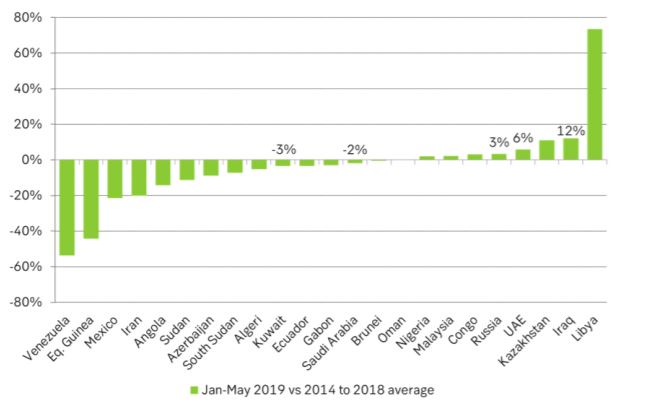
Ch2: Production in OPEC+ during Jan to May this year versus average levels from 2014 to 2018 in %. Russia, Iraq and UAE are well above while Saudi Arabia and Kuwait are just marginally below. Not a high price for these countries to hold production unchanged through H2-19 and Q1-20. Venezuela and Iran are taking the pain
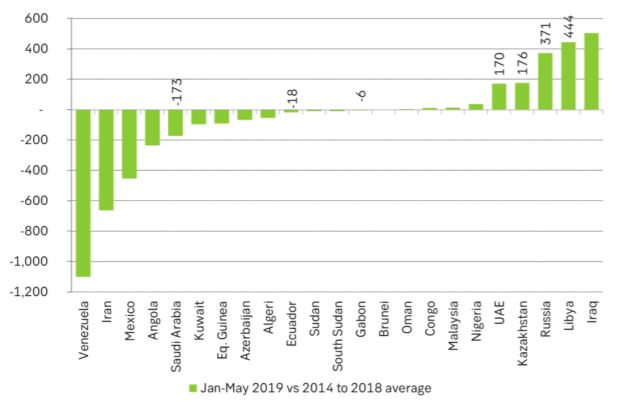
Ch3: Production in OPEC+ during Jan to May this year versus average levels from 2014 to 2018 in k bl/d. Saudi Arabia produced only 173 k bl/d below the 5 year average while Russia produced 371 k bl/d above that level. They are producing at very good volumes and not really paying a high price.
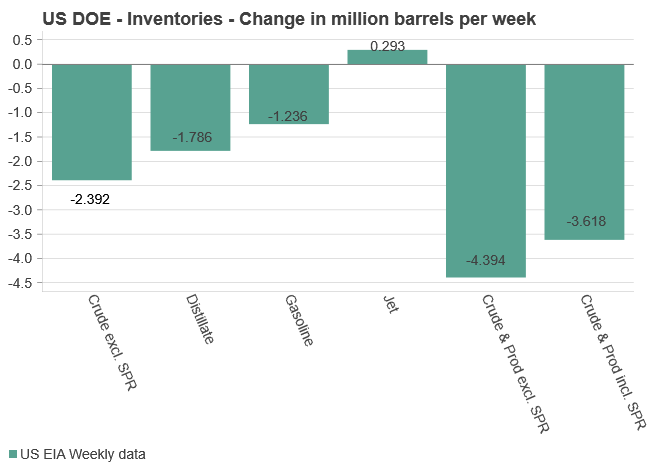
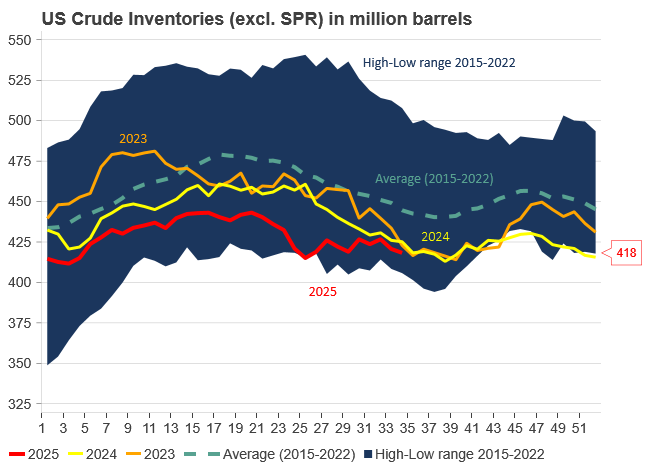
U.S. commercial crude inventories posted another draw last week, falling by 2.4 million barrels to 418.3 million barrels, according to the latest DOE report. Inventories are now 6% below the five-year seasonal average, underlining a persistently tight supply picture as we move into the post-peak demand season.

While the draw was smaller than last week’s 6 million barrel decline, the trend remains consistent with seasonal patterns. Current inventories are still well below the 2015–2022 average of around 449 million barrels.
Gasoline inventories dropped by 1.2 million barrels and are now close to the five-year average. The breakdown showed a modest increase in finished gasoline offset by a decline in blending components – hinting at steady end-user demand.
Diesel inventories saw yet another sharp move, falling by 1.8 million barrels. Stocks are now 15% below the five-year average, pointing to sustained tightness in middle distillates. In fact, diesel remains the most undersupplied segment, with current inventory levels at the very low end of the historical range (see page 3 attached).
Total commercial petroleum inventories – including crude and products but excluding the SPR – fell by 4.4 million barrels on the week, bringing total inventories to approximately 1,259 million barrels. Despite rising refinery utilization at 94.6%, the broader inventory complex remains structurally tight.
On the demand side, the DOE’s ‘products supplied’ metric – a proxy for implied consumption – stayed strong. Total product demand averaged 21.2 million barrels per day over the last four weeks, up 2.5% YoY. Diesel and jet fuel were the standouts, up 7.7% and 1.7%, respectively, while gasoline demand softened slightly, down 1.1% YoY. The figures reflect a still-solid late-summer demand environment, particularly in industrial and freight-related sectors.
Analys
Increasing risk that OPEC+ will unwind the last 1.65 mb/d of cuts when they meet on 7 September
Pushed higher by falling US inventories and positive Jackson Hall signals. Brent crude traded up 2.9% last week to a close of $67.73/b. It traded between $65.3/b and $68.0/b with the low early in the week and the high on Friday. US oil inventory draws together with positive signals from Powel at Jackson Hall signaling that rate cuts are highly likely helped to drive both oil and equities higher.

Ticking higher for a fourth day in a row. Bank holiday in the UK calls for muted European session. Brent crude is inching 0.2% higher this morning to $67.9/b which if it holds will be the fourth trading day in a row with gains. Price action in the European session will likely be quite muted due to bank holiday in the UK today.
OPEC+ is lifting production but we keep waiting for the surplus to show up. The rapid unwinding of voluntary cuts by OPEC+ has placed the market in a waiting position. Waiting for the surplus to emerge and materialize. Waiting for OECD stocks to rise rapidly and visibly. Waiting for US crude and product stocks to rise. Waiting for crude oil forward curves to bend into proper contango. Waiting for increasing supply of medium sour crude from OPEC+ to push sour cracks lower and to push Mid-East sour crudes to increasing discounts to light sweet Brent crude. In anticipation of this the market has traded Brent and WTI crude benchmarks up to $10/b lower than what solely looking at present OECD inventories, US inventories and front-end backwardation would have warranted.
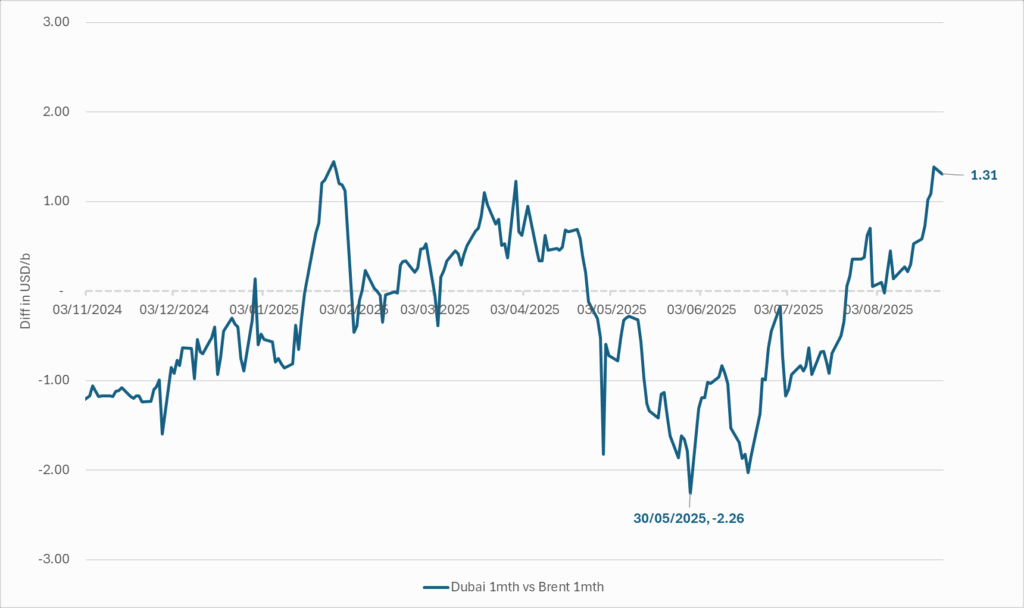
Quite a few pockets of strength. Dubai sour crude is trading at a premium to Brent crude! The front-end of the crude oil curves are still in backwardation. High sulfur fuel oil in ARA has weakened from parity with Brent crude in May, but is still only trading at a discount of $5.6/b to Brent versus a more normal discount of $10/b. ARA middle distillates are trading at a premium of $25/b versus Brent crude versus a more normal $15-20/b. US crude stocks are at the lowest seasonal level since 2018. And lastly, the Dubai sour crude marker is trading a premium to Brent crude (light sweet crude in Europe) as highlighted by Bloomberg this morning. Dubai is normally at a discount to Brent. With more medium sour crude from OPEC+ in general and the Middle East specifically, the widespread and natural expectation has been that Dubai should trade at an increasing discount to Brent. the opposite has happened. Dubai traded at a discount of $2.3/b to Brent in early June. Dubai has since then been on a steady strengthening path versus Brent crude and Dubai is today trading at a premium of $1.3/b. Quite unusual in general but especially so now that OPEC+ is supposed to produce more.
This makes the upcoming OPEC+ meeting on 7 September even more of a thrill. At stake is the next and last layer of 1.65 mb/d of voluntary cuts to unwind. The market described above shows pockets of strength blinking here and there. This clearly increases the chance that OPEC+ decides to unwind the remaining 1.65 mb/d of voluntary cuts when they meet on 7 September to discuss production in October. Though maybe they split it over two or three months of unwind. After that the group can start again with a clean slate and discuss OPEC+ wide cuts rather than voluntary cuts by a sub-group. That paves the way for OPEC+ wide cuts into Q1-26 where a large surplus is projected unless the group kicks in with cuts.
The Dubai medium sour crude oil marker usually trades at a discount to Brent crude. More oil from the Middle East as they unwind cuts should make that discount to Brent crude even more pronounced. Dubai has instead traded steadily stronger versus Brent since late May.
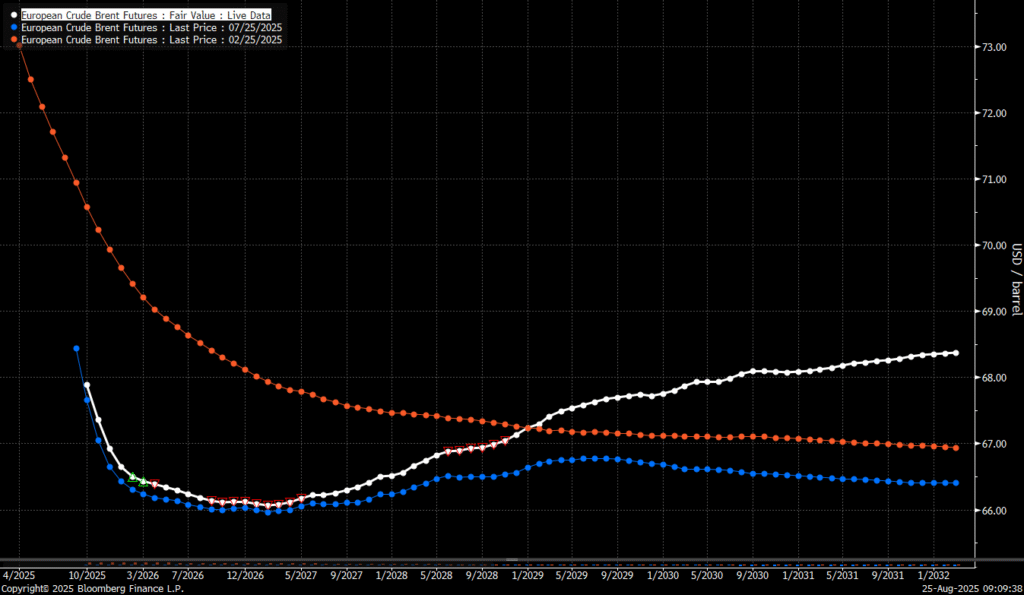
The Brent crude oil forward curve (latest in white) keeps stuck in backwardation at the front end of the curve. I.e. it is still a tight crude oil market at present. The smile-effect is the market anticipation of surplus down the road.
Analys
Brent edges higher as India–Russia oil trade draws U.S. ire and Powell takes the stage at Jackson Hole
Best price since early August. Brent crude gained 1.2% yesterday to settle at USD 67.67/b, the highest close since early August and the second day of gains. Prices traded to an intraday low of USD 66.74/b before closing up on the day. This morning Brent is ticking slightly higher at USD 67.76/b as the market steadies ahead of Fed Chair Jerome Powell’s Jackson Hole speech later today.
No Russia/Ukraine peace in sight and India getting heat from US over imports of Russian oil. Yesterday’s price action was driven by renewed geopolitical tension and steady underlying demand. Stalled ceasefire talks between Russia and Ukraine helped maintain a modest risk premium, while the spotlight turned to India’s continued imports of Russian crude. Trump sharply criticized New Delhi’s purchases, threatening higher tariffs and possible sanctions. His administration has already announced tariff hikes on Indian goods from 25% to 50% later this month. India has pushed back, defending its right to diversify crude sourcing and highlighting that it also buys oil from the U.S. Moscow meanwhile reaffirmed its commitment to supply India, deepening the impression that global energy flows are becoming increasingly politicized.
Holding steady this morning awaiting Powell’s address at Jackson Hall. This morning the main market focus is Powell’s address at Jackson Hole. It is set to be the key event for markets today, with traders parsing every word for signals on the Fed’s policy path. A September rate cut is still the base case but the odds have slipped from almost certainty earlier this month to around three-quarters. Sticky inflation data have tempered expectations, raising the stakes for Powell to strike the right balance between growth concerns and inflation risks. His tone will shape global risk sentiment into the weekend and will be closely watched for implications on the oil demand outlook.
For now, oil is holding steady with geopolitical frictions lending support and macro uncertainty keeping gains in check.
Oil market is starting to think and worry about next OPEC+ meeting on 7 September. While still a good two weeks to go, the next OPEC+ meeting on 7 September will be crucial for the oil market. After approving hefty production hikes in August and September, the question is now whether the group will also unwind the remaining 1.65 million bpd of voluntary cuts. Thereby completing the full phase-out of voluntary reductions well ahead of schedule. The decision will test OPEC+’s balancing act between volume-driven influence and price stability. The gathering on 7 September may give the clearest signal yet of whether the group will pause, pivot, or press ahead.


Silverpriset når 40 USD, högsta sedan 2011

Nytt produktionsrekord av olja i USA, högsta efterfrågan på 20 år
Crude stocks fall again – diesel tightness persists

Mahvie Minerals är verksamt i guldrikt område i Finland

Neil Atkinson spår att priset på olja kommer att stiga till 70 USD

Omgående mångmiljardfiasko för Equinors satsning på Ørsted och vindkraft

Lundin Gold hittar ny koppar-guld-fyndighet vid Fruta del Norte-gruvan

Meta bygger ett AI-datacenter på 5 GW och 2,25 GW gaskraftverk

Guld stiger till över 3500 USD på osäkerhet i världen
What OPEC+ is doing, what it is saying and what we are hearing
-
 Nyheter3 veckor sedan
Omgående mångmiljardfiasko för Equinors satsning på Ørsted och vindkraft
-
 Nyheter4 veckor sedan
Lundin Gold hittar ny koppar-guld-fyndighet vid Fruta del Norte-gruvan
-
 Nyheter1 vecka sedan
Meta bygger ett AI-datacenter på 5 GW och 2,25 GW gaskraftverk
-
 Nyheter3 veckor sedan
Guld stiger till över 3500 USD på osäkerhet i världen
-
Analys3 veckor sedan
What OPEC+ is doing, what it is saying and what we are hearing
-

 Nyheter4 veckor sedan
Alkane Resources och Mandalay Resources har gått samman, aktör inom guld och antimon
-
 Nyheter2 veckor sedan
Aker BP gör ett av Norges största oljefynd på ett decennium, stärker resurserna i Yggdrasilområdet
-

 Nyheter3 veckor sedan
Lyten, tillverkare av litium-svavelbatterier, tar över Northvolts tillgångar i Sverige och Tyskland