

Analys
Venezuela is bullish but S&P 500 still looks like the driver

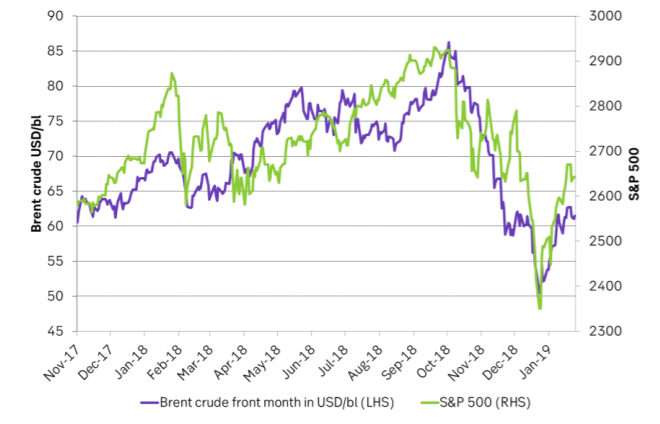
 Brent crude has gained 21% since Christmas eve following a comparable 12.4% recovery in the S&P 500 index. So just as the sell-off in Brent crude went more or less hand in hand with the equity sell-off this autumn the Brent crude recovery has gone hand in hand with the recovery of the S&P 500 so far this year. There is of course a fundamental story for the oil rebound as well with cuts by OPEC+, US shale oil rig count decline and declining production in Venezuela and Iran (and others). But what the equity-oil relationship through the autumn up to now is telling us is that if the current equity rebound falters with a renewed sell-off in the S&P 500 then the Brent crude oil price is likely to falter as well.
Donald Trump’s call for a regime shift in Venezuela with his outright support for opposition politician Juan Guaidó has led to a gain in the value of government bonds in Venezuela and thus seen as a positive development by bond investors on a general basis. Impacts on Venezuela’s oil production in the short to medium term is however another matter. To us it looks like more chaos and further decline in crude production.

Bjarne Schieldrop, Chief analyst commodities
A ban on oil imports from Venezuela to the US would likely only hurt US refineries which needs the heavy oil from Venezuela to blend with ultralight shale oil. Venezuela’s crude would probably just travel to other parts of the world instead of to the US. So an import ban to the US would probably not tighten the oil market as such. Tighter sanctions towards the Venezuelan economy with the goal of toppling the current Maduro regime would however most likely lead to a further rapid deterioration in Venezuela’s oil production which of course is directly bullish for the oil market. Eventually moving to the other side of chaos with an eventual Juan Guaidó regime holding hands with the US would then of course turn things around again as it would lay the foundation for a revival in crude production in Venezuela again but that seems to be way down the road from here.
As far as we understand it is not at all impossible for the US refineries to process ultralight US shale oil as it is today without blending it with heavy crude from Mexico or Venezuela. It is more that it is not optimal. Many of the US refineries were built for medium sour crude from the Middle East. In such complex refineries there are a lot of expensive post processing units following the division of the oil molecules in the atmospheric and vacuum distillation stage. All these post processing units have specific volume capacities calibrated to the molecule distribution in medium sour crude. So if US refineries process outright ultralight US shale oil in the distillation stage then many of the post processing units will run at sub-par volumes. Even the distillation stage may not be able to run at optimal capacity. I.e. it is technically and economically sub-optimal for these refineries to run shale oil outright but not necessarily difficult. It is mostly about economics. So a lower shale oil crude price versus product prices should facilitate this. The gasoline crack to Brent crude has however crashed to below zero and made it much more difficult. Or said in another way: A yet lower shale oil crude price is needed.
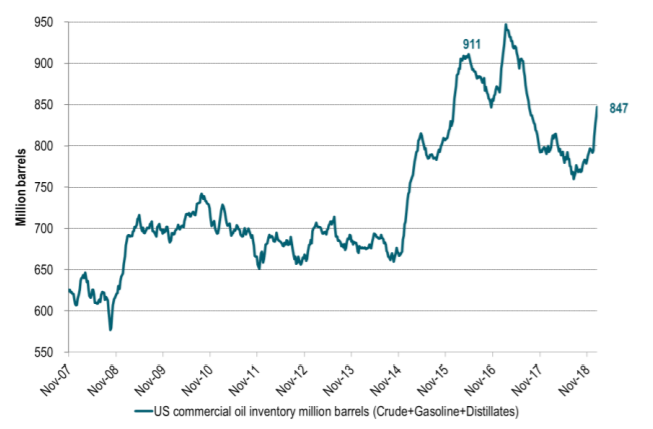
US crude and product inventories have sky-rocketed adding close to 90 m bl since late July last year of which 60 m bl have been added since late December. At the moment the market does not care too much about this since OPEC+ is cutting and production in Iran is falling (with further falls in Venezuela to be expected) while US well completions and rig count has started to decline. So the remedy for the booming inventories is on the way. If however the US S&P 500 recovery sours before the remedy shows signs of working (declining inventories) then crude oil prices would most likely follow the S&P 500 index lower.
A price-path dependent oil market. In our crude oil projection for 2019 we have projected Brent crude to average $55/bl in Q1-19 and we are well above that level now. It is important to note the strong price path dependence of today’s crude oil market. If we get a higher oil price now we’ll have more drilling more well completions and a higher oil production in the following quarters. It may feel good with Brent at $61/bl right now for global oil producers, but it may not be so good for the oil market in H2-19 as it will lead to a higher US crude oil production then.
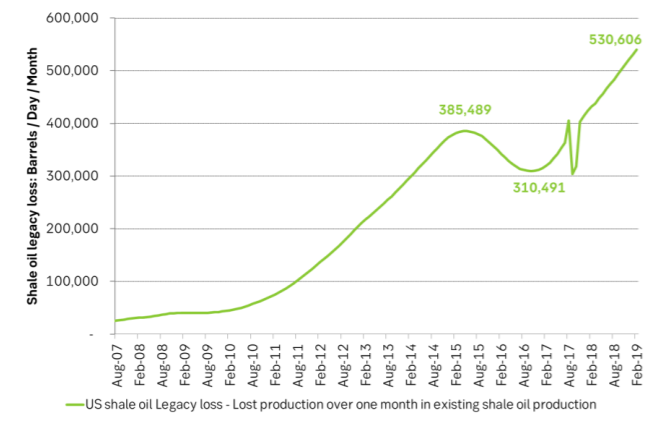
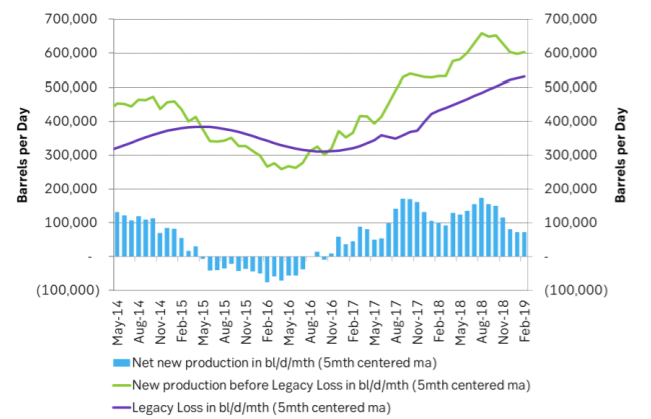
US shale oil production slows. In this week’s US EIA drilling productivity report we see that well completions have come down thus reacting to the decline in crude oil prices in H2-18. Losses in existing production rose to a new high of 530 k bl/d/mth while new production before losses rose to 602 k bl/d/mth for February. Marginal, annualized production growth thus fell to only 0.86 m bl/d/yr as new production growth slowed and moved closer to the rising legacy loss in the existing production.
Ch1: Crude prices and the S&P 500 continue hand in hand.
Ch2: US crude and product stocks have rallied. Up close to 90 m bl since late July of which close to 60 m bl since late December. But remedy is on the way with cuts by OPEC+ so the market has not cared too much about this since late December
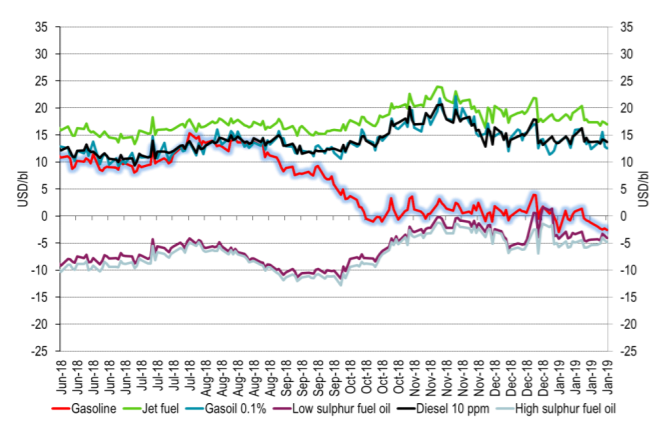
Ch3: Refining margins have been murdered by the crash in the gasoline crack (to Brent). Now gasoil and diesel cracks are also ticking lower as we moves towards the later part of the Nordic hemisphere winter.
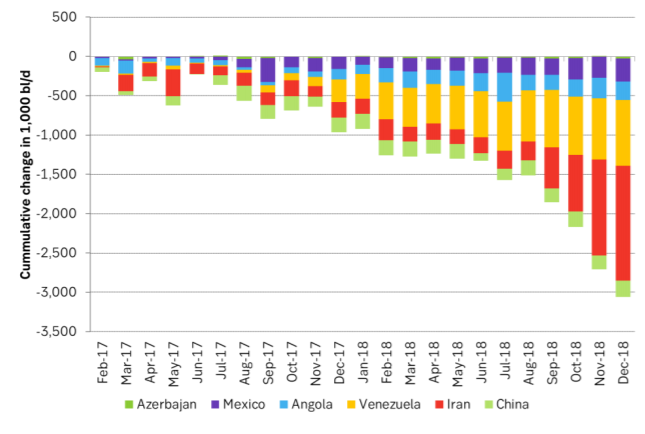
Ch4: Not so difficult to be booming shale oil as long as some 3 m bl/d is removed from supply from other suppliers. Booming US shale oil supply in the US is bad for Iran. The higher it goes the more room it gives Donald Trump to tighten Iran sanctions yet tighter.
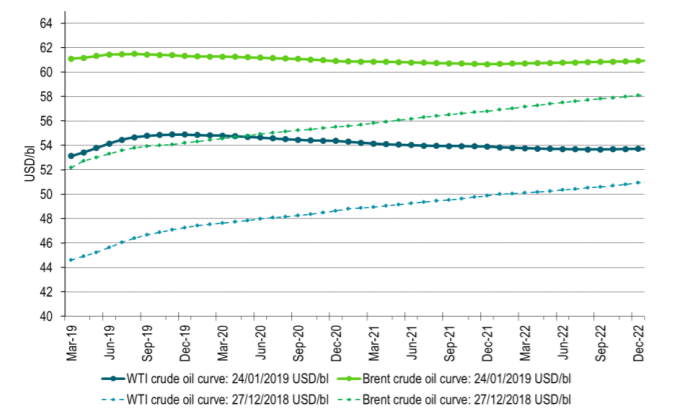
Ch5: Brent crude curve has flattened significantly since the low of 24 December
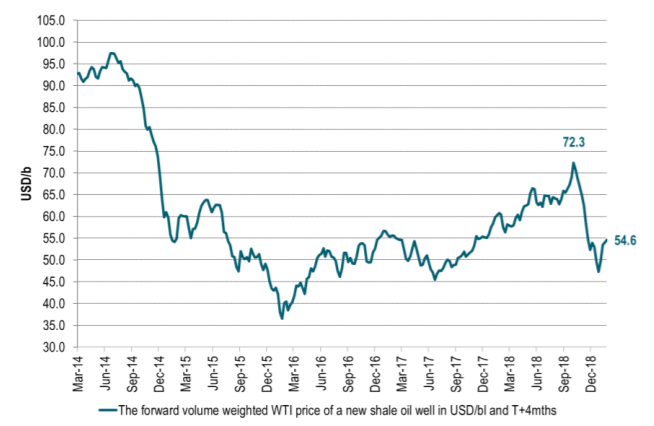
Ch6: The shale oil volume weighted WTI crude price has come down from $72.3/bl. But it has rebounded back to close to $55/bl which would imply “medium shale oil heat” if it stays at that price level. Access to capital is probably just as important as the oil price.
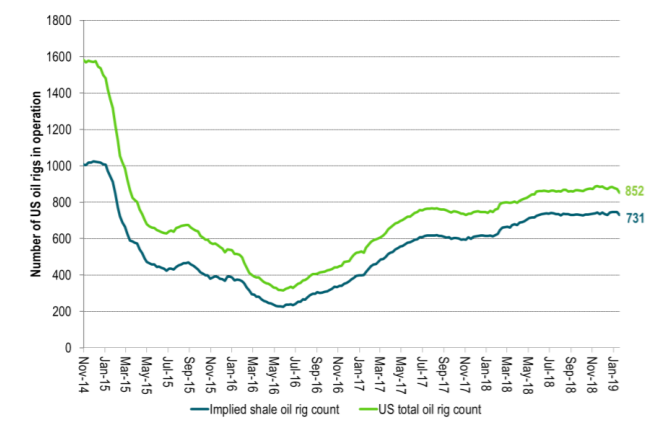
Ch7: US oil rig count has ticked lower but not all that much yet
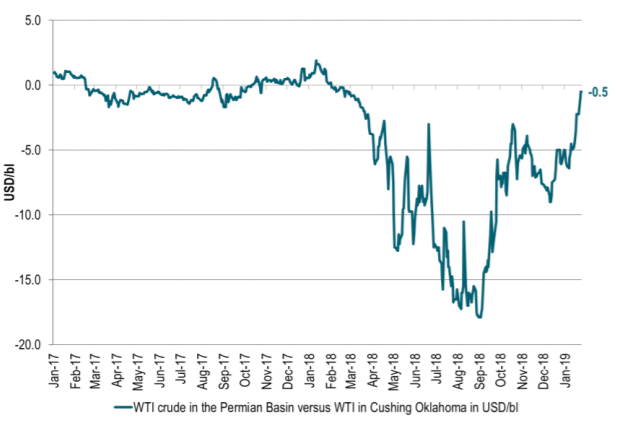
Ch8: The local Permian crude oil price traded at a huge discount versus Brent and WTI at times in 2018 as lack of pipelines out of Permian basin led to land-locked oil in the Permian
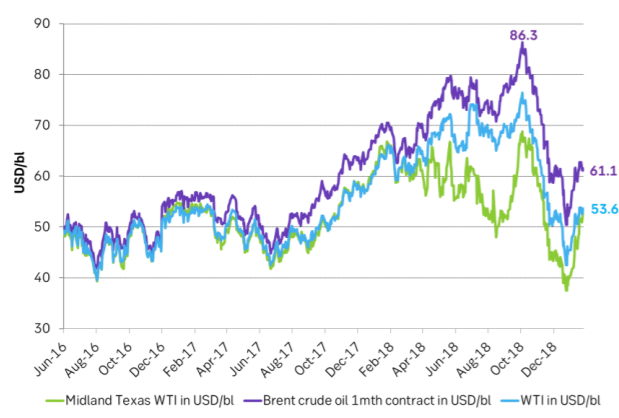
Ch9: Permian is obviously no longer very land-locked with respect to getting its oil to Cushing Oklahoma WTI and Permian prices are now almost equal again.
Ch10: Losses in existing US shale oil production will be 530 k bl/d/mth in February according to the US EIA. The most ever. I.e. more and more new wells need to be completed in order to counter this rising loss.
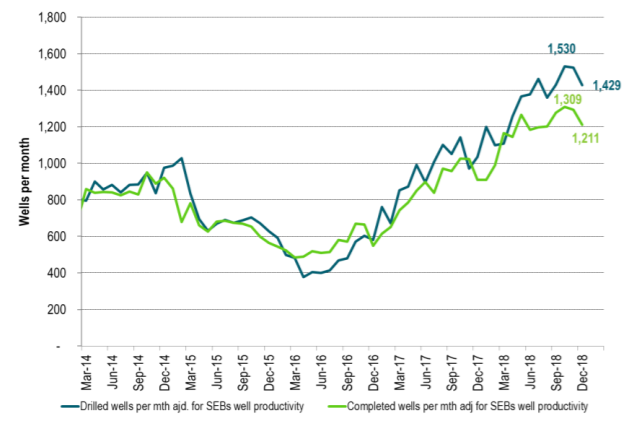
Ch11: Number of completed shale oil wells moved sideways in Oct and Nov and then down in December.
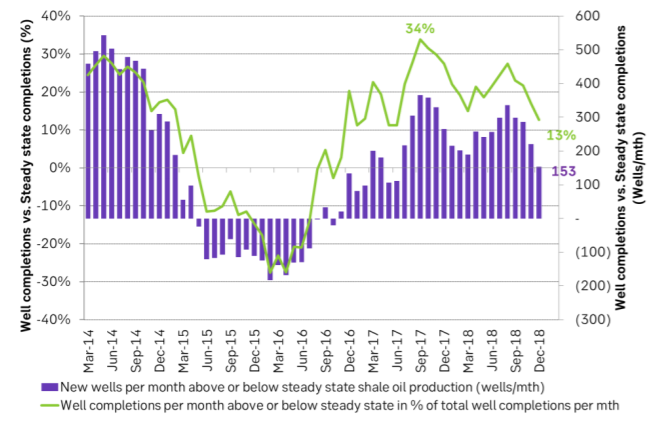
Ch12: A lower level of well completions led to a lower level of “new production”. Losses in existing production continued to increase. The gap between new production and losses thus narrowed so net production growth slowed to lowest growth rate since mid-2017.
Ch13: Well completions per month now only running at 153 (13%) wells above steady state (when US shale oil production growth = 0). That is the lowest since mid-2017. Due to strongly rising legacy loss the well completions only need to decline by another 153 wells per month to drive US shale oil production growth to a halt.
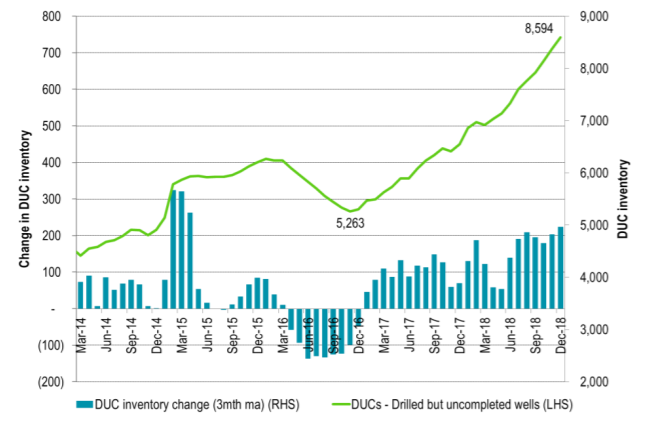
Ch14: Shale players are however still drilling way more than they are able or willing to complete. There is thus probably a significant inventory of DUCs which they can complete without drilling. So there is room for drilling rigs to decline significantly without a comparably significant decline in well completions.
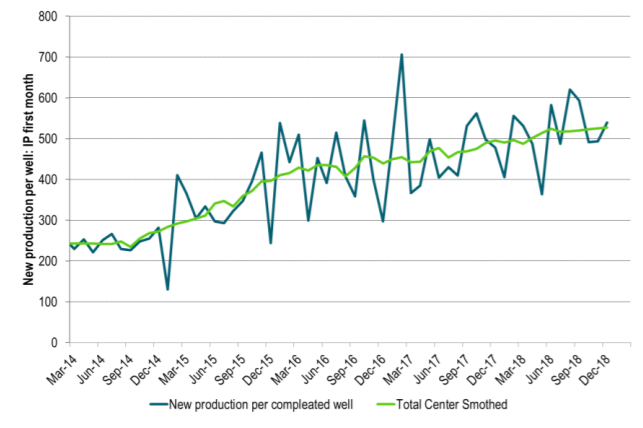
Ch15: Well productivity ticks higher at a pace of about 5-10% per year. But number of completed wells/mth is more important
Market is starting to take US/Iran headlines with a pinch of salt. Brent crude rose $2.8/b yesterday to an official close of $112.1/b. But after that it traded as low as $108.05/b before ending late night at around $109.7/b. Through the day it traded in a range of $106.87 – 112.72/b amid a flurry of news or rumors from Iran and the US. ”US temporary sanctions during negotiations” (falls alarm). ”We will bomb Iran” (not anyhow),… etc. While the market is still fluctuating to this kind of news flow, it is starting to take such headlines with a pinch of salt.

We’ll see. Maybe, maybe not. The Brent M1 contract is trading at $110.2/b this morning which very close to the average ticks through yesterday of $110.4/b.
Trump with bearish, verbal intervention whenever Brent trades above $110/b it seems. What seems to be a pattern is that Trump states something like ”very good negotiations going on with Iran”, ”New leaders in Iran are great,..”, ”Great progress in negotiations,…”, ”Deal in sight,..” etc whenever the Brent M1 contract trades above $110/b. An effort to cool the market. These hot air verbal interventions from Trump used to have a heavy bearish impact on prices, but they now seems to have less and less effect unless they are backed by reality.
As far as we can see there has been no real progress in the negotiations between the US and Iran with both sides still standing by their previous demands.
Iran is getting stronger while the cease fire lasts making a return to war for Trump yet harder. Iran is naturally in constant preparation for a return to war given Trump’s steady threats of bombing Iran again. Iran is naturally doing what ever is possible to prepare for a return to war. And every day the cease fire lasts it is better prepared. This naturally makes it more and more difficult and dangerous for the US to return to warring activity versus Iran as the consequences for energy infrastructure in the Persian Gulf will be more and more severe the longer the cease fire lasts. Israel seems to see it this way as well. That the war is not won and that current frozen state of a cease fire gives Iran opportunity to rebuild military and politically.
Global inventories are drawing down day by day. How much? In the meantime the Strait of Hormuz stays closed. There is varying measures and estimates of how much global inventories are drawing down. Our rough estimate, back of the envelope, is that global inventories are drawing down by at least some 10 mb/d or about 300 mb/d in a balance between loss of supply versus demand destruction. Other estimates we see are a monthly draw of 250-270 mb/d. The IEA only ’measured’ a draw in global observable stocks of 117 mb in April with oil on water rising 53 mb while on shore stocks fell 170 mb. But global stocks are hard to measure with large invisible, unmeasured stocks. As such a back of the envelope approach may be better.
Oil products is what the world is consuming. Oil product prices likely to rise while product stocks fall. Strategic Petroleum Reserves (SPR) are predominantly crude oil. Discharging oil from OECD SPR stocks, a sharp reduction in Chinese crude imports and a reduction in global refinery throughput of 6-7 mb/d has helped to keep crude oil markets satisfactorily supplied. But global inventories are drawing down none the less. And oil products is really what the world is consuming. So if global refinery throughput stays subdued, then demand will eventually have to match the supply of oil products. The likely path forward this summer is a steady draw down in jet fuel, diesel and gasoline. Higher prices for these. Then, if possible, higher refinery throughput and higher usage of crude in response to very profitable refinery margins. And lastly sharper draw in crude stocks and higher prices for these. But some 6 mb/d of oil products used to be exported through the Strait of Hormuz. And it may not be so easy to ramp up refinery activity across the world to compensate. Especially as Ukraine continues to damage Russian refineries as well as Russian crude production and export facilities.
Watch oil product stocks and prices as well as Brent calendar 2027. What to watch for this summer is thus oil product inventories falling and oil product premiums to crude rising. Another measure to watch is the Brent crude 2027 contract as it rises steadily day by day as the Strait of Hormuz stays closed and global oil inventories decline. The latter is close to the highest level since the start of the war and keeps rising.
The Brent M1 contract and the Brent 2027 prices and current price of jet fuel in Europe (ARA). All in USD/b

Our back of the envelope calculation of the global shortage created by the closure of the Strait of Hormuz. Note that 3.5 mb/d of discharge from SPR is also a draw. Note also that ’Forced demand loss’ of 2.5 mb/d is probably temporary and will fall back towards zero as logistics are sorted out leaving ’Price demand loss’ to do the job of balancing the market. Thus a shortfall of at least 9 mb/d created by the closure. More if SPR discharge is included and more if Forced demand loss recedes.

Brent is climbing higher. Front-month is at USD 106.3/bl this morning, close to a weekly high and a USD 9/bl jump from Mondays open. This is the move we flagged as a risk earlier in the week: the market shifting from ”a deal is around the corner” to ”this is going to take longer than we thought”.

Analyst Commodities, SEB
During April, rest-of-year Brent remained remarkably stable around USD 90/bl. A stability which rested on one single assumption: the SoH reopens around 1 May. That assumption is now slowly falling apart.
As we highlighted yesterday: every week of delay beyond 1 May adds (theoretically) ish USD 5/bl to the rest-of-year average, as global inventories draw 100 million barrels per week. i.e., a mid-May reopening implies rest-of-year Brent closer to USD 100/bl, and anything pushing into June or July takes us meaningfully higher.
What’s changed in the last 48 hours:
#1: The US military has formally warned that clearing suspected sea mines from SoH could take up to six months. That is a completely different timescale from what the financial market is pricing. Even a political deal tomorrow does not immediately reopen the strait.
#2: Trump has shifted his tone from urgency to ”strategic patience”. In yesterday’s press conference: ”Don’t rush me… I want a great deal.” The market is reading this as a president no longer feeling pressured by timelines, with the naval blockade running in the background.
#3: So far, the military activity is escalating, not de-escalating. Axios reports Iran is laying more mines in SoH. The US 3rd carrier strike group (USS George H.W. Bush) is arriving with two countermine vessels. Trump yesterday ordered the US Navy to destroy any Iranian boats caught laying mines. While CNN reports that the Pentagon is actively drawing up plans to strike Iranian SoH capabilities and individual Iranian military leaders if the ceasefire collapses. i.e., NOT a attitude consistent with an imminent deal!
Spot crude and product prices eased off the early-April highs on a combination of system rerouting and deal optimism. Both now weakening. Goldman estimates April Gulf output is reduced by 14.5 mbl/d, or 57% of pre-war supply, a number that keeps getting worse the longer this drags on.
Demand-side adaptation is ongoing: S. Korea has cut its Middle East crude dependence from 69% to 56% by pulling more from the Americas and Africa, and Japan is kicking off a second round of SPR releases from 1 May. But SPRs are finite.
Ref. to the negotiations, we should not bet on speed. The current Iranian leadership is dominated by genuine hardliners willing to absorb economic pain and run the clock to extract concessions. That is not a setup for a rapid resolution. US/Israeli media briefings keep framing the delay as ”internal Iranian divisions”, the reality is more complicated and points toward weeks and months, not days.
Our point is that the complexity is large, and higher prices have only just started (given a scenario where the negotiations drag out in time). The market spent April leaning on the USD 90/bl rest-of-year assumption; that case is diminishing by the hour. If ”early May reopening” is replaced by ”June, July or later” over the next week or two, both crude and products have meaningful room to reprice higher from here. There is a high risk being short energy and betting on any immediate political resolution(!).
Down on Friday. Up on Monday. The Brent June crude oil contract traded down 5.1% last week to a close of $90.38/b. It reached a high of $103.87/b last Monday and a low of $86.09/b on Friday as Iran announced that the Strait of Hormuz was fully open for transit. That quickly changed over the weekend as the US upheld its blockade of Iranian oil exports while Iran naturally responded by closing the SoH again. The US blew a hole in the engine room of the Iranian ship TOUSKA and took custody of the ship on Sunday. Brent crude is up 5.6% this morning to $95.4/b.
The cease-fire is expiring tomorrow. The US has said it will send a delegation for a second round of negotiations in Islamabad in Pakistan. But Iran has for now rejected a second round of talks as it views US demands as unrealistic and excessive while the US is also blocking the Strait of Hormuz.
While Brent is up 5% this morning, the financial market is still very optimistic that progress will be made. That talks will continue and that the SoH will fully open by the start of May which is consistent with a rest-of-year average Brent crude oil price of around $90/b with the market now trading that balance at around $88/b.
Financial optimism vs. physical deterioration. We have a divergence where the financial market is trading negotiations, improvements and resolution while at the same time the physical market is deteriorating day by day. Physical oil flows remain constrained by disrupted flows, longer voyage times and elevated freight and insurance costs.
Financial markets are betting that a US/Iranian resolution will save us in time from violent shortages down the road. But every day that the SoH remains closed is bringing us closer to a potentially very painful point of shortages and much higher prices.
The US blockade is also a weapon of leverage against its European and Asian allies. When Iran closed the SoH it held the world economy as a hostage against the US. The US blockade of the SoH is of course blocking Iranian oil exports. But it is also an action of disruption directed towards Europe and Asia. The US has called for the rest of the world to engaged in the war with Iran: ”If you want oil from the Persian Gulf, then go and get it”. A risk is that the US plays brinkmanship with the global oil market directed towards its European and Asian allies and maybe even towards China to force them to engage and take part. Maybe unthinkable. But unthinkable has become the norm with Trump in the White House.


Sommarväder skapar prisrally på elbörsen
Oil product price pain is set to rise as the Strait of Hormuz stays closed into summer

Solkraften pressar elpriserna dagtid

Michel Gubel ger sin syn på oljemarknaden