

Analys
US crude oil 2018 production forecast by EIA still too low

 Price action – Higher on Nigeria strike, Fortis pipeline outage, lower oil rig count, softer USD and positive equities
Brent crude is gaining 0.9% this morning as it climbs to $63.8/b along with a 0.2% softer USD index and positive equity gains. A part of the positive oil price drive today is the Nigerian oil union declaring a strike as they protest against unfair labour practices thus posing a risk to Nigeria’s production of 1.7 mb/d. The Fortis pipeline carrying xxx kb/d is still off-line with the operator declares force majeure as it expects repairs of the hairline will take some 2-4 weeks. The key concern is that there might be a wider problem stretching along the whole pipeline. If the reason for the current crack is the higher sulphur content in the Buzzard crude flowing in the Fortis crude stream and sulphide corrosion as a consequence of this then the outage of the pipe could be much, much longer. The pipe carries some 450 kb/d and thus a major share of the physical supply into the Brent spot market. A decline of 2 US oil rigs last week adds some support on the margin.
Crude oil comment – US crude oil 2018 production forecast by EIA still too low
Later today we’ll have the monthly update from the US EIA on shale oil drilling productivity in the US. We expect the EIA to revise its productivity as well as its production higher. Their last productivity report had data points to Dec 2017. We expect the EIA to show that the strong production growth of on average 91 kb/d/mth from July to December this year stays intact at around 90 kb/d/mth also in January and also that well completions continued to rise also in November as they have done every month since January this year.
We do not think that the EIA update later today will necessarily hit the Brent crude oil price bearishly. More likely we expect the Brent to WTI price spread to widen further on the back of such news.
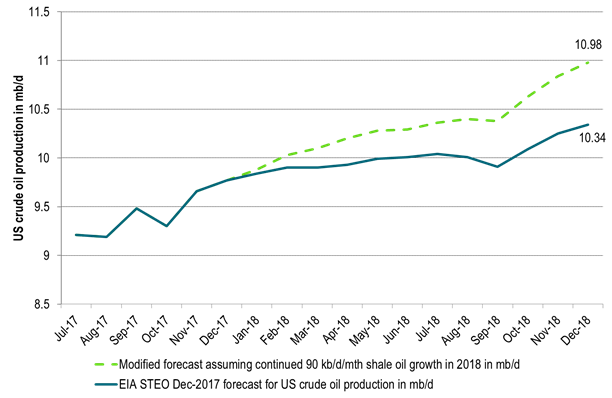
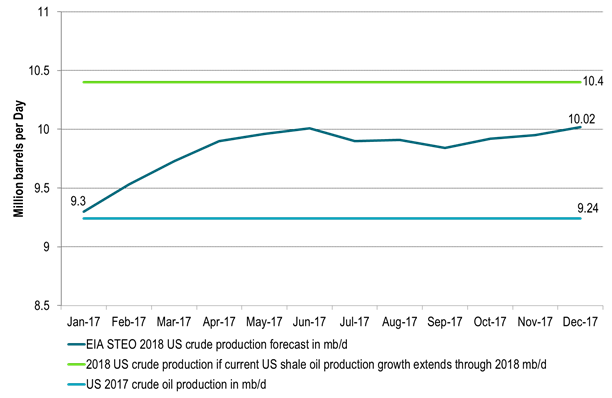
The US EIA last Tuesday adjusted its 2018 forecast for US crude oil production upwards from 9.95 mb/d to an average of 10.02 mb/d thus growing 0.78 mb/d y/y to 2018. The increase in forecast of 70 kb/d was the third upwards revision in three months. We still think that the US EIA is significantly behind the curve in terms of its projections for US crude oil production for 2018. As such we expect the US EIA to continue to revise its projection for 2018 higher in the months to come until it reaches at least an average crude oil production of around 10.4 mb/d for 2018.
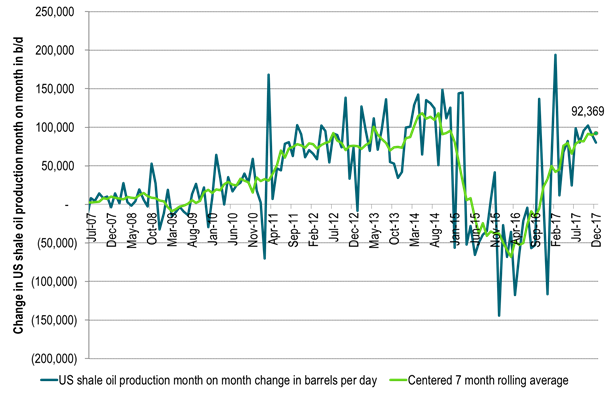
US shale oil production growth is currently running at some 90 kb/d/mth. That is the exit shale oil growth rate for 2017 while the average growth rate from July to December has been 91 kb/d/mth. The implied marginal, annualized production growth rate is thus currently running at 1.1 mb/d/yr. The US EIA is however assuming that US shale oil production will only grow by some 37 kb/d/mth in 2018. That is 40% lower than the current growth rate in shale oil production. From Dec-17 to Dec-18 the EIA projects that US lower 48 (ex GoM) will grow by only 440 kb/d. If we instead apply the current 90 kb/d/mth growth rate through 2018 then L48 ex GoM would grow by 1.1 mb/d from Dec-17 to Dec-18.
If we extrapolate the current shale oil production growth rate through 2018 it would lead US crude oil production to exit 2018 at 11 mb/d versus EIA’s forecast of 10.34 mb/d. If we include NGLs, Bio-fuels and refinery gains it would lift total US liquids production to close to 18 mb/d in December 2018 and drive total US liquids production growth to 1.7 mb/d y/y Dec-17 to Dec-18.
US shale oil well completions is still rising (+35 wells m/m in October), the drilled but uncompleted numbers of wells is still rising and oil prices have been on a constant trend upwards since mid-June . So if anything the current trend is for stronger US shale oil production growth month/month in the months ahead and not at all the sudden drop-off in shale oil production growth which the EIA predicts for 1Q18 where they expect a monthly average growth rate of only 23 kb/d/mth.
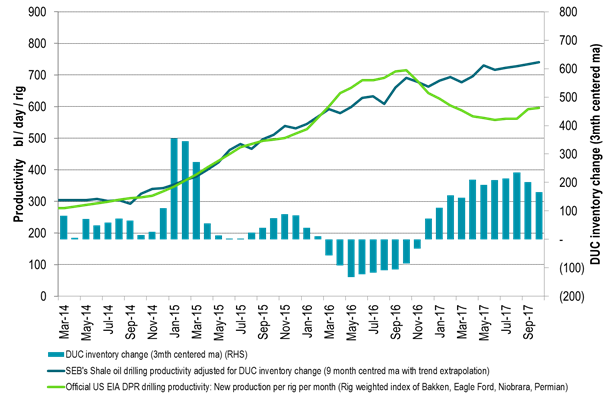
We think that one of the key reasons for why the US EIA has a too low production growth target for 2018 is due to the build-up in the DUC (Drilled but uncompleted wells) inventory which gives an impression of declining shale oil volume productivity. This decline in volume productivity is in our view not real. In our calculations we see US shale oil volume drilling productivity has continued to tick higher even though now mostly sideways. But at least we do not see productivity in decline as the official headline numbers indicate.
There is a lot of focus on a shift in investor focus from rewarding production growth and now instead demanding profits. This could possibly change shale oil producer behaviour and as such lead to softer US shale oil production growth than indicated above.
In our view such a shift should primarily hit drilling rather than completions as the shale oil companies have a huge stack of uncompleted wells which they can convert to oil and money in 2018. They can ease back on the drilling and continue to ramp up completions. Completions have been trailing drilling for a full year now. If shale oil companies pull back on investments then this should switch around in 2018 to a situation where drilling is lower than completions while spending on completions continues at a high level and drilling at a lower. Completions in 2018 could run some 20% above the Jan to Oct average completion level of 2017.
In terms of capex spending we had news last week that Keane Group, one of the largest pure-play providers of US shale completion services yesterday announced that they will order three new frac fleets on top of their existing 26. The order is a response to robust 2018 US shale oil investments announced latest weeks. Completions are the thing for 2018 which means more shale oil production.
Ch1: US shale oil production growth is exiting 2017 at a rate of about 90 kb/d/mth (1.1 mb/d on a marginal annualized rate)
It is now growing as strongly as it did through 2012 and 2013
Ch2: If US shale oil production grows in 2018 as it exits 2017 (~90 kb/d/mth) then total US crude production will grow by 1.1 mb/d y/y to 10.4 mb/d y/y
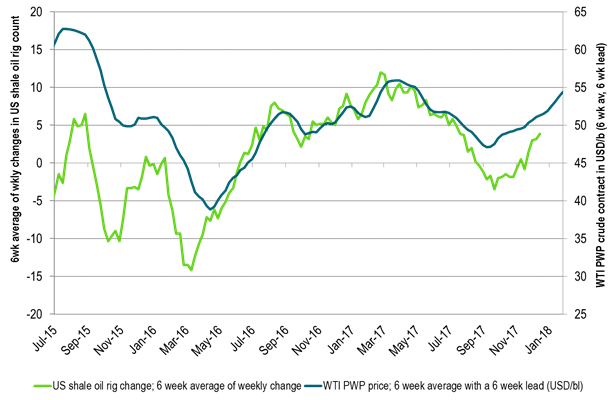
Ch3: The Production Weighting Price (PWP) of a new shale oil well with a 6 week lead has moved higher since Sep
If history is anything to go by then US shale oil action will increase in response. Drilling and or completions
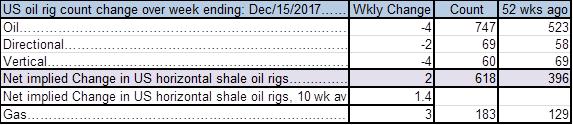
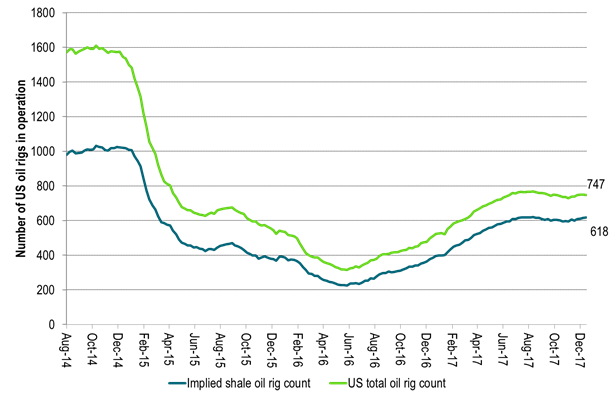
Ch4: US oil rig count moved down 4 last week but implied shale oil rigs increased by 2
US oil rig count is up by 22 over the last 5 weeks which is 17 rigs shy of the level in August
Ch5: The mirage of declining shale oil productivity created from the large build-up in DUCs (uncompleted wells)
The official US shale oil productivity was running higher than our estimate during the DUC draw down in 2016.
It is running way below our productivity estimate in 2017 during a huge build up in the DUC inventory during 2017.
As the DUC inventory eventually draws down the official productivity will again be running above our estimate
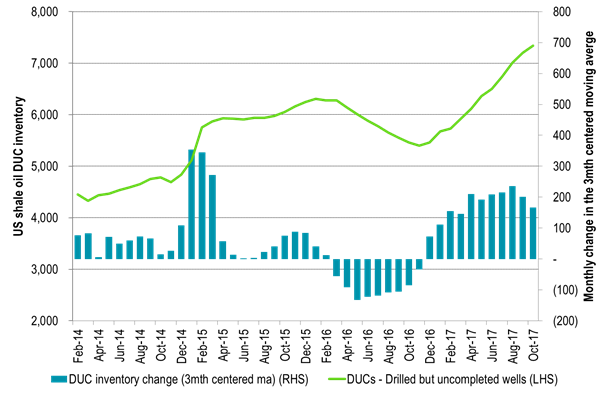
Ch6: A lot of uncompleted wells to complete in 2018!!
The DUC inventory was still BUILDING in October (the last data point)
So drilling new wells can decline a lot in 2018 while completions can increase some 20% y/y
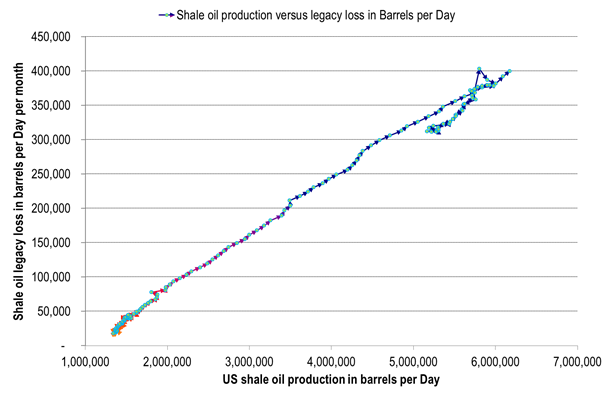
Ch7: No top-down sign that US shale oil resources are deteriorating as losses in existing production stays on scale to production level
No top-down sign as of yet of run-away losses in existing production versus production level
Ch8: US EIA crude oil production forecast likely to be lifted further up towards 10.4 mb/d
EIA lifting it forecast 3 mths in a row
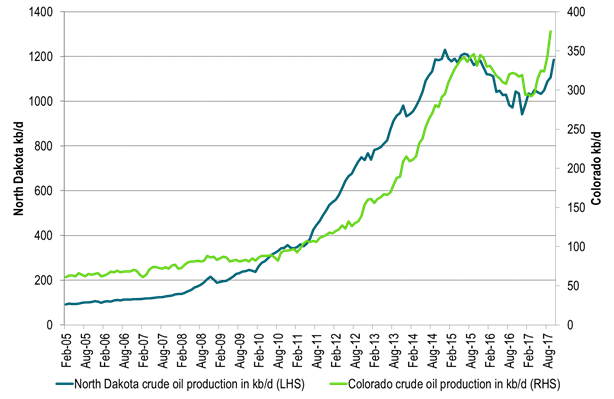
Ch9: Volume wise there are good shale oil days in both Colorado and Bakken North Dakota these days
Ch10: Annualized 1-3 mth Brent backwardation fully funded roll-yield of 10% pa
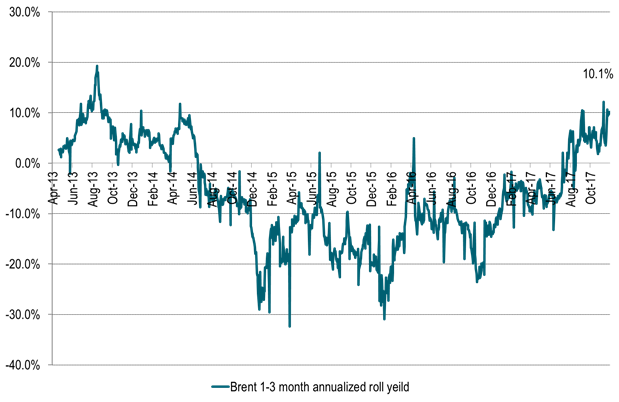
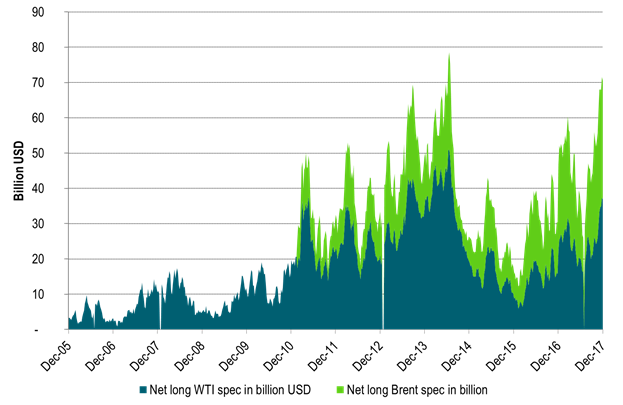
Ch11: The positive roll-yield in Brent continues to suck in more long spec into both Brent and WTI front end crude’
Kind regards
Bjarne Schieldrop
Chief analyst, Commodities
SEB Markets
Merchant Banking
Down on Friday. Up on Monday. The Brent June crude oil contract traded down 5.1% last week to a close of $90.38/b. It reached a high of $103.87/b last Monday and a low of $86.09/b on Friday as Iran announced that the Strait of Hormuz was fully open for transit. That quickly changed over the weekend as the US upheld its blockade of Iranian oil exports while Iran naturally responded by closing the SoH again. The US blew a hole in the engine room of the Iranian ship TOUSKA and took custody of the ship on Sunday. Brent crude is up 5.6% this morning to $95.4/b.

The cease-fire is expiring tomorrow. The US has said it will send a delegation for a second round of negotiations in Islamabad in Pakistan. But Iran has for now rejected a second round of talks as it views US demands as unrealistic and excessive while the US is also blocking the Strait of Hormuz.
While Brent is up 5% this morning, the financial market is still very optimistic that progress will be made. That talks will continue and that the SoH will fully open by the start of May which is consistent with a rest-of-year average Brent crude oil price of around $90/b with the market now trading that balance at around $88/b.
Financial optimism vs. physical deterioration. We have a divergence where the financial market is trading negotiations, improvements and resolution while at the same time the physical market is deteriorating day by day. Physical oil flows remain constrained by disrupted flows, longer voyage times and elevated freight and insurance costs.
Financial markets are betting that a US/Iranian resolution will save us in time from violent shortages down the road. But every day that the SoH remains closed is bringing us closer to a potentially very painful point of shortages and much higher prices.
The US blockade is also a weapon of leverage against its European and Asian allies. When Iran closed the SoH it held the world economy as a hostage against the US. The US blockade of the SoH is of course blocking Iranian oil exports. But it is also an action of disruption directed towards Europe and Asia. The US has called for the rest of the world to engaged in the war with Iran: ”If you want oil from the Persian Gulf, then go and get it”. A risk is that the US plays brinkmanship with the global oil market directed towards its European and Asian allies and maybe even towards China to force them to engage and take part. Maybe unthinkable. But unthinkable has become the norm with Trump in the White House.
Wild moves yesterday. Brent crude traded to a high of $114.43/b and a low of $96.0/b and closed at $99.94/b yesterday.
US – Iran negotiations ongoing or not? What a day. Donald Trump announced that good talks were ongoing between Iran and the US and that the 48 hour deadline before bombing Iranian power plants and energy infrastructure was postponed by five days subject to success of ongoing meetings. Iranian media meanwhile stated that no meetings were ongoing at all.
Today we are scratching our heads trying to figure out what yesterday was all about.
Friends and family playing the market? Was it just Trump and his friends and family who were playing with oil and equity markets with $580m and $1.46bn in bets being placed by someone in oil and equity markets just 15 minutes before Trump’s announcement?
Was Trump pulling a TACO as he reached his political and economic pain point: Brent at $112/b, US Gas at $4/gal, SPX below 200dma and US 10yr above 4.4%?
Different Iranian factions with Trump talking with one of them? Are there real negotiations going on but with the US talking to one faction in Iran while another, the hardliners, are not involved and are denying any such negotiations going on?
Extending the ultimatum to attack and invade Kharg island next weekend? Or, is the five day delay of the deadline a tactical decision to allow US amphibious assault ships and marines to arrive in the Gulf in the upcoming weekend while US and Israeli continues to degrade Iranian military targets till then. And then next weekend a move by the US/Israel to attack and conquer for example the Kharg island?
We do not really know which it is or maybe a combination of these.
We did get some kind of TACO ydy. But markets have been waiting for some kind of TACO to happen and yesterday we got some kind of TACO. And Brent crude is now trading at $101.5/b as a result rather than at $112-114/b as it did no the high yesterday.
But what really matters in our view is the political situation on the ground in Iran. Will hardliners continue to hold power or will a more pragmatic faction gain power?
If the hardliners remain in power then oil pain should extend all the way to US midterm elections. The hardliners were apparently still in charge as of last week. Iran immediately retaliated and damaged LNG infrastructure in Qatar after Israel hit Iranian South Pars. The SoH was still closed and all messages coming out of Iran indicated defiance. Hardliners continues in power has a huge consequence for oil prices going forward. The regime has played its ’oil-weapon’ (closing or chocking the Strait of Hormuz). It is using it to achieve political goals. Deterrence: it needs to be so politically and economically expensive to attack Iran that it won’t happen again in the future. Or at least that the US/Israel thinks 10-times over before they attack again. The highest Brent crude oil closing price since the start of the war is $112.19/b last Friday. In comparison the 20-year inflation adjusted Brent price is $103/b. So Brent crude last Friday at $112.19/b isn’t a shockingly high price. And it is still far below the nominal high of $148/b from 2008 which is $220/b if inflation adjusted. So once in a lifetime Iran activates its most powerful weapon. The oil weapon. It needs to show the power of this weapon and it needs to reap political gains. Getting Brent to $112/b and intraday high of $119.5/b (9 March) isn’t a display of the power of that weapon. And it is not a deterrence against future attacks.
So if the hardliners remain in power in Iran, then the SoH will likely remain chocked all the way to US midterm elections and Brent crude will at a minimum go above the historical nominal high of $148/b from 2008.
Thus the outlook for the oil price for the rest of the year doesn’t depend all that much of whether Trump pulls a TACO or not. Stops bombing or not. It depends more on who is in charge in Iran. If it is the hardliners, then deterrence against future attacks via chocking of the SoH and high oil prices is the likely line of action. It is impacting the world but the Iranian ’oil-weapon’ is directed towards the US president and the the US midterm elections.
If a pragmatic faction gets to power in Iran, then a very prosperous future is possible. However, if power is shifting towards a more pragmatic faction in Iran then a completely different direction could evolve. Such a faction could possibly be open for cooperation with the US and the GCC and possibly put its issues versus Israel aside. Then the prosperity we have seen evolving in Dubai could be a possible future also for Iran.
So far it looks like the hardliners are fully in charge. As far as we can see, the hardliners are still fully in control in Iran. That points towards continued chocking of the SoH and oil prices ticking higher as global inventories (the oil market buffers) are drawn lower. And not just for a few more weeks, but possibly all the way to the US midterm elections.
A brief sigh of relief yesterday as oil infra at Kharg wasn’t damaged. But higher today. Brent crude dabbled around a bit yesterday in relief that oil infrastructure at Iran’s Kharg island wasn’t damaged. It traded briefly below the 100-line and in a range of $99.54 – 106.5/b. Its close was near the low at $100.21/b.
No easy victorious way out for Trump. So no end in sight yet. Brent is up 3.2% today to $103.4/b with no signs that the war will end anytime soon. Trump has no easy way to declare victory and mission accomplished as long as Iran is in full control of the Strait of Hormuz while also holding some 440 kg of uranium enriched to 60% and not far from weapons grade at 90%. As long as these two factors are unresolved it is difficult for Trump to pull out of the Middle East. Naturally he gets increasingly frustrated over the situation as the oil price and US retail gas prices keeps ticking higher while the US is tied into the mess in the Middle East. Trying to drag NATO members into his mess but not much luck there.
When commodity prices spike they spike 2x, 3x, 4x or 5x. Supply and demand for commodities are notoriously inflexible. When either of them shifts sharply, the the price can easily go to zero (April 2022) or multiply 2x, 3x, or even 5x of normal. Examples in case cobalt in 2025 where Kongo restricted supply and the price doubled. Global LNG in 2022 where the price went 5x normal for the full year average. Demand for tungsten in ammunition is up strongly along with full war in the middle east. And its price? Up 537%.
Why hasn’t the Brent crude oil price gone 2x, 3x, 4x or 5x versus its normal of $68/b given close to full stop in the flow of oil of the Strait of Hormuz? We are after all talking about close to 20% of global supply being disrupted. The reason is the buffers. It is fairly easy to store oil. Commercial operators only hold stocks for logistical variations. It is a lot of oil in commercial stocks, but that is predominantly because the whole oil system is so huge. In addition we have Strategic Petroleum Reserves (SPRs) of close to 2500 mb of crude and 1000 mb of oil products. The IEA last week decided to release 400 mb from global SPR. Equal to 20 days of full closure of the Strait of Hormuz. Thus oil in commercial stocks on land, commercial oil in transit at sea and release of oil from SPRs is currently buffering the situation.
But we are running the buffers down day by day. As a result we see gradually increasing stress here and there in the global oil market. Asia is feeling the pinch the most. It has very low self sufficiency of oil and most of the exports from the Gulf normally head to Asia. Availability of propane and butane many places in India (LPG) has dried up very quickly. Local prices have tripled as a result. Local availability of crude, bunker oil, fuel oil, jet fuel, naphtha and other oil products is quickly running down to critical levels many places in Asia with prices shooting up. Oman crude oil is marked at $153/b. Jet fuel in Singapore is marked at $191/b.
Oil at sea originating from Strait of Hormuz from before 28 Feb is rapidly emptied. Oil at sea is a large pool of commercial oil. An inventory of oil in constant move. If we assume that the average journey from the Persian Gulf to its destinations has a volume weighted average of 13.5 days then the amount of oil at sea originating from the Persian Gulf when the the US/Israel attacked on 28 Feb was 13.5 days * 20 mb/d = 269 mb. Since the strait closed, this oil has increasingly been delivered at its destinations. Those closest to the Strait, like Pakistan, felt the emptying of this supply chain the fastest. Propane prices shooting to 3x normal there already last week and restaurants serving cold food this week is a result of that. Some 50-60% of Asia’s imports of Naphtha normally originates from the Persian Gulf. So naphtha is a natural pain point for Asia. The Gulf also a large and important exporter of Jet fuel. That shut in has lifted jet prices above $200/b.
To simplify our calculations we assume that no oil has left the Strait since that date and that there is no increase in Saudi exports from Yanbu. Then the draining of this inventory at sea originated from the Persian Gulf will essentially look like this:
The supply chain of oil at sea originating from the Strait of Hormuz is soon empty. Except for oil allowed through the Strait of Hormuz by Iran and increased exports from Yanbu in the Red Sea. Not included here.

Oil at sea is falling fast as oil is delivered without any new refill in the Persian Gulf. Waivers for Russian crude is also shifting Russian crude to consumers. Brent crude will likely start to feel the pinch much more forcefully when oil at sea is drawn down another 200 mb to around 1000 mb. That is not much more than 10 days from here.

Oil and oil products are starting to become very pricy many places. Brent crude has still been shielded from spiking like the others.


Market Still Betting on Timely Resolution, But Each Day Raises Shortage Risk

Christian Kopfer om läget för oljan

Marknaden måste börja betrakta de höga kopparpriserna som det nya normala

Det fysiska spotpriset på brentolja har slagit nytt rekord

40 minuter med Javier Blas om hur världen verkligen påverkas av energikrisen
40 minuter med Javier Blas om hur världen verkligen påverkas av energikrisen

Elpriserna fördubblas, stor osäkerhet inför sommaren

MP Materials, USA:s svar på Kinas dominans över sällsynta jordartsmetaller
Det fysiska spotpriset på brentolja har slagit nytt rekord

Studsvik har idag ansökt om att få bygga 1200-1600 MW kärnkraft i Valdemarsvik
-
 Nyheter3 veckor sedan
40 minuter med Javier Blas om hur världen verkligen påverkas av energikrisen
-
 Nyheter4 veckor sedan
Elpriserna fördubblas, stor osäkerhet inför sommaren
-
 Nyheter4 veckor sedan
MP Materials, USA:s svar på Kinas dominans över sällsynta jordartsmetaller
-
 Nyheter2 veckor sedan
Det fysiska spotpriset på brentolja har slagit nytt rekord
-
 Nyheter4 veckor sedan
Studsvik har idag ansökt om att få bygga 1200-1600 MW kärnkraft i Valdemarsvik
-
 Nyheter2 veckor sedan
Marknaden måste börja betrakta de höga kopparpriserna som det nya normala
-

 Nyheter4 veckor sedan
Matproduktion är beroende av gödsel, Gulfkriget skapar brist
-
Analys4 veckor sedan
TACO (or Whatever It Was) Sends Oil Lower — Iran Keeps Choking Hormuz