

Analys
Price action Rebounding from $50/b but running into headwind from stronger USD

 SEB Brent crude front month price forecast:
Q2-17: $57.5/b
Q3-17: $55.0/b
Q4-17: $52.5/b
Price action – Rebounding from $50/b but running into headwind from stronger USD
After having touched a low of $49.71/b last Wednesday Brent crude front month contract revived to touch a high of $53.1/b yesterday. This morning it is trading down 0.4% at $52.7/b. Prices found good support at the $50/b level with a solid influx of natural oil consumers jumping in securing forward hedges at lower levels. The oil price recovery over the last week is however facing headwinds from a 1.3% stronger USD and might thus run out of steam.
Crude oil comment – No reason for OPEC to roll cuts into H2
There seems to be an almost unanimous view that OPEC will roll their H1-17 cuts into H2-17. We cannot really understand why they should do that. OECD inventories declined all through the second half of 2016 and ended down y/y in December for the first time in quite a few years. And that was without the help of OPEC! The market has been confused by the fact that inventories in weekly data rose some 100 mb through the first two and a half months of the year. The market was also disappointed when it heard that OECD inventories rose 48 mb month/month in January. Do note however that the normal seasonal pattern is for OECD inventories to rise by 30 mb in January. Thus they only rose by 18 mb more than normal. Total crude and product stocks in the US have declined 4 weeks out of the last 6 weeks and we strongly believe that inventories will declined steadily from here onwards. When OPEC meets in Vienna on May 25th the perspective will be
1) Declining inventories (i.e. market is in balance to deficit)
2) A flat to backwardated crude oil curve. I.e. no spot price discount to longer dated contracts
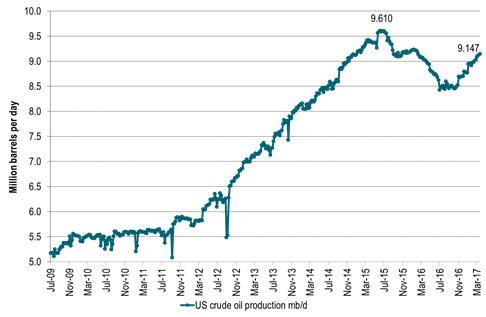
3) US crude production standing close to previous peak and rising rapidly
4) Demand will jump some 1.9 mb/d from H1-17 og H2-17 seasonally with little risk for surplus
Thus the natural communication from OPEC following their forthcoming May 25th meeting in Vienna would be that the market is in balance. Actually it is in deficit and inventories are drawing down. There is no longer a spot price discount to longer dated contracts. I.e. there is very little stress in the market due to surplus oil and OPEC receives no discounted cash flow versus longer dated prices. I.e. there is little economic reason for OPEC to cut as they then are receiving a fair price for their oil (equal to longer dated prices). A further cut would only endanger OPEC’s market share through unnecessary stimulus of US shale oil production. That last dimension will be highly accentuated at the meeting on the 25th of May since if we just extrapolate US crude oil production so far this year it may stand at 9.5 mb/d at their May meeting. US crude oil production is now growing just as fast (marginal annualized pace of 1.5 mb/d) as it did from 2011 to 2015. The hypothesis from OPEC’s November meeting in 2016 that US shale oil production will only recover gradually as long as the oil price stays below $60/b has been totally busted. The empirical evidence is that when the mid-term WTI curve (one to two year horizon forward prices) averaged $52/b in H2 then US shale oil rigs rose by 7 rigs/week. When those forward prices instead rose to $55-56/b following OPEC’s decision to cut the weekly rig additions rose to about 10 rigs/week.
OPEC is likely to conclude that all looks good. Market is in balance to deficit. Inventories are drawing down. There is no longer any spot price rebate in the market and little stress from surplus oil to be seen. Demand will rise strongly into H2-17. Thus OPEC is likely to move back into operation putting their 1.16 mb/d H1-17 cut aside and revisit the question of cuts at their next meeting in Vienna at the end of 2017. They will like to look like they are in control and an extension of cuts into H2-17 will stimulate US shale oil production to an extent that will make it look like they are out of control.
We expect crude oil prices to get a brief set-back when OPEC announces such a decision. But we do expect it to be brief and with limited consequences. We expect Brent crude oil prices to end the year with an average of $52.5/b in Q4-17. We expect the curve to be some $3/b in backwardation at that time which implies that the one to two year forward prices at that time will trade around $50/b. Since the WTI curve is trading at some $2/b below the Brent crude curve it will mean that the mid-term (1 to 2 year forward) WTI crude oil curve will then trade at around $48/b. We expect that to dampen the current very strong weekly rig additions which we see currently.
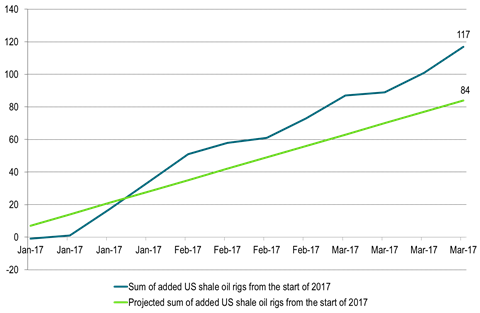
Ch1: US shale oil rigs continues to rise strongly
Last week the number of US shale oil rigs rose by 16 rigs or 9 rigs more than our projection
So far the average weekly US shale oil rig additions stands at 9.75 rigs/week
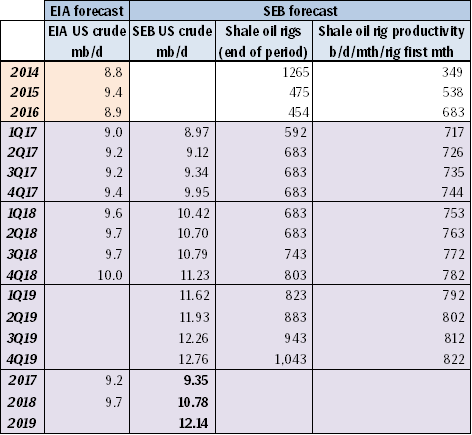
Ch2: SEB US crude oil production projection lifted by 12 kb/d in 2017, by 49 kb/d in 2018 and by 68 kb/d in 2019
Total additional cumulative US crude oil production over the next three years rose by 47 million barrels as a result of 16 rigs being added last week versus our expected 7 rigs
We expect the US EIA to lift its US crude oil production projection again in its forthcoming April report reflecting the fact that 51 shale oil rigs were added to the market in March.
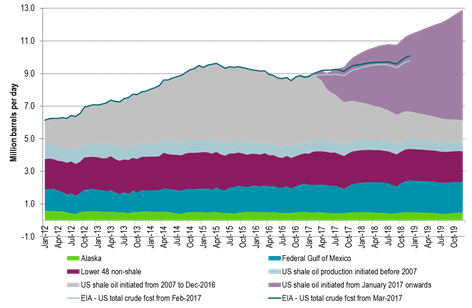
Ch3: SEB US crude oil production projection graph
Ch4: SEB global crude oil supply demand balance
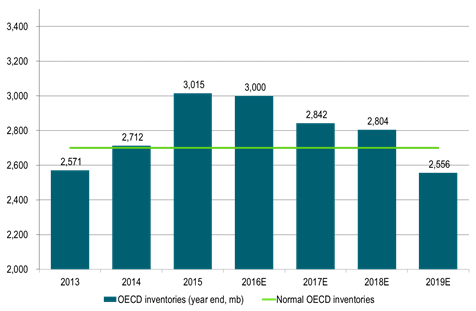
Ch5: SEB projected OECD end of year inventories
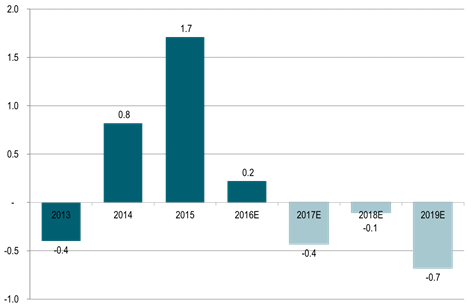
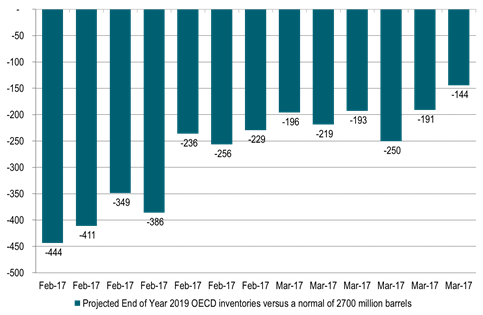
Ch6: Time development of SEB’s projected 2019 end of year OECD oil inventories versus a normal of 2700 million barrels
A deep draw in OECD inventories at the end of 2019 has become much less pronounced as rig count is rising much faster than expected thus lifting our US crude oil production projection
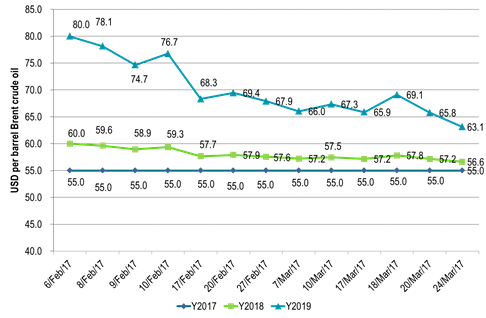
Ch6: Time development of SEB’s dynamic Brent crude oil price forecast
Much less price squeeze risk in 2019 as the balance has softened with higher US production projection
Ch7: US crude oil production increasing in a stright line
Potentially closing in at 9.5 mb/d when OPEC meets in Vienna on May 25th
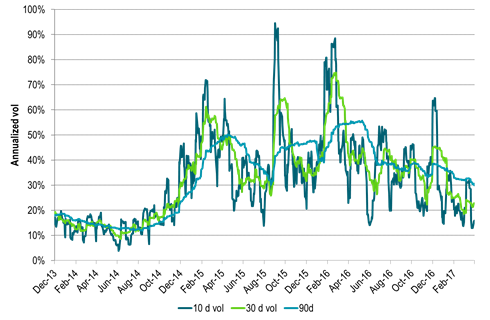
Ch8: Volatility is trending lower with yet more downside to come we expect
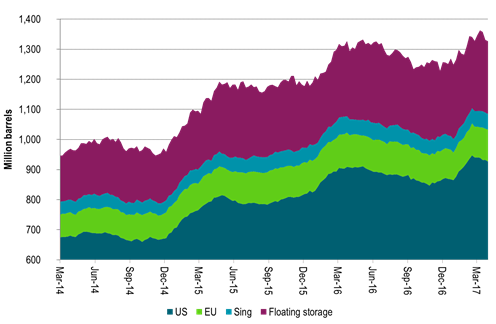
Ch9: Weekly inventory data are starting to show a draw
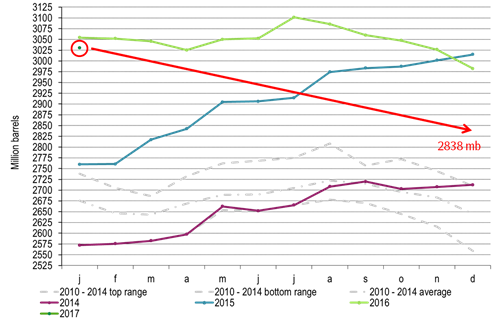
Ch10: And this is what we expect OECD inventories will do in 2017 (We assume OPEC will not cut in H2-17)
But due to US shale oil revival there won’t be much draws in 2018
Thus all through 2017 and 2018 the OECD inventories will stay above normal with few pressure points in the global oil market
Kind regards
Bjarne Schieldrop
Chief analyst, Commodities
SEB Markets
Merchant Banking
Selling down on a ”deal”. Brent crude fell 6.2% last week with accelerated weakness towards the end of the week. Close of the week at $87.33/b and low of the week (and on Friday) of $85.8/b. Brent is falling another 4% this morning to $83.7/b on confirmation by Iran that a MoU text has been reached and that it will be signed on Friday this week.

So what is this ”deal” worth? Talk on the desk here this morning is that it is much like ”putting lipstick on a pig” where Trump has to sell this at home as a victory where ”the SoH has reopened”, the nuclear issue will be ironed out over the coming 60 days (or maybe 600 days?) and US consumers are getting a lower gasoline price and maybe US republicans survives the midterm elections.
The importance for Iran is that it emerges as the defacto winner of this war in the eyes of the non-US public world. That Iran now onwards is the ”ruler of the SoH” (combo of geography and new weapons systems like drones) or more softer: ”the guarantor of safe passage through the SoH”.
Iran doesn’t need nuclear weapons any more. Nuclear deterrence doesn’t work any more. Ukraine has made many attacks deep into Russia without being nuked in return. Plenty of Iranian ballistic rockets blasts over Israel but Iran wasn’t nuked in return.
There is no trust between the US and Iran. We don’t know all the details yet of the MoU. But what we do know is that there is no trust between the US and Iran what so ever. This is probably more like a descriptive text on how they can cooperate in a way where both sides keeps tactical leverage. Neither side makes irreversible concessions. Violations can be punished quickly. Cooperation produces immediate benefits.
This is a fragile structure. It can easily break down. There may be details which cannot be overcome. To be seen on Friday. The US has to show that it is willing put enough force behind managing and restraining Israel versus Hezbollah in Lebanon. We have seen that Netanyahu hasn’t listened all that much to Trump’s directives and wishes. This could be a major obstacle.
A gradual reopening is tactically preferable for Iran. A tactical leverage for Iran right now is that global oil stocks have been drawn down towards painful and increasingly dangerous levels with increasing risks for oil price spikes in mid-July to August. This together with US midterm elections on 3 November gives tactical leverage to Iran. Iran probably doesn’t want to fully give up on that leverage. A rapid, full reopening where global stocks are able to refill over the coming 60 days will significantly erode that leverage. If Iran reinstates a closure of the SoH after 60 days (if talks break down again), then the effect won’t be that impactful in terms of prices and the US midterm elections.
So a gradual and partial reopening where global markets gets the oil they need while they are unable to rebuild stocks could be a practical middle way for both parties. Trump can sell it as ”the SoH has reopened” and get affordable gasoline for US consumers. Iran can sell it as ”the SoH has fully reopened, but there is some friction” so flow is only 60-80% of normal.
Not much real demand destruction below $100/b. What we do know is that there is not much real price pain demand destruction for oil globally at an oil price below $100/b. A lot of demand-shock destruction. Fear. But demand should now come roaring back towards normal with fear for exceptionally high prices now is rapidly receding.
Sudden China demand destruction due to EVs? Bullocks. EV share of total Chinese carpool now around 13%. Share of new sales of EVs has reached 50%. This is a very gradual process. It doesn’t make oil demand fall like a rock over night. When EV new sales share reaches 100%, then the gasoline car pool will contract by some 5-10% per year. But that is only gasoline. Sudden reduction in Chinese oil demand is more about shock and risk.
Chinese crude oil imports will come roaring back. At what price? Today’s ”neutral” oil price is $70/b. That is the five year price which has steadily traded around the $70/b mark over the past 3-4 years. With still a risky picture one would think that China and the rest of the world will be big buyers of oil in the range of $70-85/b.
Global demand will likely snap back towards normal, forecasted demand and growth at such prices.
Physical reopening is a gradual process. The physical and practical reopening of the SoH will likely be gradual rather than sudden. And that probably suites Iran tactically as well.
Brent M1 price versus the Brent 5-yr (today’s ”normal” price)

Market is starting to take US/Iran headlines with a pinch of salt. Brent crude rose $2.8/b yesterday to an official close of $112.1/b. But after that it traded as low as $108.05/b before ending late night at around $109.7/b. Through the day it traded in a range of $106.87 – 112.72/b amid a flurry of news or rumors from Iran and the US. ”US temporary sanctions during negotiations” (falls alarm). ”We will bomb Iran” (not anyhow),… etc. While the market is still fluctuating to this kind of news flow, it is starting to take such headlines with a pinch of salt.
We’ll see. Maybe, maybe not. The Brent M1 contract is trading at $110.2/b this morning which very close to the average ticks through yesterday of $110.4/b.
Trump with bearish, verbal intervention whenever Brent trades above $110/b it seems. What seems to be a pattern is that Trump states something like ”very good negotiations going on with Iran”, ”New leaders in Iran are great,..”, ”Great progress in negotiations,…”, ”Deal in sight,..” etc whenever the Brent M1 contract trades above $110/b. An effort to cool the market. These hot air verbal interventions from Trump used to have a heavy bearish impact on prices, but they now seems to have less and less effect unless they are backed by reality.
As far as we can see there has been no real progress in the negotiations between the US and Iran with both sides still standing by their previous demands.
Iran is getting stronger while the cease fire lasts making a return to war for Trump yet harder. Iran is naturally in constant preparation for a return to war given Trump’s steady threats of bombing Iran again. Iran is naturally doing what ever is possible to prepare for a return to war. And every day the cease fire lasts it is better prepared. This naturally makes it more and more difficult and dangerous for the US to return to warring activity versus Iran as the consequences for energy infrastructure in the Persian Gulf will be more and more severe the longer the cease fire lasts. Israel seems to see it this way as well. That the war is not won and that current frozen state of a cease fire gives Iran opportunity to rebuild military and politically.
Global inventories are drawing down day by day. How much? In the meantime the Strait of Hormuz stays closed. There is varying measures and estimates of how much global inventories are drawing down. Our rough estimate, back of the envelope, is that global inventories are drawing down by at least some 10 mb/d or about 300 mb/d in a balance between loss of supply versus demand destruction. Other estimates we see are a monthly draw of 250-270 mb/d. The IEA only ’measured’ a draw in global observable stocks of 117 mb in April with oil on water rising 53 mb while on shore stocks fell 170 mb. But global stocks are hard to measure with large invisible, unmeasured stocks. As such a back of the envelope approach may be better.
Oil products is what the world is consuming. Oil product prices likely to rise while product stocks fall. Strategic Petroleum Reserves (SPR) are predominantly crude oil. Discharging oil from OECD SPR stocks, a sharp reduction in Chinese crude imports and a reduction in global refinery throughput of 6-7 mb/d has helped to keep crude oil markets satisfactorily supplied. But global inventories are drawing down none the less. And oil products is really what the world is consuming. So if global refinery throughput stays subdued, then demand will eventually have to match the supply of oil products. The likely path forward this summer is a steady draw down in jet fuel, diesel and gasoline. Higher prices for these. Then, if possible, higher refinery throughput and higher usage of crude in response to very profitable refinery margins. And lastly sharper draw in crude stocks and higher prices for these. But some 6 mb/d of oil products used to be exported through the Strait of Hormuz. And it may not be so easy to ramp up refinery activity across the world to compensate. Especially as Ukraine continues to damage Russian refineries as well as Russian crude production and export facilities.
Watch oil product stocks and prices as well as Brent calendar 2027. What to watch for this summer is thus oil product inventories falling and oil product premiums to crude rising. Another measure to watch is the Brent crude 2027 contract as it rises steadily day by day as the Strait of Hormuz stays closed and global oil inventories decline. The latter is close to the highest level since the start of the war and keeps rising.
The Brent M1 contract and the Brent 2027 prices and current price of jet fuel in Europe (ARA). All in USD/b

Our back of the envelope calculation of the global shortage created by the closure of the Strait of Hormuz. Note that 3.5 mb/d of discharge from SPR is also a draw. Note also that ’Forced demand loss’ of 2.5 mb/d is probably temporary and will fall back towards zero as logistics are sorted out leaving ’Price demand loss’ to do the job of balancing the market. Thus a shortfall of at least 9 mb/d created by the closure. More if SPR discharge is included and more if Forced demand loss recedes.

Brent is climbing higher. Front-month is at USD 106.3/bl this morning, close to a weekly high and a USD 9/bl jump from Mondays open. This is the move we flagged as a risk earlier in the week: the market shifting from ”a deal is around the corner” to ”this is going to take longer than we thought”.

Analyst Commodities, SEB
During April, rest-of-year Brent remained remarkably stable around USD 90/bl. A stability which rested on one single assumption: the SoH reopens around 1 May. That assumption is now slowly falling apart.
As we highlighted yesterday: every week of delay beyond 1 May adds (theoretically) ish USD 5/bl to the rest-of-year average, as global inventories draw 100 million barrels per week. i.e., a mid-May reopening implies rest-of-year Brent closer to USD 100/bl, and anything pushing into June or July takes us meaningfully higher.
What’s changed in the last 48 hours:
#1: The US military has formally warned that clearing suspected sea mines from SoH could take up to six months. That is a completely different timescale from what the financial market is pricing. Even a political deal tomorrow does not immediately reopen the strait.
#2: Trump has shifted his tone from urgency to ”strategic patience”. In yesterday’s press conference: ”Don’t rush me… I want a great deal.” The market is reading this as a president no longer feeling pressured by timelines, with the naval blockade running in the background.
#3: So far, the military activity is escalating, not de-escalating. Axios reports Iran is laying more mines in SoH. The US 3rd carrier strike group (USS George H.W. Bush) is arriving with two countermine vessels. Trump yesterday ordered the US Navy to destroy any Iranian boats caught laying mines. While CNN reports that the Pentagon is actively drawing up plans to strike Iranian SoH capabilities and individual Iranian military leaders if the ceasefire collapses. i.e., NOT a attitude consistent with an imminent deal!
Spot crude and product prices eased off the early-April highs on a combination of system rerouting and deal optimism. Both now weakening. Goldman estimates April Gulf output is reduced by 14.5 mbl/d, or 57% of pre-war supply, a number that keeps getting worse the longer this drags on.
Demand-side adaptation is ongoing: S. Korea has cut its Middle East crude dependence from 69% to 56% by pulling more from the Americas and Africa, and Japan is kicking off a second round of SPR releases from 1 May. But SPRs are finite.
Ref. to the negotiations, we should not bet on speed. The current Iranian leadership is dominated by genuine hardliners willing to absorb economic pain and run the clock to extract concessions. That is not a setup for a rapid resolution. US/Israeli media briefings keep framing the delay as ”internal Iranian divisions”, the reality is more complicated and points toward weeks and months, not days.
Our point is that the complexity is large, and higher prices have only just started (given a scenario where the negotiations drag out in time). The market spent April leaning on the USD 90/bl rest-of-year assumption; that case is diminishing by the hour. If ”early May reopening” is replaced by ”June, July or later” over the next week or two, both crude and products have meaningful room to reprice higher from here. There is a high risk being short energy and betting on any immediate political resolution(!).


Vattenfalls och Industrikrafts kärnkraftsbolag Videberg Kraft har valt Rolls-Royce SMR
Selling down on a ”deal”

Sommarväder skapar prisrally på elbörsen
Oil product price pain is set to rise as the Strait of Hormuz stays closed into summer

Solkraften pressar elpriserna dagtid
Oil product price pain is set to rise as the Strait of Hormuz stays closed into summer
Sommarväder skapar prisrally på elbörsen
Vattenfalls och Industrikrafts kärnkraftsbolag Videberg Kraft har valt Rolls-Royce SMR
Selling down on a ”deal”
-
Analys4 veckor sedan
Oil product price pain is set to rise as the Strait of Hormuz stays closed into summer
-
Nyheter2 veckor sedan
Sommarväder skapar prisrally på elbörsen
-
 Nyheter2 dagar sedan
Vattenfalls och Industrikrafts kärnkraftsbolag Videberg Kraft har valt Rolls-Royce SMR
-
Analys3 dagar sedan
Selling down on a ”deal”