

Analys
Still upside to crude oil spot prices into Q2-17 but softer again in H2-17

 We expect front month Brent crude to head higher in Q2-17 to average $57.5/b but to toutch above $60/b at times.
Refineries will move back into operation consuming more oil. OPEC is delivering on cuts and inventories will decline.
US crude production is now growing (marginally, annualized) as fast as it did between 2012 and May 2015.
We expect OPEC to end cuts after H1-17 as mission is accomplished: Inventories are steady or declining and spot crude oil prices are equal to or higher than longer dated contracts. Not much more OPEC can do.
We expect the front month Brent crude oil price to fall back in H2-17 in the face of strongly rising US shale oil production and reviving OPEC production.
Brent crude front month price to average $52.5/b in Q4-17 toutching $50/b at times.
Higher than expected US shale oil rig additions since the start of the year has softening our projected deficit in 2019. However, we still see a substantial inventory draw below normal in 2019.
From the news flow:
Exxon will use 50% of its drilling budget for 2017 on US onshore drilling with its production there growing 20% pa to 2025
Libya’s crude oil production falls back again as clashes re-erupt
IEA: OPEC will increase its production capacity by 2 mb/d from 2016 to 2022 with Iraq lifting production to 5.4 mb/d in 2022
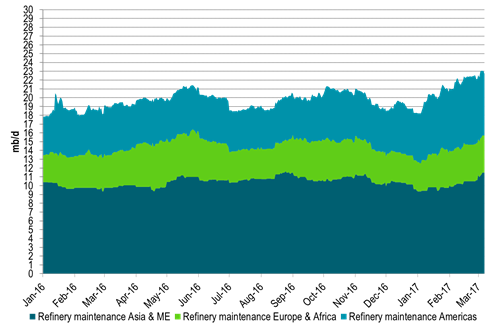
Ch1: Global refinery maintenance increased strongly in Q1-17 – Refineries soon to resume activity
A large increase in global refinery maintenance in Q1-17 left a comparble volume to be stored rather than processed
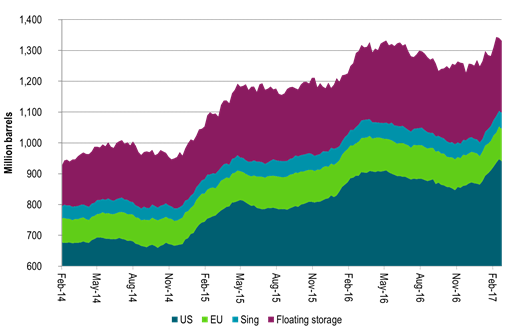
Ch2: Weekly inventories have rissen strongly in Q1-17 – Soon to decline.
OPEC also produced at record high level in Nov and Dec which has hit the market in Q1-17 along with several months of natural lag in the supply chain between production and consumption. Both helping to drive weekly inventory data up strongly in Q1-17
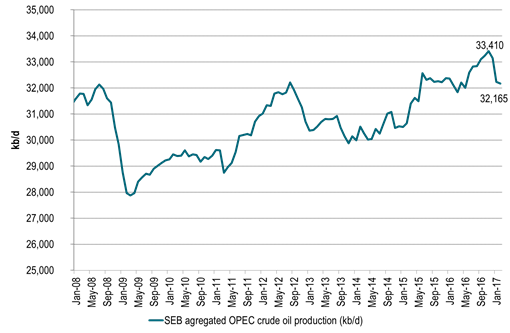
Ch3: OPEC delivers on cuts.
OPEC is delivering on its promises to cut. So when refineries move back on-line after maintenance and we also have the Nov and Dec OPEC production blob cleared out the the market we will see inventories starting to decline in Q2-17.
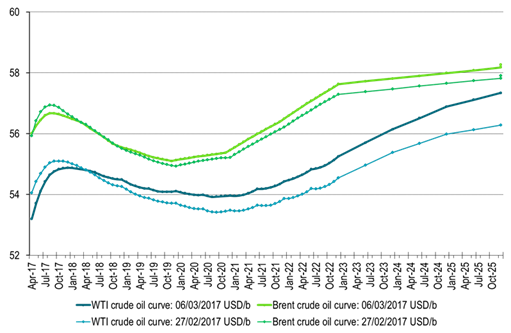
Ch4: Crude oil forward curve soon to move fully into backwardation
The forward crude curves will then move fully into backwardation with also the very front end of the curve (which is still in contango) moving into backwardation.
This is likely to lead front end Brent crude oil price up towards the $60/b mark with our expectation for an average Brent 1mth price of $57.5/b during Q2-17 touching $60/b at times.
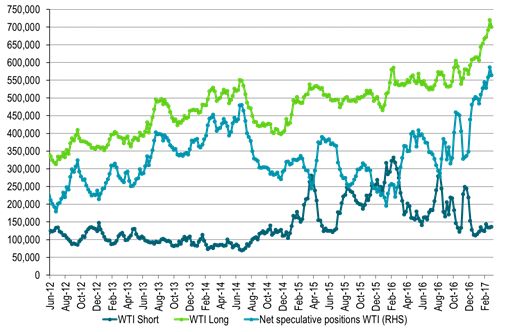
Ch5: Speculators are bullish awaiting that last move into full backwardation
And speculators are bullish accordingly – close to record high net long speculative position in WTI
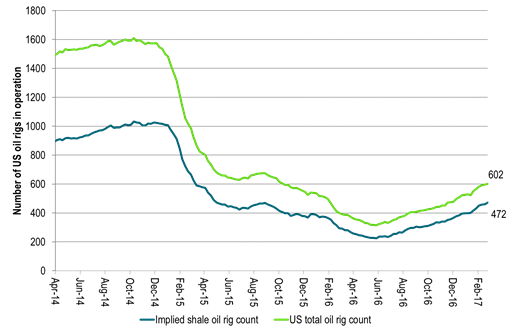
Ch6: US oil rig count moves higher and higher and higher
But US oil rigs are constantly added to the market and at a higher rate than we had expected.
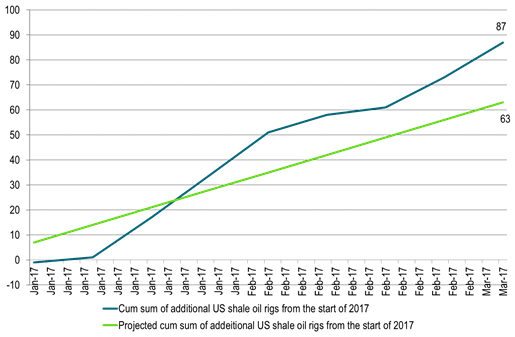
Ch7: More US shale oil rigs have been activated versus what we had expected
More shale oil rigs have been added into activity in the US shale oil space versus what we had expected
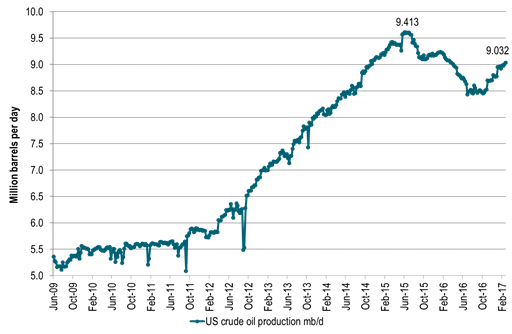
Ch8: Helping to shift US crude oil production growth back into full pre-2015 growth level again
US crude oil production is now on rising trend again adding on average 30 kb/d w/w since the start of the year.
That is equal to a marginal, annualized growth rate of 30 kb/d/week * 52 week = 1560 kb/d/year (1.5 mb/d marginal, annualized growth rate).
That is back to the growth rate seen between 2012 to June 2015.
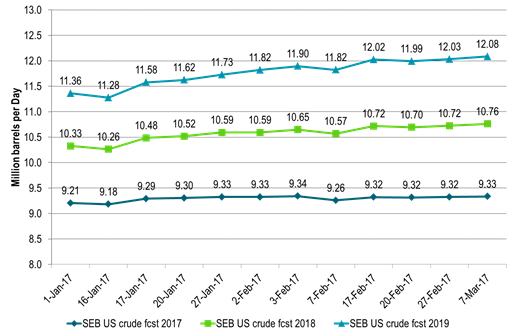
Ch9: More shale oil rigs than expected means higher forecasted US crude oil production than expected
This impacts our projected US crude oil production for 2017, 2018 and 2019 lifting it higher
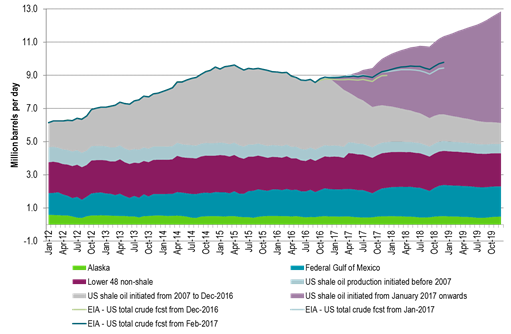
Ch10: With US crude oil production now expected to lift to close to 13 mb/d at the end of 2019
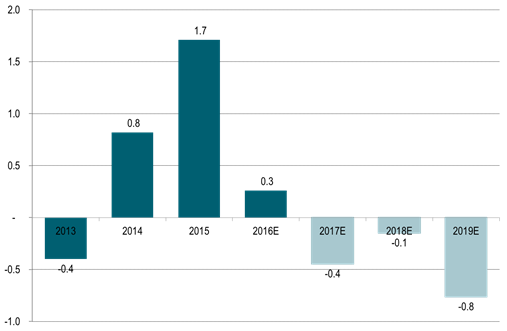
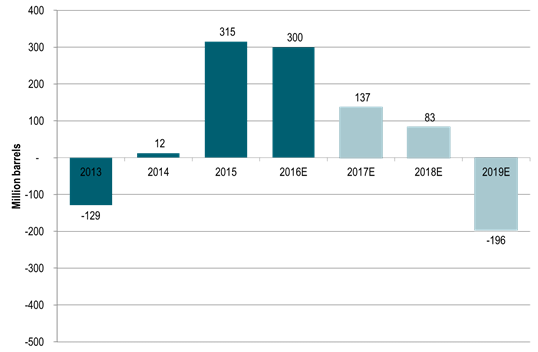
Ch11: Global supply/demand balance still in deficit next three years but not much deficit in 2018 any more
Almost constantly weakening and softening our projected supply/demand balance for the nearest three years.
With our view now that there will be almost no deficit in 2018.
But still a solid deficit and inventory draw coming in 2019 as cuts in investments in conventional supply since 2014 starts to hit the market.
Little conventional legacy investments to add additional supply in 2019 and thus little to counter natural declines in existing conventional production in 2019.
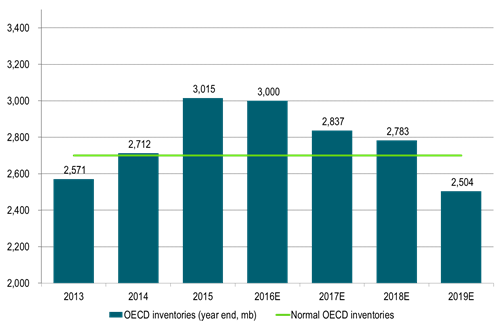
Ch12: End of year OECD inventories to draw substantially below normal in 2019
End of year OECD stocks still to draw substantially below a normal of 2700 million barrels in 2019.
But stocks are likely to end the year above normal for both 2017 and 2018.
Thus few pressure points in the global supply/demand balance during 2017 and 2018 as current elevated oil inventories provides a nice cushion
Ch13: End of year OECD inventories to stand some 200 mb below normal in December 2019
The year 2019 still looks like the year when things could happen to the oil price on the upside.
As end of year OECD inventories could draw down some 200 million barrels below normal
Unless of course demand growth weakens, US shale oil production accelerates even more or oil companies accelerate in-field drilling thus countering conventional declines.
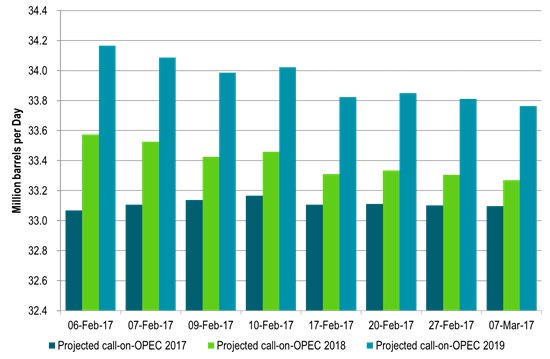
Ch14: Projected call on OPEC has declined since the start of February along with higher US crude oil production projections
As we steadily adjust our US crude oil production higher for 2017, 2018 and 2019 along with higher than expected additions of US shale oil rigs
The need for oil from OPEC declines comparably for the years to come
How far down is OPEC willing to let it slide? Probably not below 33 mb/d for 2018.
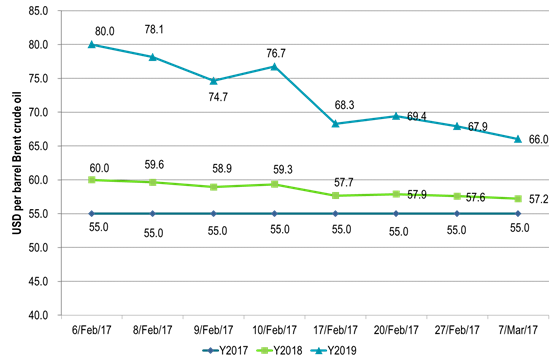
Ch15: Softer supply/demand balance naturally means softer prices
In a dynamic crude oil price forecasting frame the forecasted crude oil price declines along with with a softening forward looking supply/demand balance
(Prices in graph are mathematically extended from the $80/b forecasted at the start of February and are not new price forecast assessments)
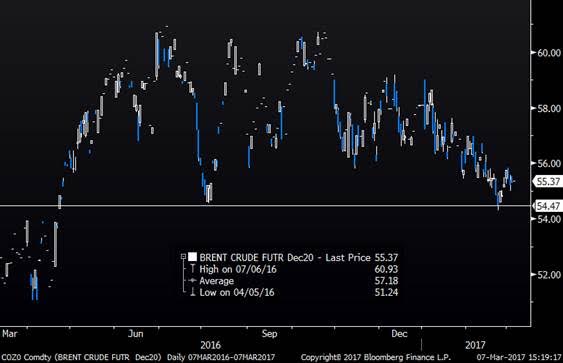
Ch16: Longer dated market prices have deteriorated since the start of the year
Longer dated contracts like Brent crude December 2020 have deteriorated since the start of the year
Probably reflecting the acceleration in US shale oil rig additions in Q1-17
In late February the contract traded at its lowest level since April 2016.
Kind regards
Bjarne Schieldrop
Chief analyst, Commodities
SEB Markets
Merchant Banking
Market is starting to take US/Iran headlines with a pinch of salt. Brent crude rose $2.8/b yesterday to an official close of $112.1/b. But after that it traded as low as $108.05/b before ending late night at around $109.7/b. Through the day it traded in a range of $106.87 – 112.72/b amid a flurry of news or rumors from Iran and the US. ”US temporary sanctions during negotiations” (falls alarm). ”We will bomb Iran” (not anyhow),… etc. While the market is still fluctuating to this kind of news flow, it is starting to take such headlines with a pinch of salt.

We’ll see. Maybe, maybe not. The Brent M1 contract is trading at $110.2/b this morning which very close to the average ticks through yesterday of $110.4/b.
Trump with bearish, verbal intervention whenever Brent trades above $110/b it seems. What seems to be a pattern is that Trump states something like ”very good negotiations going on with Iran”, ”New leaders in Iran are great,..”, ”Great progress in negotiations,…”, ”Deal in sight,..” etc whenever the Brent M1 contract trades above $110/b. An effort to cool the market. These hot air verbal interventions from Trump used to have a heavy bearish impact on prices, but they now seems to have less and less effect unless they are backed by reality.
As far as we can see there has been no real progress in the negotiations between the US and Iran with both sides still standing by their previous demands.
Iran is getting stronger while the cease fire lasts making a return to war for Trump yet harder. Iran is naturally in constant preparation for a return to war given Trump’s steady threats of bombing Iran again. Iran is naturally doing what ever is possible to prepare for a return to war. And every day the cease fire lasts it is better prepared. This naturally makes it more and more difficult and dangerous for the US to return to warring activity versus Iran as the consequences for energy infrastructure in the Persian Gulf will be more and more severe the longer the cease fire lasts. Israel seems to see it this way as well. That the war is not won and that current frozen state of a cease fire gives Iran opportunity to rebuild military and politically.
Global inventories are drawing down day by day. How much? In the meantime the Strait of Hormuz stays closed. There is varying measures and estimates of how much global inventories are drawing down. Our rough estimate, back of the envelope, is that global inventories are drawing down by at least some 10 mb/d or about 300 mb/d in a balance between loss of supply versus demand destruction. Other estimates we see are a monthly draw of 250-270 mb/d. The IEA only ’measured’ a draw in global observable stocks of 117 mb in April with oil on water rising 53 mb while on shore stocks fell 170 mb. But global stocks are hard to measure with large invisible, unmeasured stocks. As such a back of the envelope approach may be better.
Oil products is what the world is consuming. Oil product prices likely to rise while product stocks fall. Strategic Petroleum Reserves (SPR) are predominantly crude oil. Discharging oil from OECD SPR stocks, a sharp reduction in Chinese crude imports and a reduction in global refinery throughput of 6-7 mb/d has helped to keep crude oil markets satisfactorily supplied. But global inventories are drawing down none the less. And oil products is really what the world is consuming. So if global refinery throughput stays subdued, then demand will eventually have to match the supply of oil products. The likely path forward this summer is a steady draw down in jet fuel, diesel and gasoline. Higher prices for these. Then, if possible, higher refinery throughput and higher usage of crude in response to very profitable refinery margins. And lastly sharper draw in crude stocks and higher prices for these. But some 6 mb/d of oil products used to be exported through the Strait of Hormuz. And it may not be so easy to ramp up refinery activity across the world to compensate. Especially as Ukraine continues to damage Russian refineries as well as Russian crude production and export facilities.
Watch oil product stocks and prices as well as Brent calendar 2027. What to watch for this summer is thus oil product inventories falling and oil product premiums to crude rising. Another measure to watch is the Brent crude 2027 contract as it rises steadily day by day as the Strait of Hormuz stays closed and global oil inventories decline. The latter is close to the highest level since the start of the war and keeps rising.
The Brent M1 contract and the Brent 2027 prices and current price of jet fuel in Europe (ARA). All in USD/b

Our back of the envelope calculation of the global shortage created by the closure of the Strait of Hormuz. Note that 3.5 mb/d of discharge from SPR is also a draw. Note also that ’Forced demand loss’ of 2.5 mb/d is probably temporary and will fall back towards zero as logistics are sorted out leaving ’Price demand loss’ to do the job of balancing the market. Thus a shortfall of at least 9 mb/d created by the closure. More if SPR discharge is included and more if Forced demand loss recedes.

Brent is climbing higher. Front-month is at USD 106.3/bl this morning, close to a weekly high and a USD 9/bl jump from Mondays open. This is the move we flagged as a risk earlier in the week: the market shifting from ”a deal is around the corner” to ”this is going to take longer than we thought”.

Analyst Commodities, SEB
During April, rest-of-year Brent remained remarkably stable around USD 90/bl. A stability which rested on one single assumption: the SoH reopens around 1 May. That assumption is now slowly falling apart.
As we highlighted yesterday: every week of delay beyond 1 May adds (theoretically) ish USD 5/bl to the rest-of-year average, as global inventories draw 100 million barrels per week. i.e., a mid-May reopening implies rest-of-year Brent closer to USD 100/bl, and anything pushing into June or July takes us meaningfully higher.
What’s changed in the last 48 hours:
#1: The US military has formally warned that clearing suspected sea mines from SoH could take up to six months. That is a completely different timescale from what the financial market is pricing. Even a political deal tomorrow does not immediately reopen the strait.
#2: Trump has shifted his tone from urgency to ”strategic patience”. In yesterday’s press conference: ”Don’t rush me… I want a great deal.” The market is reading this as a president no longer feeling pressured by timelines, with the naval blockade running in the background.
#3: So far, the military activity is escalating, not de-escalating. Axios reports Iran is laying more mines in SoH. The US 3rd carrier strike group (USS George H.W. Bush) is arriving with two countermine vessels. Trump yesterday ordered the US Navy to destroy any Iranian boats caught laying mines. While CNN reports that the Pentagon is actively drawing up plans to strike Iranian SoH capabilities and individual Iranian military leaders if the ceasefire collapses. i.e., NOT a attitude consistent with an imminent deal!
Spot crude and product prices eased off the early-April highs on a combination of system rerouting and deal optimism. Both now weakening. Goldman estimates April Gulf output is reduced by 14.5 mbl/d, or 57% of pre-war supply, a number that keeps getting worse the longer this drags on.
Demand-side adaptation is ongoing: S. Korea has cut its Middle East crude dependence from 69% to 56% by pulling more from the Americas and Africa, and Japan is kicking off a second round of SPR releases from 1 May. But SPRs are finite.
Ref. to the negotiations, we should not bet on speed. The current Iranian leadership is dominated by genuine hardliners willing to absorb economic pain and run the clock to extract concessions. That is not a setup for a rapid resolution. US/Israeli media briefings keep framing the delay as ”internal Iranian divisions”, the reality is more complicated and points toward weeks and months, not days.
Our point is that the complexity is large, and higher prices have only just started (given a scenario where the negotiations drag out in time). The market spent April leaning on the USD 90/bl rest-of-year assumption; that case is diminishing by the hour. If ”early May reopening” is replaced by ”June, July or later” over the next week or two, both crude and products have meaningful room to reprice higher from here. There is a high risk being short energy and betting on any immediate political resolution(!).
Down on Friday. Up on Monday. The Brent June crude oil contract traded down 5.1% last week to a close of $90.38/b. It reached a high of $103.87/b last Monday and a low of $86.09/b on Friday as Iran announced that the Strait of Hormuz was fully open for transit. That quickly changed over the weekend as the US upheld its blockade of Iranian oil exports while Iran naturally responded by closing the SoH again. The US blew a hole in the engine room of the Iranian ship TOUSKA and took custody of the ship on Sunday. Brent crude is up 5.6% this morning to $95.4/b.
The cease-fire is expiring tomorrow. The US has said it will send a delegation for a second round of negotiations in Islamabad in Pakistan. But Iran has for now rejected a second round of talks as it views US demands as unrealistic and excessive while the US is also blocking the Strait of Hormuz.
While Brent is up 5% this morning, the financial market is still very optimistic that progress will be made. That talks will continue and that the SoH will fully open by the start of May which is consistent with a rest-of-year average Brent crude oil price of around $90/b with the market now trading that balance at around $88/b.
Financial optimism vs. physical deterioration. We have a divergence where the financial market is trading negotiations, improvements and resolution while at the same time the physical market is deteriorating day by day. Physical oil flows remain constrained by disrupted flows, longer voyage times and elevated freight and insurance costs.
Financial markets are betting that a US/Iranian resolution will save us in time from violent shortages down the road. But every day that the SoH remains closed is bringing us closer to a potentially very painful point of shortages and much higher prices.
The US blockade is also a weapon of leverage against its European and Asian allies. When Iran closed the SoH it held the world economy as a hostage against the US. The US blockade of the SoH is of course blocking Iranian oil exports. But it is also an action of disruption directed towards Europe and Asia. The US has called for the rest of the world to engaged in the war with Iran: ”If you want oil from the Persian Gulf, then go and get it”. A risk is that the US plays brinkmanship with the global oil market directed towards its European and Asian allies and maybe even towards China to force them to engage and take part. Maybe unthinkable. But unthinkable has become the norm with Trump in the White House.


Sommarväder skapar prisrally på elbörsen
Oil product price pain is set to rise as the Strait of Hormuz stays closed into summer

Solkraften pressar elpriserna dagtid

Michel Gubel ger sin syn på oljemarknaden