

Analys
SEB – Råvarukommentarer, 1 december 2014

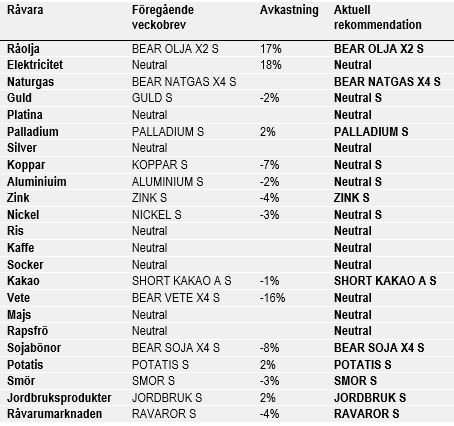
Veckans rekommendationer
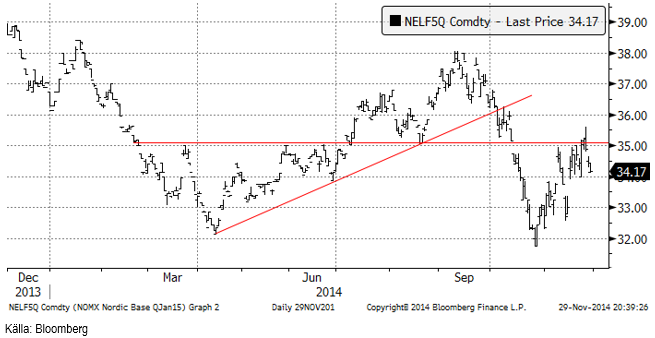
Råolja – Brent
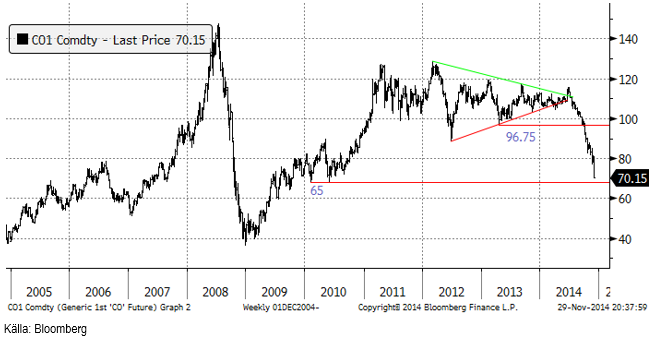
OPEC beslutade sig för att inte ändra produktionsmålet på 30 mbpd, vilket läsare av det här veckobrevet inte bör ha blivit förvånade över. Medan det har funnits beskrivningar av beslutet som en blivande seger mot den amerikanska skifferrevolutionen, anser vi att det handlar mer om en klassisk pyrrhusseger.
Som vi har skrivit förut, beror det höga oljepriset på att det är ganska få länder som sitter på lejonparten av konventionella oljefyndigheter. Dessa har över tiden kunnat höja produktionsskatterna, ett bra exempel på economic rent. Skifferfyndigheterna är betydligt mer spridda i världen, vilket gör att föutsättningarna för att tillskansa sig en economic rent försvinner i samma takt som skiffertekniken sprider sig. Sammanhållningen inom OPEC bygger på att var och en håller igen sin produktion till det gemensamma bästa. Den som har fuskat har straffats, framförallt av Saudiarabien, eftersom Saudiarabien haft lediga produktionsresurser. Systemet håller inte när en främmande teknik fått systemet brista och förlora sin mening. Med insikten att det långsiktiga priset är väsentligt lägre, innebär det endast en förlust, utan vinst genom upprätthållande av kartellen, att hålla igen produktionen. Det innebär inte att skifferproducenterna är opåverkade, det är de inte. Men bara det faktum att tekniken finns, gör att OPEC har spelat ut sin roll.
Skiffertekniken är en ung teknik och den utvecklas med ca 30% per år. Nyligen rapporterades att fracking genomförts utan vatten. Istället användes gas, som också återvanns till 100% efter att tryckningen var klar. Invändningen att fracking begränsas pga vattenbrist på många ställen där skifferresurser finns, är alltså borta sedan förra veckan. Det gör att t ex Kina kan börja utvinna sina enorma resurser av skifferolja och skiffergas.
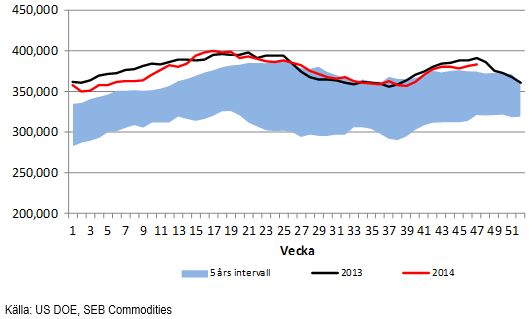
Lagren i USA ökade med 2 miljoner fat enligt DOE:s statistik i veckan.
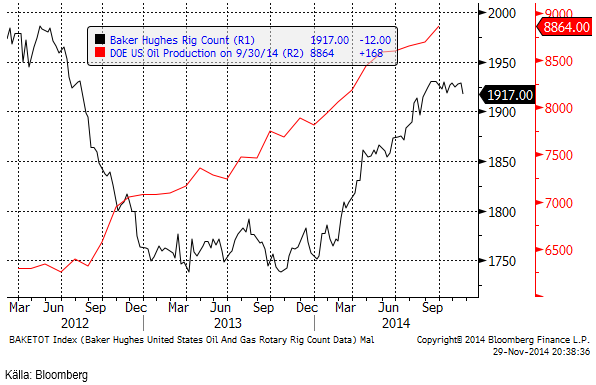
Nedan ser vi ett diagram på antalet oljeriggar i USA, enligt Baker Hughes statistik (svart). Antalet riggar i drift ökade minskade med 12 till 1917. Det ser ut som om det fallande oljepriset haft en effekt på entusiasmen att borra fler oljekällor i USA.
Vi rekommenderar en kort position, t ex med BEAR OLJA X2 S.
Elektricitet
Priset på elektricitet föll mot slutet av veckan på den nordiska elbörsen Nasdaq Commodities. Varmare och blötare väder kom in i prognosfönstret.
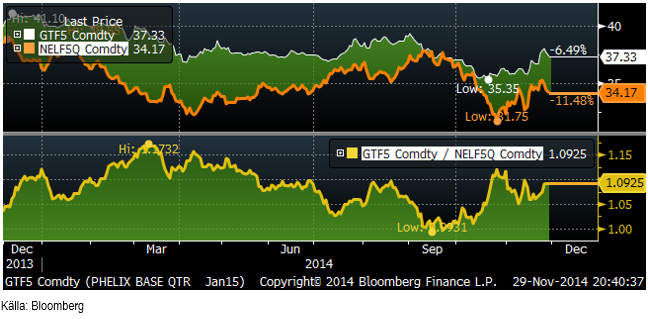
Nedan ser vi kvoten mellan priset på terminen för tysk el under första kvartalet och terminen för nordisk el för samma kvartal. Tysk el har inte fallit i pris på samma sätt under hösten som nordisk el har gjort, utan snarare gått upp något lite.
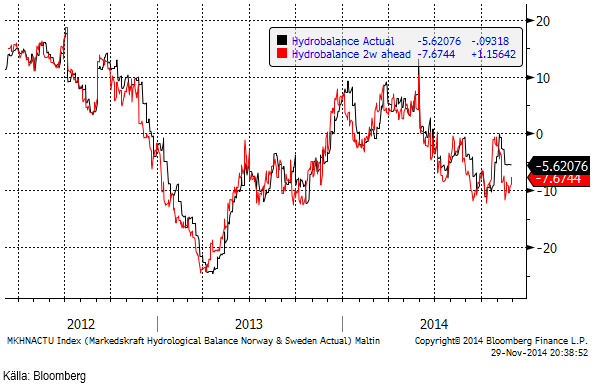
Hydrologisk balans har enligt 2-veckors prognosen stigit med 1 TWh.
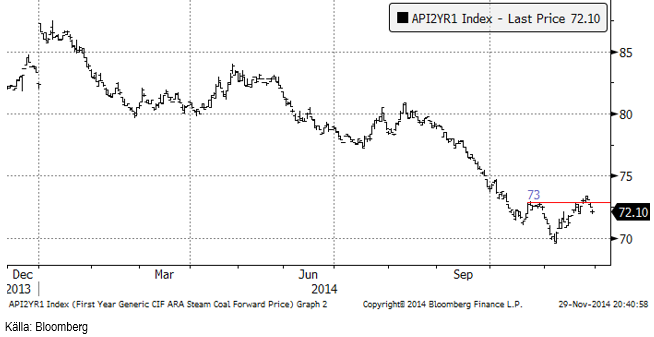
Nedan ser vi terminskontraktet för leverans av kol under 2015, som sjunkit från 72.55 dollar per ton till 72.10 i fredags. Tendensen var svag när handeln stängde för veckan.
Priset på utsläppsrätter steg i veckan från 7 till 7.04, men var uppe på 7.14 som högst.

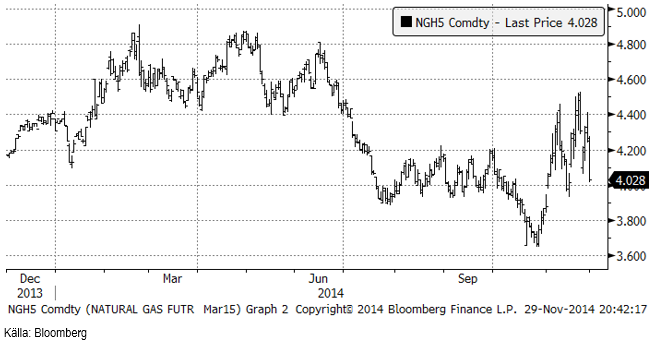
Naturgas
Naturgaspriset föll kraftigt i fredags i samband med det stora prisfallet på råolja.
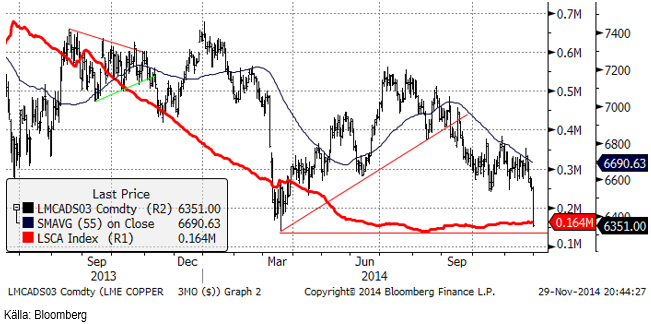
Koppar
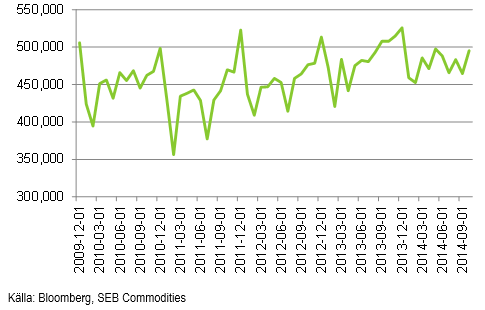
Priset på koppar föll kraftigt i fredags. Dels påverkade prisfallet på olja negativt. Priset på olja (energi) är en stor del av produktionskostnaden för koppar. Dels visade ny statistik från Chile att produktionen i landet inte minskar, utan istället låg på den högsta nivån på fem månader under oktober.
Chile rapporterade i fredags att landets kopparproduktion uppgick till 495,248 ton i oktober. Det är den högsta nivån på fem månader och visar inga tecken på att reagera på ett lägre kopparpris.
Som vi ser i kursdiagrammet har 3-månadersterminen ännu inte brutit golvet vid 6300 dollar per ton. På COMEX handlas dock koppar lägre än den lägsta noteringen i mars månad, vilket kan utlösa ytterligare prisfall. Vi väljer därför att gå över till neutral rekommendation.
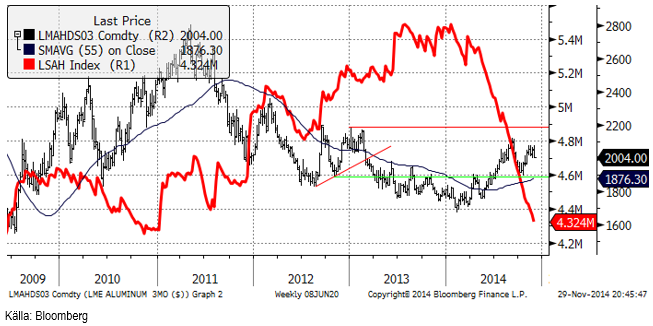
Aluminium
Aluminiumpriset var förbluffande stabilt i veckan, trots att energi är en så stor del av produktionskostnaden och priset på olja föll så kraftigt. Vi tror inte att prisfallet på olja kommer att gå helt obemärkt förbi och väljer därför att gå över till neutral rekommendation.
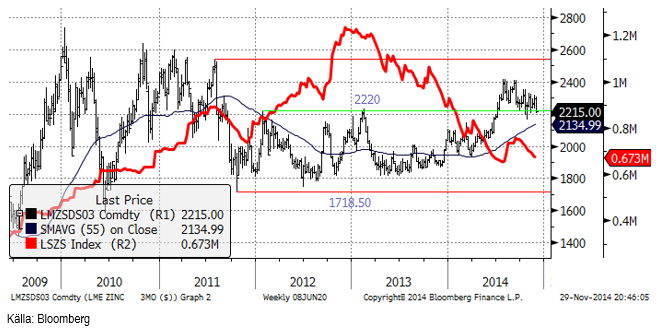
Zink
Zink föll också pga det lägre oljepriset. Tekniskt har marknaden stöd precis där priset ligger och lagernivån fortsätter att sjunka vid LME. Därför behåller vi köprekommendationen på ZINK S.
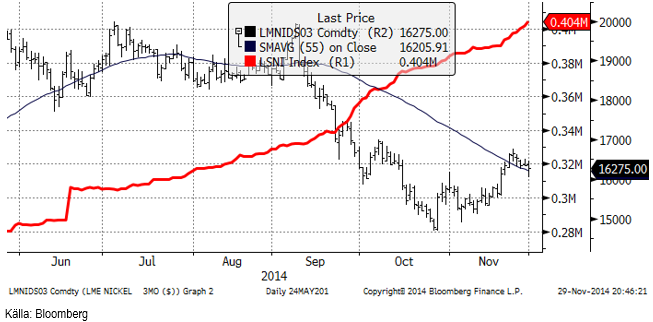
Nickel
Nickelpriset föll lav ganska kraftigt i veckan. Nickel används mycket i olje- och gasindustrin. Man kan tänka sig att olje- och gasindustrin i USA går in i ett lite lugnare skede efter oljeprisfallet och det bör tynga nickelpriset. Lagernivån vid LME fortsätter också att stiga, vilket gör att marknaden är känslig för negativa signaler. Vi väljer därför att gå över till neutral rekommendation på nickel.
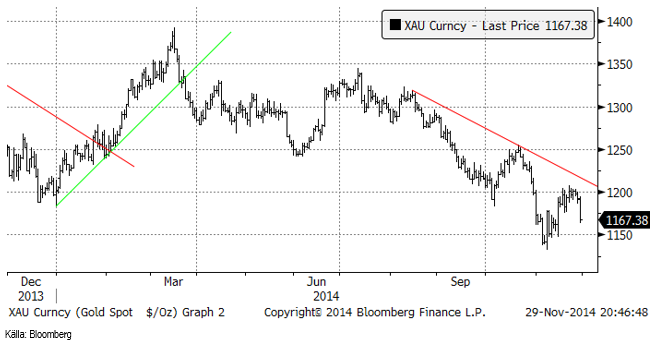
Guld
Guldpriset lyckades inte bryta 1200 dollar, en psykologiskt viktig nivå eftersom produktionskostnaden för många gruvbolag ligger ungefär där, som marknaden uppfattar genomsnittet för kostnaderna.
I Schweiz folkomröstning att återställa guldreserven i söndags blev det ett rungande ”nej”. Det var i och för sig väntat, men beskedet kan ändå tynga guldpriset lite ytterligare i veckan.
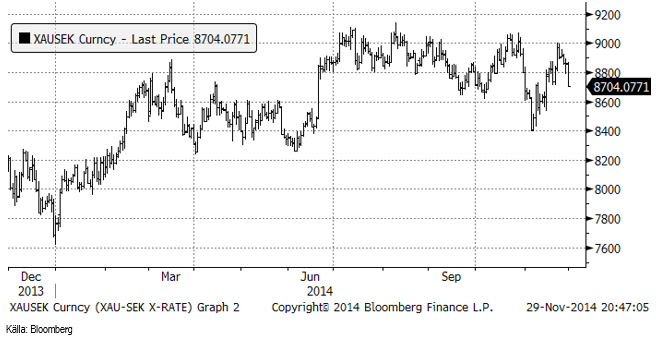
Chartet för guld i kronor visar också fallande pris på veckan.
Prisfallet på olja och det viktiga beslut som (inte) fattades vid OPEC-mötet, fick guldpriset att falla ytterligare. Det finns två anledningar till varför med anledning av oljepriset. För det första ger ett lägre oljepris en kraftig boost för ekonomierna i Tyskland, Frankrike och USA. Det är länder som använder olja för att tillverka andra varor och sälja dem. Vinsterna stiger i näringslivet i dessa länder och det minskar risken för att via inflation behöva inflatera bort skulder. För det andra är kostnaden för olja och annan energi en betydande andel av kostnaden för att producera guld i gruvdrift. Det är djupa gruvor och det är låga halter med mycket malm att krossa för att få fram metallen.
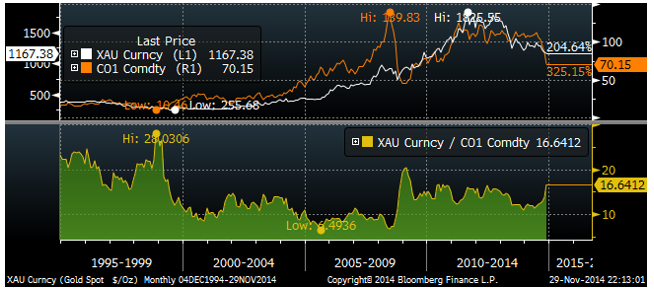
Vi ser kvoten mellan guld och olja nedan. Relationen har alltså stigit ganska kraftigt den senaste tiden och ligger i ett historiskt perspektiv ganska högt. Ytterligare oljeprisfall borde därför dra med sig guldpriset nedåt.
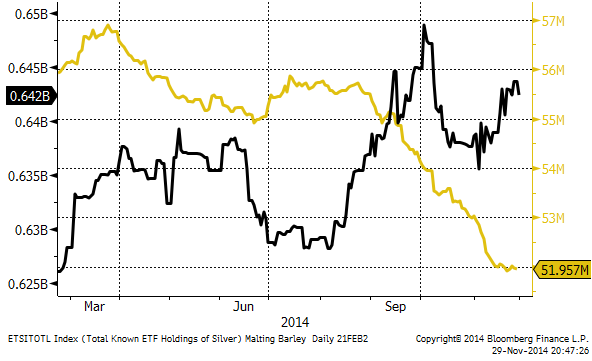
Institutionella investerare äger via ETF/ETC-er 51.96 miljoner uns guld och det är faktiskt mer än de gjorde för en vecka sedan, när de ägde 51.91 miljoner uns. Däremot har de faktiskt netto sålt lite silver.
Vi väljer att gå över till neutral rekommendation på guld.
Silver
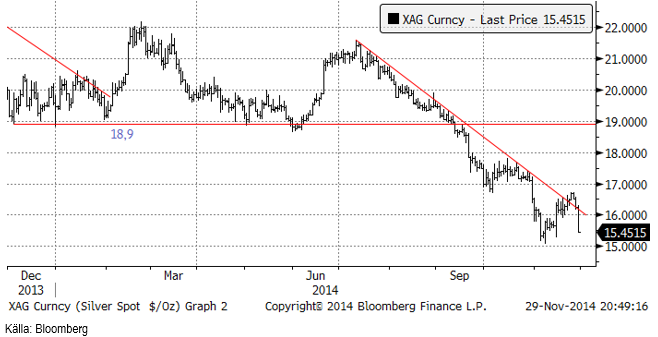
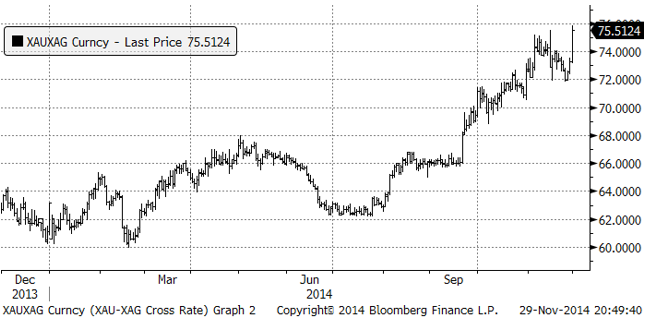
Silverpriset vände ner, precis där det i priset i kronor fanns ett starkt motstånd. Vi skrev om det som ett säljtillfälle förra veckan. Silverpriset kommer antagligen att falla ner till en ny årslägsta notering.
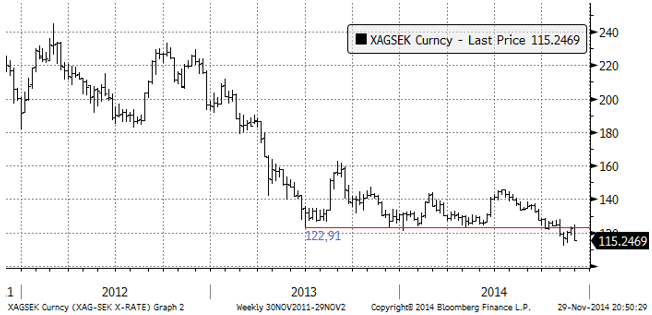
Silverpriset i kronor som vi nämnde ovan, vände ner precis vid motståndslinjen. En ny bottennotering är trolig.
Silver nådde en ny bottennivå i relation till guld. Priset på guld i silvertermer nådde med andra ord en ny toppnivå.
Platina & Palladium
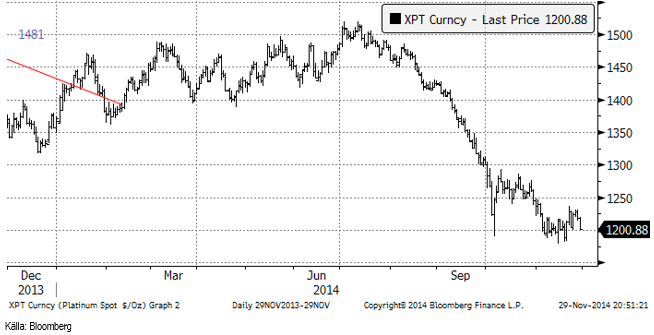
Platina föll, liksom guld och silver kraftigt i veckan, ner till 1200 dollar, som för platina fortfarande är en teknisk stödnivå.
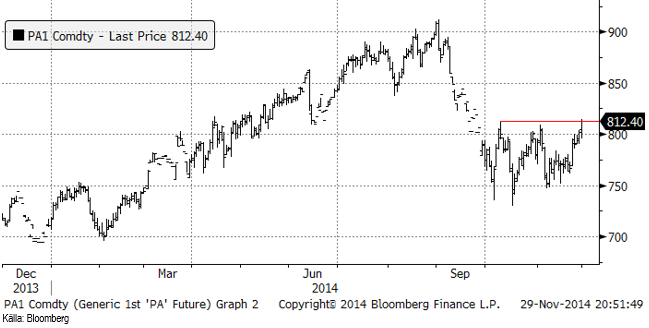
Palladiumpriset har stigit från 794.90 för en vecka sedan till 812.40 dollar per uns. Marknaden stängde precis på motståndet, som måste brytas för att marknaden ska få signalen att nästa nivå att testa är 900 dollar. Palladiummarknaden har ett mycket mer positivt beteende än guld, silver och platina och det är inte omöjligt att priset på palladium kan gå upp samtidigt som de andra faller.
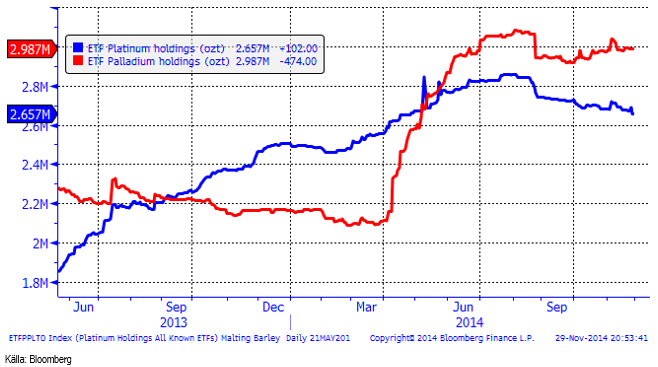
Nedanför ser vi hur mycket metall som finns i börshandlade fonder för platina respektive palladium. Investerare har sålt platina och köpt palladium den senaste veckan.
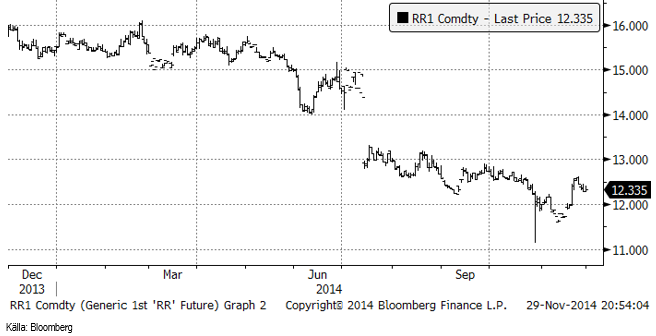
Ris
Priset på ris sjönk i veckan till 12.335 cent per pund.
Kaffe
Kaffepriset (mars) har backat med ett par cent sedan förra veckan. Den brasilianska valutan försvagades i spåren av oljeprisfallet. Djuphavsoljan som varit Brasiliens stora hopp, kostar ca 90 dollar per fat att få upp från 3 km djup under havsytan och den är värdelös vid dagens prisnivå – och den prisnivå som troligen kommer att råda under överskådlig framtid.
Det regnar som vi sett ovan, ganska rikligt över kaffeodlingsområdena i Brasilien. Även detta tynger priset på kaffe.
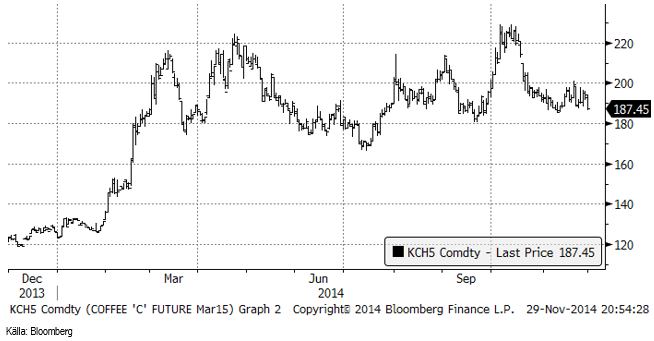
Vi tror inte att priset går upp. Frågan är när priset börjar falla. Än så länge avvaktar vi med en neutral rekommendation.
Kakao
Kakaopriset rörde sig upp och ner ganska volatilt i veckan. Skörden börjar komma igång. International Cocoa Organization (ICCO) rapporterade i fredags att de väntar sig att överskottet i år blir ännu större än de trott tidigare. Fram till i somras trodde de att skörden skulle bli mindre än konsumtionen. Då ändrade de sig och trodde på ett överskott på 40,000 ton. I fredags justerade de upp överskottet till 53,000 ton.
ICCO estimerar produktionen till 4.37 mt, en höjning från tidigare estimatet 4.35 mt. Samtidigt justerar de konsumtionen till 4.27 mt, även det en höjning från tidigare 4.26 mt.
Skörden i Elfenbenskusten är emellertid långsammare än väntat.
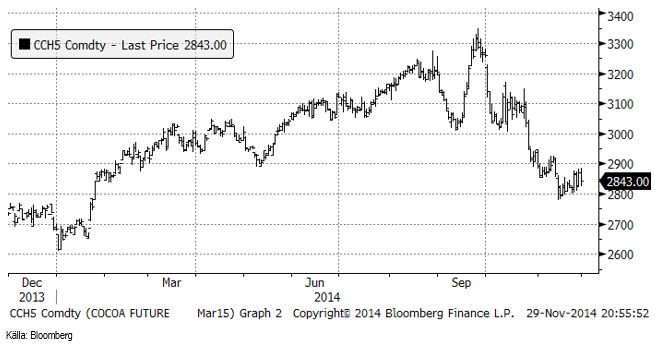
Vi behåller positionen i SHORT KAKAO A S. Nu finns även en BEAR KAKAO X1 S med 1 gånger negativ daglig hävstång och en BEAR KAKAO X4 S med fyra gångers negativ daglig hävstång.
För fler analyser på jordbruksråvaror se SEB jordbruksanalyser.
[box]SEB Veckobrev Veckans råvarukommentar är producerat av SEB Merchant Banking och publiceras i samarbete och med tillstånd på Råvarumarknaden.se[/box]
Disclaimer
The information in this document has been compiled by SEB Merchant Banking, a division within Skandinaviska Enskilda Banken AB (publ) (“SEB”).
Opinions contained in this report represent the bank’s present opinion only and are subject to change without notice. All information contained in this report has been compiled in good faith from sources believed to be reliable. However, no representation or warranty, expressed or implied, is made with respect to the completeness or accuracy of its contents and the information is not to be relied upon as authoritative. Anyone considering taking actions based upon the content of this document is urged to base his or her investment decisions upon such investigations as he or she deems necessary. This document is being provided as information only, and no specific actions are being solicited as a result of it; to the extent permitted by law, no liability whatsoever is accepted for any direct or consequential loss arising from use of this document or its contents.
About SEB
SEB is a public company incorporated in Stockholm, Sweden, with limited liability. It is a participant at major Nordic and other European Regulated Markets and Multilateral Trading Facilities (as well as some non-European equivalent markets) for trading in financial instruments, such as markets operated by NASDAQ OMX, NYSE Euronext, London Stock Exchange, Deutsche Börse, Swiss Exchanges, Turquoise and Chi-X. SEB is authorized and regulated by Finansinspektionen in Sweden; it is authorized and subject to limited regulation by the Financial Services Authority for the conduct of designated investment business in the UK, and is subject to the provisions of relevant regulators in all other jurisdictions where SEB conducts operations. SEB Merchant Banking. All rights reserved.

Selling down on a ”deal”. Brent crude fell 6.2% last week with accelerated weakness towards the end of the week. Close of the week at $87.33/b and low of the week (and on Friday) of $85.8/b. Brent is falling another 4% this morning to $83.7/b on confirmation by Iran that a MoU text has been reached and that it will be signed on Friday this week.

So what is this ”deal” worth? Talk on the desk here this morning is that it is much like ”putting lipstick on a pig” where Trump has to sell this at home as a victory where ”the SoH has reopened”, the nuclear issue will be ironed out over the coming 60 days (or maybe 600 days?) and US consumers are getting a lower gasoline price and maybe US republicans survives the midterm elections.
The importance for Iran is that it emerges as the defacto winner of this war in the eyes of the non-US public world. That Iran now onwards is the ”ruler of the SoH” (combo of geography and new weapons systems like drones) or more softer: ”the guarantor of safe passage through the SoH”.
Iran doesn’t need nuclear weapons any more. Nuclear deterrence doesn’t work any more. Ukraine has made many attacks deep into Russia without being nuked in return. Plenty of Iranian ballistic rockets blasts over Israel but Iran wasn’t nuked in return.
There is no trust between the US and Iran. We don’t know all the details yet of the MoU. But what we do know is that there is no trust between the US and Iran what so ever. This is probably more like a descriptive text on how they can cooperate in a way where both sides keeps tactical leverage. Neither side makes irreversible concessions. Violations can be punished quickly. Cooperation produces immediate benefits.
This is a fragile structure. It can easily break down. There may be details which cannot be overcome. To be seen on Friday. The US has to show that it is willing put enough force behind managing and restraining Israel versus Hezbollah in Lebanon. We have seen that Netanyahu hasn’t listened all that much to Trump’s directives and wishes. This could be a major obstacle.
A gradual reopening is tactically preferable for Iran. A tactical leverage for Iran right now is that global oil stocks have been drawn down towards painful and increasingly dangerous levels with increasing risks for oil price spikes in mid-July to August. This together with US midterm elections on 3 November gives tactical leverage to Iran. Iran probably doesn’t want to fully give up on that leverage. A rapid, full reopening where global stocks are able to refill over the coming 60 days will significantly erode that leverage. If Iran reinstates a closure of the SoH after 60 days (if talks break down again), then the effect won’t be that impactful in terms of prices and the US midterm elections.
So a gradual and partial reopening where global markets gets the oil they need while they are unable to rebuild stocks could be a practical middle way for both parties. Trump can sell it as ”the SoH has reopened” and get affordable gasoline for US consumers. Iran can sell it as ”the SoH has fully reopened, but there is some friction” so flow is only 60-80% of normal.
Not much real demand destruction below $100/b. What we do know is that there is not much real price pain demand destruction for oil globally at an oil price below $100/b. A lot of demand-shock destruction. Fear. But demand should now come roaring back towards normal with fear for exceptionally high prices now is rapidly receding.
Sudden China demand destruction due to EVs? Bullocks. EV share of total Chinese carpool now around 13%. Share of new sales of EVs has reached 50%. This is a very gradual process. It doesn’t make oil demand fall like a rock over night. When EV new sales share reaches 100%, then the gasoline car pool will contract by some 5-10% per year. But that is only gasoline. Sudden reduction in Chinese oil demand is more about shock and risk.
Chinese crude oil imports will come roaring back. At what price? Today’s ”neutral” oil price is $70/b. That is the five year price which has steadily traded around the $70/b mark over the past 3-4 years. With still a risky picture one would think that China and the rest of the world will be big buyers of oil in the range of $70-85/b.
Global demand will likely snap back towards normal, forecasted demand and growth at such prices.
Physical reopening is a gradual process. The physical and practical reopening of the SoH will likely be gradual rather than sudden. And that probably suites Iran tactically as well.
Brent M1 price versus the Brent 5-yr (today’s ”normal” price)

Market is starting to take US/Iran headlines with a pinch of salt. Brent crude rose $2.8/b yesterday to an official close of $112.1/b. But after that it traded as low as $108.05/b before ending late night at around $109.7/b. Through the day it traded in a range of $106.87 – 112.72/b amid a flurry of news or rumors from Iran and the US. ”US temporary sanctions during negotiations” (falls alarm). ”We will bomb Iran” (not anyhow),… etc. While the market is still fluctuating to this kind of news flow, it is starting to take such headlines with a pinch of salt.
We’ll see. Maybe, maybe not. The Brent M1 contract is trading at $110.2/b this morning which very close to the average ticks through yesterday of $110.4/b.
Trump with bearish, verbal intervention whenever Brent trades above $110/b it seems. What seems to be a pattern is that Trump states something like ”very good negotiations going on with Iran”, ”New leaders in Iran are great,..”, ”Great progress in negotiations,…”, ”Deal in sight,..” etc whenever the Brent M1 contract trades above $110/b. An effort to cool the market. These hot air verbal interventions from Trump used to have a heavy bearish impact on prices, but they now seems to have less and less effect unless they are backed by reality.
As far as we can see there has been no real progress in the negotiations between the US and Iran with both sides still standing by their previous demands.
Iran is getting stronger while the cease fire lasts making a return to war for Trump yet harder. Iran is naturally in constant preparation for a return to war given Trump’s steady threats of bombing Iran again. Iran is naturally doing what ever is possible to prepare for a return to war. And every day the cease fire lasts it is better prepared. This naturally makes it more and more difficult and dangerous for the US to return to warring activity versus Iran as the consequences for energy infrastructure in the Persian Gulf will be more and more severe the longer the cease fire lasts. Israel seems to see it this way as well. That the war is not won and that current frozen state of a cease fire gives Iran opportunity to rebuild military and politically.
Global inventories are drawing down day by day. How much? In the meantime the Strait of Hormuz stays closed. There is varying measures and estimates of how much global inventories are drawing down. Our rough estimate, back of the envelope, is that global inventories are drawing down by at least some 10 mb/d or about 300 mb/d in a balance between loss of supply versus demand destruction. Other estimates we see are a monthly draw of 250-270 mb/d. The IEA only ’measured’ a draw in global observable stocks of 117 mb in April with oil on water rising 53 mb while on shore stocks fell 170 mb. But global stocks are hard to measure with large invisible, unmeasured stocks. As such a back of the envelope approach may be better.
Oil products is what the world is consuming. Oil product prices likely to rise while product stocks fall. Strategic Petroleum Reserves (SPR) are predominantly crude oil. Discharging oil from OECD SPR stocks, a sharp reduction in Chinese crude imports and a reduction in global refinery throughput of 6-7 mb/d has helped to keep crude oil markets satisfactorily supplied. But global inventories are drawing down none the less. And oil products is really what the world is consuming. So if global refinery throughput stays subdued, then demand will eventually have to match the supply of oil products. The likely path forward this summer is a steady draw down in jet fuel, diesel and gasoline. Higher prices for these. Then, if possible, higher refinery throughput and higher usage of crude in response to very profitable refinery margins. And lastly sharper draw in crude stocks and higher prices for these. But some 6 mb/d of oil products used to be exported through the Strait of Hormuz. And it may not be so easy to ramp up refinery activity across the world to compensate. Especially as Ukraine continues to damage Russian refineries as well as Russian crude production and export facilities.
Watch oil product stocks and prices as well as Brent calendar 2027. What to watch for this summer is thus oil product inventories falling and oil product premiums to crude rising. Another measure to watch is the Brent crude 2027 contract as it rises steadily day by day as the Strait of Hormuz stays closed and global oil inventories decline. The latter is close to the highest level since the start of the war and keeps rising.
The Brent M1 contract and the Brent 2027 prices and current price of jet fuel in Europe (ARA). All in USD/b

Our back of the envelope calculation of the global shortage created by the closure of the Strait of Hormuz. Note that 3.5 mb/d of discharge from SPR is also a draw. Note also that ’Forced demand loss’ of 2.5 mb/d is probably temporary and will fall back towards zero as logistics are sorted out leaving ’Price demand loss’ to do the job of balancing the market. Thus a shortfall of at least 9 mb/d created by the closure. More if SPR discharge is included and more if Forced demand loss recedes.

Brent is climbing higher. Front-month is at USD 106.3/bl this morning, close to a weekly high and a USD 9/bl jump from Mondays open. This is the move we flagged as a risk earlier in the week: the market shifting from ”a deal is around the corner” to ”this is going to take longer than we thought”.

Analyst Commodities, SEB
During April, rest-of-year Brent remained remarkably stable around USD 90/bl. A stability which rested on one single assumption: the SoH reopens around 1 May. That assumption is now slowly falling apart.
As we highlighted yesterday: every week of delay beyond 1 May adds (theoretically) ish USD 5/bl to the rest-of-year average, as global inventories draw 100 million barrels per week. i.e., a mid-May reopening implies rest-of-year Brent closer to USD 100/bl, and anything pushing into June or July takes us meaningfully higher.
What’s changed in the last 48 hours:
#1: The US military has formally warned that clearing suspected sea mines from SoH could take up to six months. That is a completely different timescale from what the financial market is pricing. Even a political deal tomorrow does not immediately reopen the strait.
#2: Trump has shifted his tone from urgency to ”strategic patience”. In yesterday’s press conference: ”Don’t rush me… I want a great deal.” The market is reading this as a president no longer feeling pressured by timelines, with the naval blockade running in the background.
#3: So far, the military activity is escalating, not de-escalating. Axios reports Iran is laying more mines in SoH. The US 3rd carrier strike group (USS George H.W. Bush) is arriving with two countermine vessels. Trump yesterday ordered the US Navy to destroy any Iranian boats caught laying mines. While CNN reports that the Pentagon is actively drawing up plans to strike Iranian SoH capabilities and individual Iranian military leaders if the ceasefire collapses. i.e., NOT a attitude consistent with an imminent deal!
Spot crude and product prices eased off the early-April highs on a combination of system rerouting and deal optimism. Both now weakening. Goldman estimates April Gulf output is reduced by 14.5 mbl/d, or 57% of pre-war supply, a number that keeps getting worse the longer this drags on.
Demand-side adaptation is ongoing: S. Korea has cut its Middle East crude dependence from 69% to 56% by pulling more from the Americas and Africa, and Japan is kicking off a second round of SPR releases from 1 May. But SPRs are finite.
Ref. to the negotiations, we should not bet on speed. The current Iranian leadership is dominated by genuine hardliners willing to absorb economic pain and run the clock to extract concessions. That is not a setup for a rapid resolution. US/Israeli media briefings keep framing the delay as ”internal Iranian divisions”, the reality is more complicated and points toward weeks and months, not days.
Our point is that the complexity is large, and higher prices have only just started (given a scenario where the negotiations drag out in time). The market spent April leaning on the USD 90/bl rest-of-year assumption; that case is diminishing by the hour. If ”early May reopening” is replaced by ”June, July or later” over the next week or two, both crude and products have meaningful room to reprice higher from here. There is a high risk being short energy and betting on any immediate political resolution(!).


Vattenfalls och Industrikrafts kärnkraftsbolag Videberg Kraft har valt Rolls-Royce SMR
Selling down on a ”deal”

Sommarväder skapar prisrally på elbörsen
Oil product price pain is set to rise as the Strait of Hormuz stays closed into summer

