Analys
SEB – Råvarukommentarer vecka 24 2012
Sammanfattning: Denna vecka
- Brett råvaruindex: +0,02 %
UBS Bloomberg CMCI TR Index - Energi: +0,45 %
UBS Bloomberg CMCI Energy TR Index - Ädelmetaller:+ 2,06 %
UBS Bloomberg CMCI Precious Metals TR Index - Industrimetaller: +1,23 %
UBS Bloomberg CMCI Industrial Metals TR Index - Jordbruk: -1,67 %
UBS Bloomberg CMCI Agriculture TR Index
Kortsiktig marknadsvy:
- Guld: Neutral/köp
- Olja: Neutral/köp
- Koppar: Sälj
- Majs: Sälj
- Vete: Neutral
- Sojabönor: Sälj
Guld
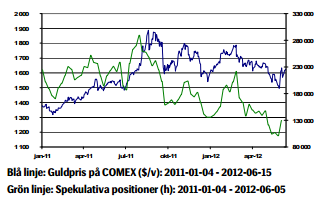
Vi tycker att man ska vara köpt guld. Förra helgen fick Spanien det lån marknaden länge fruktat men samtidigt hoppats på för att stötta landets krisande banksektor. Lånet uppgick till 100 mdr euro. Guldet reagerade positivt på stimulanspaketet och har stigit två procent under veckan.
Kreditvärderingsinstitutet Fitch sänkte betyget för 18 spanska banker och Moody´s sänkte landets långfristiga kreditbetyg till Baa3 från A3. Igår handlade landets räntor på de högsta nivåerna under euro-tiden. Tioårsräntan steg till 6,99 procent. Stigande räntor i Spanien ökar farhågan att Spanien måste söka ett mer omfattande stöd. Guldet steg åter något på torsdagen då både räntan på tysklands Bund (10-åriga statsobligation) och tyska CDS:er (säkerheter mot en statskonkurs) steg. Brist på förtroende för tyska statspapper är mycket oroande för marknaden.
Oroade blickar riktas även mot Italien som också tyngs att höga räntor. Italiens premiärminister deklarerade dock tydligt i veckan att Italien inte kommer att behöva något räddningspaket eftersom stimulans av tillväxten och ett minskat underskott finns på den italienska agendan.
Råvarubörsen CME minskade marginalkraven för guldterminer med 10 procent i slutet av maj. Sänkningen gav ett visst stöd åt guldpriset men var samtidigt förväntad eftersom marginalkraven är proportionella mot volatilitet och prisnivå. Ökar eller minskar de faktorerna ökar eller minska kraven.
Världens största fysiska guld ETF, SPDR, har sett utflöden för första gången på tre veckor och fonden innehåller nu 1 274,37 ton. Efterfrågan på US Mint coin är fortsatt svag med 53000 ozt i maj (1 troy ounce = ca 31 gram) mot 107 000 ozt i maj 2011.
”Ödesvalet” i Grekland på söndag är en stor osäkerhetsfaktor och vinner den koalition som önskar riva upp besparingskrav kan landet tvingas att lämna euron och osäkerheten om guldet kommer att regera med övriga risktillgångar eller snarare som en säker hamn i orostider är stor.
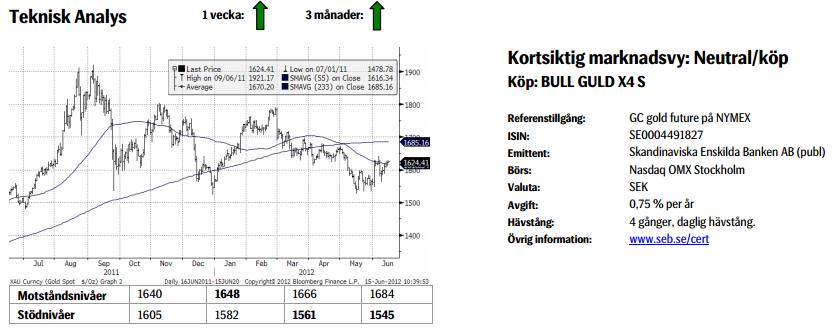
Teknisk analys: Stadigt högre, igen. Efter en lika oväntad som stor sättning från toppen den sjätte juni har marknaden så sakteliga envist arbetat sig tillbaka upp till de tidigare toppnivåerna. Detta visar med all tydlighet, tycker vi, att nedgången ska etiketteras korrektiv. Det underliggande vågmönstret är också fortsatt positivt varför vi räknar med ytterligare uppgång den närmaste tiden.
Olja
Opec´s 12 medlemsländer höll möte igår i Wien. Saudiarabien har inför mötet begärt en ökning av kartellens produktionsmål som i dagsläget motsvarar 30 miljoner fat per dag., något som går stick i stäv med Opec´s irakiske ordförandes önskningar. Saudiarabien har genom en rekordhög produktion (högsta sedan 1980-talet), verbala påtryckningar fått ner oljepriset till önskvärda100 dollar. Inför mötet har man emellertid taktiskt minskat oljeproduktionen för att undgå kritik för att man producerar mer än tilldelade kvoter. Fortsätter produktionen på aktuell nivå kommer marknaden ha ett överskott på olja under det tredje och fjärde kvartalet i år.
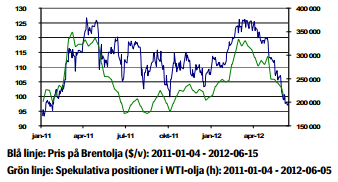
Oförändrade produktionskvoter ger stöd åt oljepriset vilket gynnar de mindre oljeproducerande länderna som haft inkomstbortfall p.g.a. det prisfall vi sett nyligen. Brentpriset föll i veckan till 97,14 dollar, den lägsta nivån sedan januari 2011.
Iran, Venezuela och Angola önskar se ett lägre tak för produktionskvoter. Många länder behöver ett pris på 100 dollar för att kunna balansera sina statsbudgetar.
Saudiarabien är mån om att undvika ett stigande oljepris från en högre säsongsrelaterad efterfrågan och ett från EU:s sida Iranskt embargo som träder ikraft den 1:a juli. Saudiarabien är mycket oroligt för Irans kärnvapenenergiprogram och man vill indirekt inte gynna landet med ett högre oljepris.
Opec behöll emellertid produktionstaket på 30 miljoner fat per dag
Spekulativa positioner i Brent har sjunkit till de lägsta nivåerna sedan november 2011. Efter gårdagen Opec möte är vi neutrala till svagt positiva till ett högre pris men helgens val i Grekland utgör även här en stor osäkerhet. Den tekniska bilden ser emellertid negativ ut.
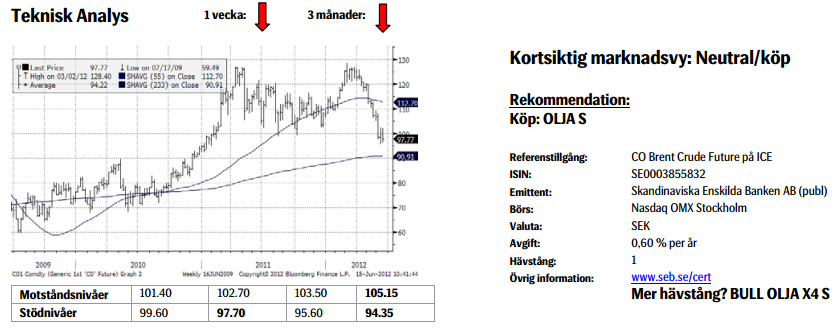
Teknisk analys: Pass upp för falluckan! Efter en mindre korrektiv uppgång är vi nu redan på väg ner igen. Området runt 96 är av stor vikt och ett brott riskerar att utlösa ytterligare ett ras ned mot 80/85.
Koppar
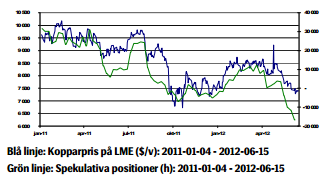
Kopparpriset fann i bättre än förväntad japansk statistik där maskinordrar, d.v.s. beställningar av maskiner inom industrin, långt överträffade analytikers förväntningar. Kopparn fann även stöd i en ökad kinesisk kopparimport och Shanghaibörsens lager nu är på de lägsta nivåerna sedan januari.
Vi har sett bra statistik från Kina. Exporten för maj växte med 15,3 procent i årstakt vilket var mer än en fördubbling av analytikers förväntan och mer än tre gånger ökningstakten i april.
Kinesiskt konsumentprisindex (inflation) föll något mer än förväntat vilket öppnar upp för möjligheter till ytterligare stimulanser från kinesiska myndigheter vilket ger stöd åt kopparn. Fed ledamöter i USA inleder den 19:e juni ett tvådagarsmöte och skulle man ge marknaden förhoppningar om ytterligare stimulanser kommer detta att påverka kopparn positivt. USA är världens andra största kopparkonsument.
Efter att förra veckan ha varit nära sexmånaderslägsta har kopparpriset nu stigit med 2,6 procent. Framförallt har den positiva statistiken från Kina bidragit.
Valet i Grekland på söndag är en stor osäkerhetsfaktor även för kopparn och en eskalering av krisen i Europa med ett Grekiskt euroutträde kan avsevärt minska riskapptiten. Oron växer även kring Cypern vars ekonomi är tätt sammankopplad med den grekiska. Aktiviteten i marknaden är generellt låg inför valet.
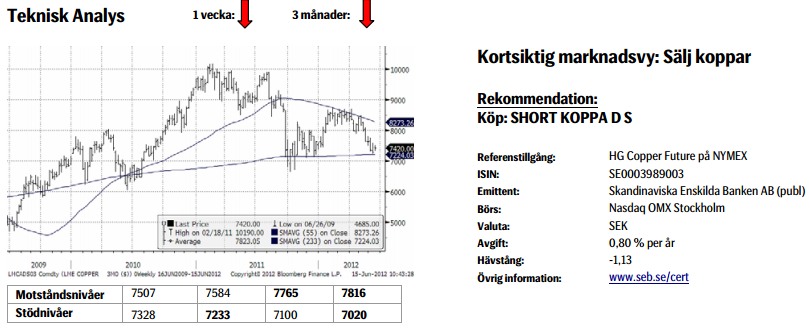
Teknisk analys: På väg mot trend nacklinjen. Inte mycket har hänt sedan förra veckan. En viss stabilisering har dock inträtt men denna bör ses som temporär, en paus i nedåttrenden. Väl avklarad tar vi nästa steg ned emot nacklinjen (av den potentiella huvud skuldra toppformationen).
Majs
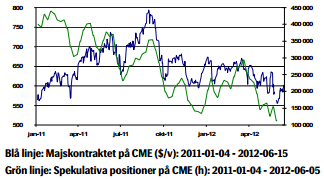
Priset på decembermajs fortsätter sin negativa trend som marknaden haft sedan september förra året. Vi fortsätter at räkna med lägre priser och tror att priset kommer att bryta 500 cent för att sedan fortsätta ner.
USDA höjde produktionsestimatet för 2012/13. Rapporten räknar även med att utgående majslager ökar. Efterfrågan från Kina och andra tillväxtländer samt efterfrågan på majs till etanoltillverkning har hållit lagren pressade. När det gäller etanol är ökningen i efterfrågan med största sannolikhet över.
USDA reviderar upp sin prognos för Rysslands majsproduktion 2012/13 och den beräknade produktionen slår därmed det tidigare produktionsrekordet från 2008/09 som även matchades 2011/12.
Majsproduktionen i Kina 2012/13 beräknas vara oförändrad jämfört med förra året. Lantbrukarna i landet förväntas öka majsarealen p.g.a. lägre vinstmarginaler för andra grödor.
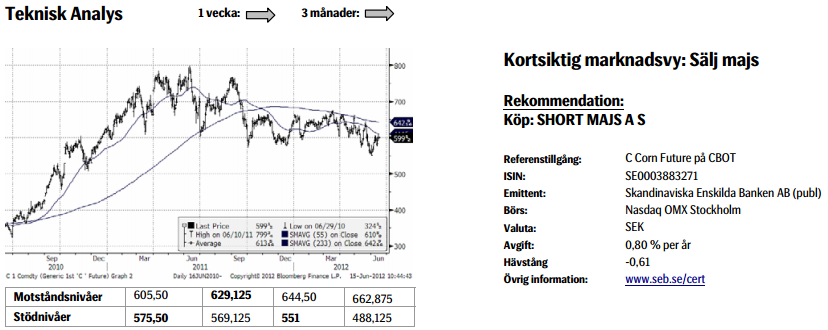
Teknisk analys: Upp inom kanalen. Den övergripande bilden är fortfarande rätt svårtydd. Dock kan vi noterar att det falska brottet på nedsidan vid månadsskiftet har lett till ett normalt utfall, ett återtest av golvet med på följande uppgång. Troligtvis kommer kraften i studsen att räcka till ungefär 630. Faller vi under 575 ½ så är studsen redan över och ett nytt bottentest på väg.
Vete
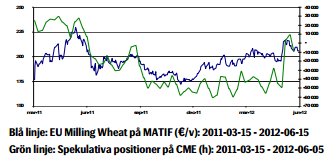
Det USDA har publicerat juni månads WASDE (World Agricultural Supply and Demand Estimates) rapport för produktion, konsumtion och utgående lager. Prognosen för den globala veteproduktionen 2012/13 visar en nedjustering från förra säsongen till 680 ton, vilket dock är fem ton högre än tidigare prognos och fortfarande en bra bit över genomsnittet de senaste fem åren.
Det europeiska Matifvetet föll tillbaka efter Wasde-rapporten. Vi har en negativ grundsyn på prisutvecklingen.
Skicket (crop condition) på amerikanskt vintervete som rapporterade i måndags ligger på 53 % /good/excellent, vilket är en procent högre än förra veckan.
Globala vetelager är på en relativt låg nivå och förväntas inte stiga 2012/13. Nedsiderisken är alltså begränsad.
Ryssland som är en viktig veteproducent har haft problem med ihållande torka och varma temperaturer under april och större delen av maj vilket har hämmat grödornas utveckling.
Dessutom har ogynnsamma väderförhållanden i Centraleuropa gör att USDA reviderat ned produktionsestimat.
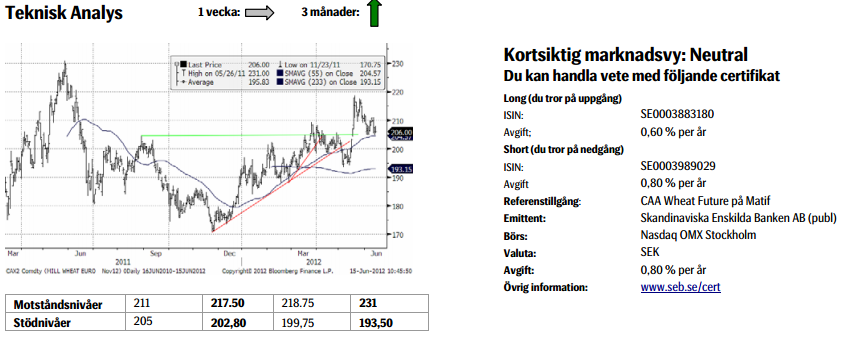
Vi fortsätter att ha en neutral syn på veteprisets utveckling på kort sikt.
Teknisk analys: Tillbaka i 55dagars bandet. Tanken om en fortsatt uppgång har, givet de senaste dagarnas nedgång, skjutits på framtiden. Återigen ligger fokus på huruvida köparna kommer, att som vanligt, återkomma i 55dagars bandet eller inte? Om vi följer det tidigare mönstret bör vi snart försöka högre igen.
Sojabönor
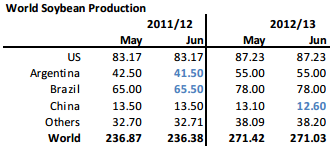
Nedan ser vi WASDE-rapportens produktionsestimat i miljoner ton, som publicerades i onsdags. Det är inga större förändringar för innevarande år, dock en liten uppjustering av Brasiliens skörd och en lika stor nedjustering av Argentinas. För 2012/13 justerades endast Kinas produktion nedåt.
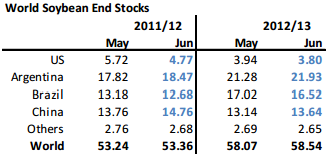
Utgående lager ser vi nedan. Det är otroligt låga utgående lagerestimat för USA. Globalt är dock lagren på en hyggligt bra nivå.
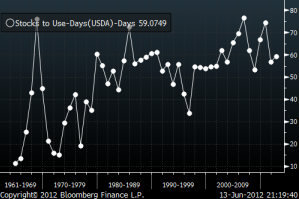
Nedan ser vi nuvarande utgående lager i historiskt perspektiv. Lager som räcker i 59 dagar är en relativt hög nivå, trots allt.
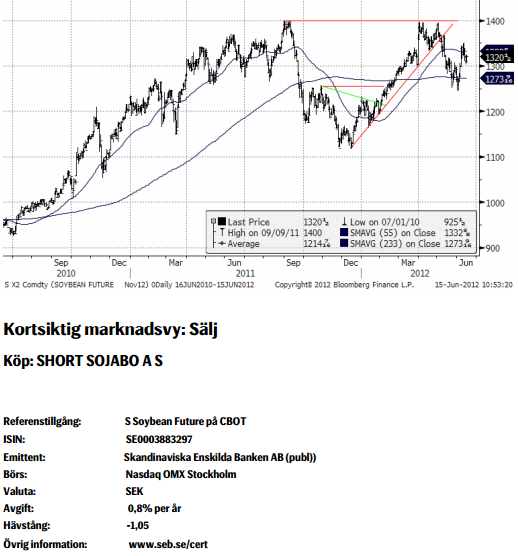
Lägre ekonomisk tillväxt runtom i världen tynger sojabönorna. Vi ser ett lite längre prisdiagram på novemberkontraktet nedan. Så länge det inte blir någon störning av höstens sådd i Sydamerika bör priset kunna hålla sig under 1400 cent. Vi tycker att man ska vara såld sojabönor nu, med stop-loss på drygt 1400 cent. Det finns goda möjligheter till lägre priser framöver.
[box]SEB Veckobrev Veckans råvarukommentar är producerat av SEB Merchant Banking och publiceras i samarbete och med tillstånd på Råvarumarknaden.se[/box]
Disclaimer
The information in this document has been compiled by SEB Merchant Banking, a division within Skandinaviska Enskilda Banken AB (publ) (“SEB”).
Opinions contained in this report represent the bank’s present opinion only and are subject to change without notice. All information contained in this report has been compiled in good faith from sources believed to be reliable. However, no representation or warranty, expressed or implied, is made with respect to the completeness or accuracy of its contents and the information is not to be relied upon as authoritative. Anyone considering taking actions based upon the content of this document is urged to base his or her investment decisions upon such investigations as he or she deems necessary. This document is being provided as information only, and no specific actions are being solicited as a result of it; to the extent permitted by law, no liability whatsoever is accepted for any direct or consequential loss arising from use of this document or its contents.
About SEB
SEB is a public company incorporated in Stockholm, Sweden, with limited liability. It is a participant at major Nordic and other European Regulated Markets and Multilateral Trading Facilities (as well as some non-European equivalent markets) for trading in financial instruments, such as markets operated by NASDAQ OMX, NYSE Euronext, London Stock Exchange, Deutsche Börse, Swiss Exchanges, Turquoise and Chi-X. SEB is authorized and regulated by Finansinspektionen in Sweden; it is authorized and subject to limited regulation by the Financial Services Authority for the conduct of designated investment business in the UK, and is subject to the provisions of relevant regulators in all other jurisdictions where SEB conducts operations. SEB Merchant Banking. All rights reserved.
Analys
Crude stocks fall again – diesel tightness persists

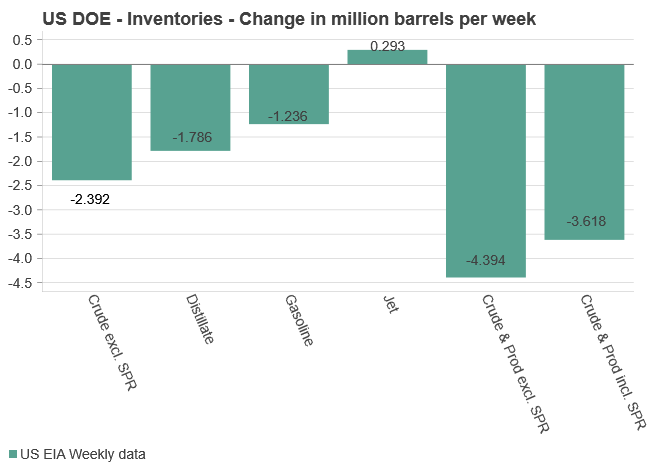
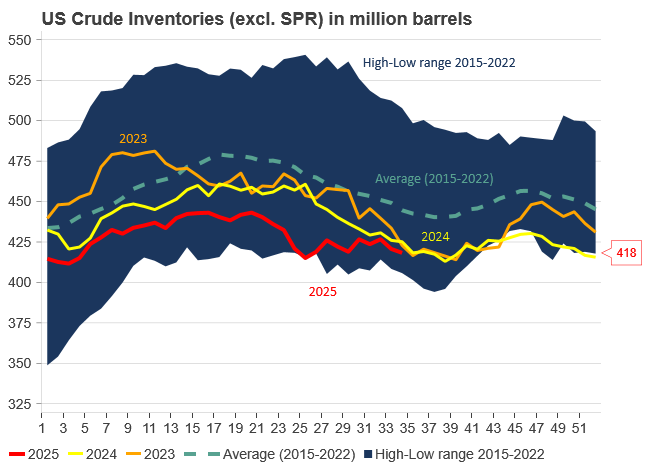
U.S. commercial crude inventories posted another draw last week, falling by 2.4 million barrels to 418.3 million barrels, according to the latest DOE report. Inventories are now 6% below the five-year seasonal average, underlining a persistently tight supply picture as we move into the post-peak demand season.

While the draw was smaller than last week’s 6 million barrel decline, the trend remains consistent with seasonal patterns. Current inventories are still well below the 2015–2022 average of around 449 million barrels.
Gasoline inventories dropped by 1.2 million barrels and are now close to the five-year average. The breakdown showed a modest increase in finished gasoline offset by a decline in blending components – hinting at steady end-user demand.
Diesel inventories saw yet another sharp move, falling by 1.8 million barrels. Stocks are now 15% below the five-year average, pointing to sustained tightness in middle distillates. In fact, diesel remains the most undersupplied segment, with current inventory levels at the very low end of the historical range (see page 3 attached).
Total commercial petroleum inventories – including crude and products but excluding the SPR – fell by 4.4 million barrels on the week, bringing total inventories to approximately 1,259 million barrels. Despite rising refinery utilization at 94.6%, the broader inventory complex remains structurally tight.
On the demand side, the DOE’s ‘products supplied’ metric – a proxy for implied consumption – stayed strong. Total product demand averaged 21.2 million barrels per day over the last four weeks, up 2.5% YoY. Diesel and jet fuel were the standouts, up 7.7% and 1.7%, respectively, while gasoline demand softened slightly, down 1.1% YoY. The figures reflect a still-solid late-summer demand environment, particularly in industrial and freight-related sectors.
Analys
Increasing risk that OPEC+ will unwind the last 1.65 mb/d of cuts when they meet on 7 September

Pushed higher by falling US inventories and positive Jackson Hall signals. Brent crude traded up 2.9% last week to a close of $67.73/b. It traded between $65.3/b and $68.0/b with the low early in the week and the high on Friday. US oil inventory draws together with positive signals from Powel at Jackson Hall signaling that rate cuts are highly likely helped to drive both oil and equities higher.

Ticking higher for a fourth day in a row. Bank holiday in the UK calls for muted European session. Brent crude is inching 0.2% higher this morning to $67.9/b which if it holds will be the fourth trading day in a row with gains. Price action in the European session will likely be quite muted due to bank holiday in the UK today.
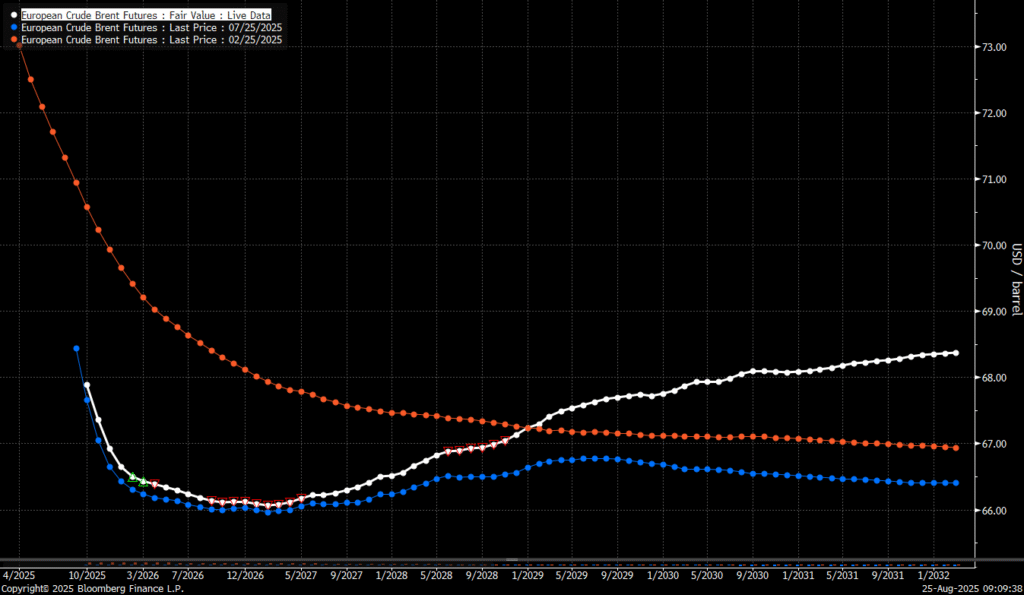
OPEC+ is lifting production but we keep waiting for the surplus to show up. The rapid unwinding of voluntary cuts by OPEC+ has placed the market in a waiting position. Waiting for the surplus to emerge and materialize. Waiting for OECD stocks to rise rapidly and visibly. Waiting for US crude and product stocks to rise. Waiting for crude oil forward curves to bend into proper contango. Waiting for increasing supply of medium sour crude from OPEC+ to push sour cracks lower and to push Mid-East sour crudes to increasing discounts to light sweet Brent crude. In anticipation of this the market has traded Brent and WTI crude benchmarks up to $10/b lower than what solely looking at present OECD inventories, US inventories and front-end backwardation would have warranted.
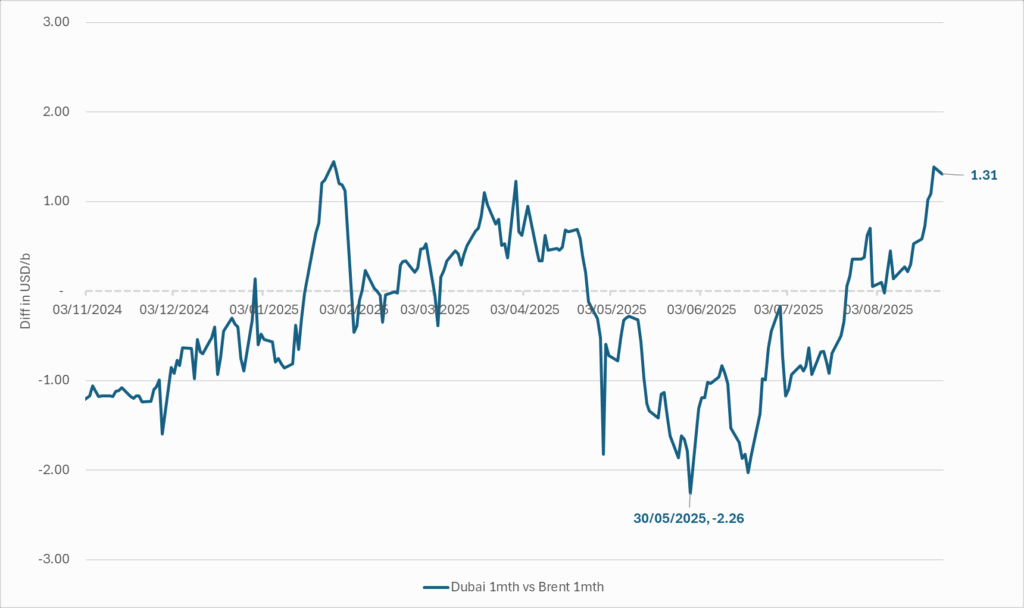
Quite a few pockets of strength. Dubai sour crude is trading at a premium to Brent crude! The front-end of the crude oil curves are still in backwardation. High sulfur fuel oil in ARA has weakened from parity with Brent crude in May, but is still only trading at a discount of $5.6/b to Brent versus a more normal discount of $10/b. ARA middle distillates are trading at a premium of $25/b versus Brent crude versus a more normal $15-20/b. US crude stocks are at the lowest seasonal level since 2018. And lastly, the Dubai sour crude marker is trading a premium to Brent crude (light sweet crude in Europe) as highlighted by Bloomberg this morning. Dubai is normally at a discount to Brent. With more medium sour crude from OPEC+ in general and the Middle East specifically, the widespread and natural expectation has been that Dubai should trade at an increasing discount to Brent. the opposite has happened. Dubai traded at a discount of $2.3/b to Brent in early June. Dubai has since then been on a steady strengthening path versus Brent crude and Dubai is today trading at a premium of $1.3/b. Quite unusual in general but especially so now that OPEC+ is supposed to produce more.
This makes the upcoming OPEC+ meeting on 7 September even more of a thrill. At stake is the next and last layer of 1.65 mb/d of voluntary cuts to unwind. The market described above shows pockets of strength blinking here and there. This clearly increases the chance that OPEC+ decides to unwind the remaining 1.65 mb/d of voluntary cuts when they meet on 7 September to discuss production in October. Though maybe they split it over two or three months of unwind. After that the group can start again with a clean slate and discuss OPEC+ wide cuts rather than voluntary cuts by a sub-group. That paves the way for OPEC+ wide cuts into Q1-26 where a large surplus is projected unless the group kicks in with cuts.
The Dubai medium sour crude oil marker usually trades at a discount to Brent crude. More oil from the Middle East as they unwind cuts should make that discount to Brent crude even more pronounced. Dubai has instead traded steadily stronger versus Brent since late May.
The Brent crude oil forward curve (latest in white) keeps stuck in backwardation at the front end of the curve. I.e. it is still a tight crude oil market at present. The smile-effect is the market anticipation of surplus down the road.
Analys
Brent edges higher as India–Russia oil trade draws U.S. ire and Powell takes the stage at Jackson Hole

Best price since early August. Brent crude gained 1.2% yesterday to settle at USD 67.67/b, the highest close since early August and the second day of gains. Prices traded to an intraday low of USD 66.74/b before closing up on the day. This morning Brent is ticking slightly higher at USD 67.76/b as the market steadies ahead of Fed Chair Jerome Powell’s Jackson Hole speech later today.

No Russia/Ukraine peace in sight and India getting heat from US over imports of Russian oil. Yesterday’s price action was driven by renewed geopolitical tension and steady underlying demand. Stalled ceasefire talks between Russia and Ukraine helped maintain a modest risk premium, while the spotlight turned to India’s continued imports of Russian crude. Trump sharply criticized New Delhi’s purchases, threatening higher tariffs and possible sanctions. His administration has already announced tariff hikes on Indian goods from 25% to 50% later this month. India has pushed back, defending its right to diversify crude sourcing and highlighting that it also buys oil from the U.S. Moscow meanwhile reaffirmed its commitment to supply India, deepening the impression that global energy flows are becoming increasingly politicized.
Holding steady this morning awaiting Powell’s address at Jackson Hall. This morning the main market focus is Powell’s address at Jackson Hole. It is set to be the key event for markets today, with traders parsing every word for signals on the Fed’s policy path. A September rate cut is still the base case but the odds have slipped from almost certainty earlier this month to around three-quarters. Sticky inflation data have tempered expectations, raising the stakes for Powell to strike the right balance between growth concerns and inflation risks. His tone will shape global risk sentiment into the weekend and will be closely watched for implications on the oil demand outlook.
For now, oil is holding steady with geopolitical frictions lending support and macro uncertainty keeping gains in check.
Oil market is starting to think and worry about next OPEC+ meeting on 7 September. While still a good two weeks to go, the next OPEC+ meeting on 7 September will be crucial for the oil market. After approving hefty production hikes in August and September, the question is now whether the group will also unwind the remaining 1.65 million bpd of voluntary cuts. Thereby completing the full phase-out of voluntary reductions well ahead of schedule. The decision will test OPEC+’s balancing act between volume-driven influence and price stability. The gathering on 7 September may give the clearest signal yet of whether the group will pause, pivot, or press ahead.
-

 Nyheter3 veckor sedan
Omgående mångmiljardfiasko för Equinors satsning på Ørsted och vindkraft
-
 Nyheter4 veckor sedan
Lundin Gold hittar ny koppar-guld-fyndighet vid Fruta del Norte-gruvan
-

 Nyheter1 vecka sedan
Meta bygger ett AI-datacenter på 5 GW och 2,25 GW gaskraftverk
-

 Nyheter3 veckor sedan
Guld stiger till över 3500 USD på osäkerhet i världen
-

 Analys3 veckor sedan
What OPEC+ is doing, what it is saying and what we are hearing
-

 Nyheter4 veckor sedan
Alkane Resources och Mandalay Resources har gått samman, aktör inom guld och antimon
-

 Nyheter1 vecka sedan
Aker BP gör ett av Norges största oljefynd på ett decennium, stärker resurserna i Yggdrasilområdet
-

 Nyheter3 veckor sedan
Lyten, tillverkare av litium-svavelbatterier, tar över Northvolts tillgångar i Sverige och Tyskland


