

Analys
The 2017 crude oil market is starting bullishly but is likely to end modestly as US shale production revives

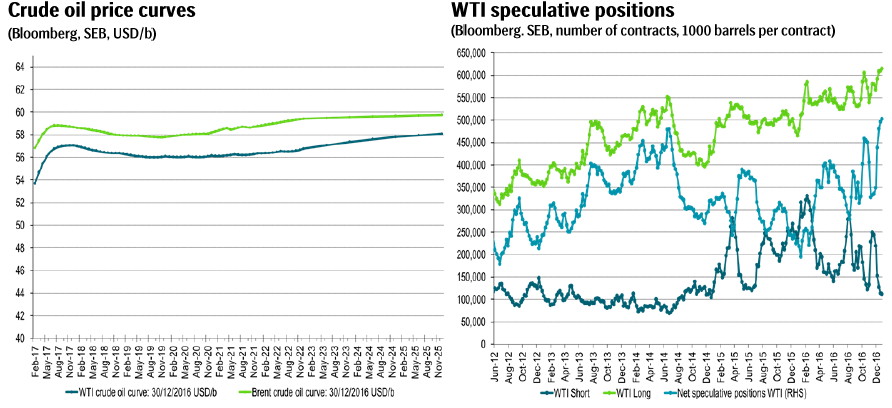
 The year 2016 started on a very bearish note but ended very bullishly. It was a dramatic oil year with desperation and pain for oil producers as Brent bottomed out at $27.1/b in January before trading to a high of $57.89/b in December. The mood was on the positive side in H2-16 as Brent crude averaged $49/b which helped to lift the US oil rig count by 209 rigs to 525. OPEC then ignited further bullishness by deciding to cut production which helped to propel speculative WTI positions to a new record high of 502646 contracts net long (502 million barrels) at the end of 2016. The year 2016 was definitely the year when the global oil market moved from a large, running surplus to close to balance as the strong growth in oil inventories seen all through 2014 and 2015 came to a halt.
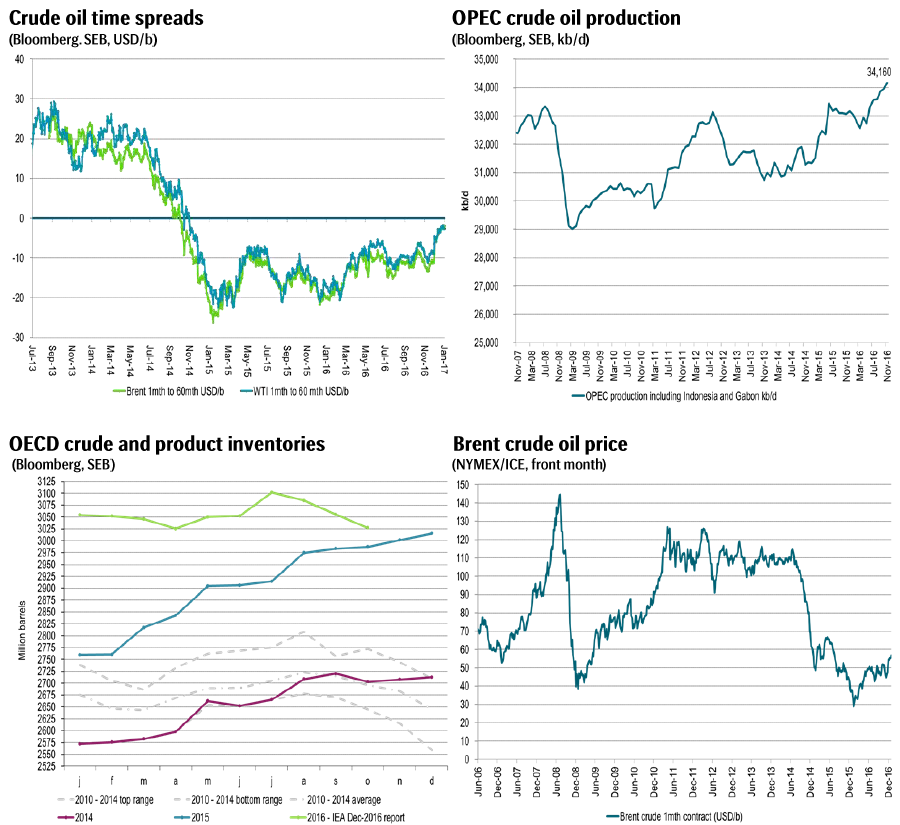
We expect 2017 to be much less dramatic than 2016 unless the supply side is hit by major unforeseen outages. The variations between despair and euphoria should be much less extreme and thus so should the variations in oil prices. While 2016 started bearishly and ended bullishly we expect 2017 to be the opposite but not as extreme. Oil inventories are likely to draw down in H1-17 as OPEC cuts production and crude oil curves are likely to move from deep contango in 2016 to instead backwardation in 2017. While falling in 2016 US shale oil production is going to rise in 2017.
We expect a Brent crude oil price of $55/b in Q1-17, $57.5/b in Q2-17, Q3-17: $55/b, Q4-17: $52.5/b. As a consequence we expect US shale oil rigs to rise by 30 rigs per month in H1-17 (versus 27/mth in H2-16 when Brent crude averaged $49/b) leading total US shale oil rig count to stand at 624 rigs at the start of July 2017. Thereafter there will be no need for additional oil rigs into the US shale oil space before we get to the second half of 2018. Thus by mid-2017 the oil price needs to move to a level which halts further inflow and activation of oil rigs in the US. As such the 12 to 24 month Brent crude oil price probably needs to move down to somewhere between $45-50/b. With crude oil curves having shifted into backwardation with a $5/b spot premium to longer dated contracts it implies a 1 mth Brent crude price of $50-55/b in H2-17.
OPEC has now started to reduce output according to its decision on November 30th to curb output from 34.2 mb/d in November to a planned production of 32.5 mb/d in H2-17. Libya’s crude oil production is however increasing and stood at 685 kb/d this weekend versus an average production of 360 kb/d in 2016. Thus cutting overall OPEC production according to plan is not all without problems. However, Saudi Arabia’s determination as well as its willingness to cut even more than its pledge lends confidence that cuts to overall production will be successful nonetheless. In the face of a further strong rise in US oil rigs during H1-17 we think it will be difficult for OPEC to agree to role forward their production cuts into H2-17. In our view OPEC’s main objective for cutting production in H1-17 is to draw down current elevated global oil inventories thus shifting crude oil prices from a spot discount of $12/b in 2016 to instead a crude oil spot premium of $5/b versus longer dated contracts. We think they will be successful in achieving this with no need to role cuts into H2-17.
The crude oil market is heading into 2017 on a very bullish note with net long non-commercial WTI positions (i.e. speculative positions) at a record high. The 1mth Brent crude oil price closed the year at $56.82/b which was the highest close since July 2015. US oil producers activated 51 oil rigs in December which was the highest monthly addition since March 2014. With record net long speculative WTI positions and US shale oil rigs on a strongly rising path there is clearly a risk for price set backs ahead even though we have an overall positive view for oil prices in H1-17.
Selected graphs
Kind regards
Bjarne Schieldrop
Chief analyst, Commodities
SEB Markets
Merchant Banking
Brent down 0.5% last week with a little bounce this morning. Brent crude fell 0.5% last week to USD 66.68/b with a high of the week of USD 68/69/b set early in the week and the low of USD 66.44/b on Friday. This morning it is up 0.6% and trading at USD 67.1/b and just three dollar below the year to date average of USD 70/b.

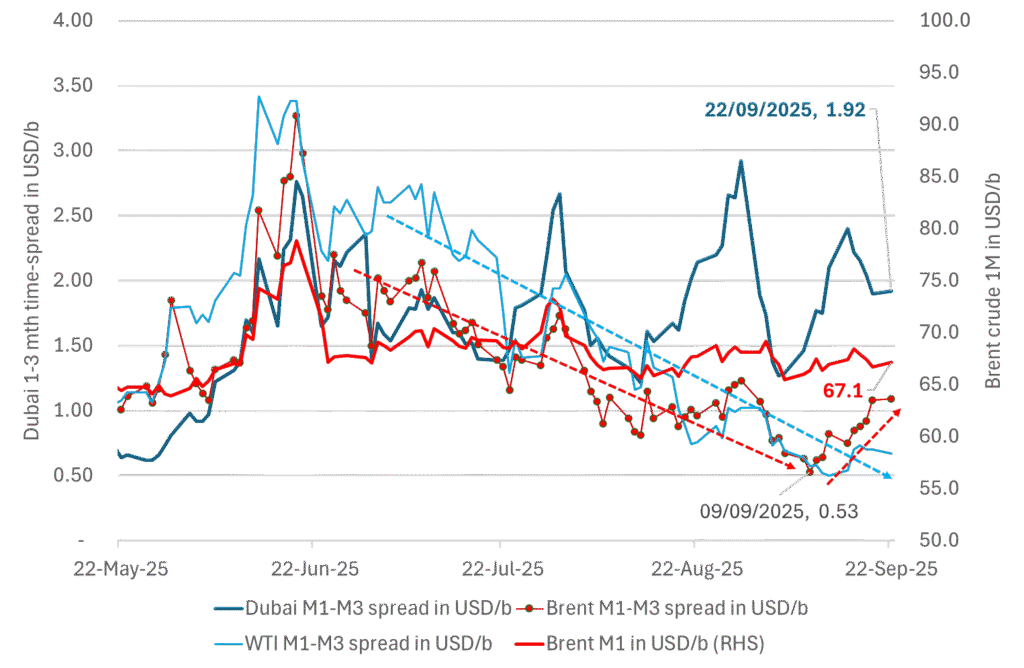
The Dubai crude curve is holding strong. Flat prices will move lower when/if that starts to weaken. The front-end of the Brent crude oil curve has been on a strengthening path since around 10 September, but the front-month contract is more or less at the same level as 10 September. But the overall direction since June has been steadily lower. The recent strengthening in the front-end of the Brent curve is thus probably temporary. The WTI curve has also strengthened a little but much less visibly. What stands out is the robustness in the front-end of the Dubai crude curve. With tapering crude burn for power in the Middle East as we move away from the summer heat together with increasing production by OPEC+, one should have expected to see a weakening in the Dubai curve. The 1 to 3mth Dubai time-spread is however holding strong at close to USD 2/b. When/if the Dubai front-end curve starts to weaken, that is probably when we’ll see flat prices start to taper off and fall lower. Asian oil demand in general and Chinese stockpiling specifically is probably what keeps the the strength in the front-end of the Dubai curve elevated. It is hard to see Brent and WTI prices move significantly lower before the Dubai curve starts to give in.
The 1mth to 3mth time spreads of Brent, WTI and Dubai in USD/b
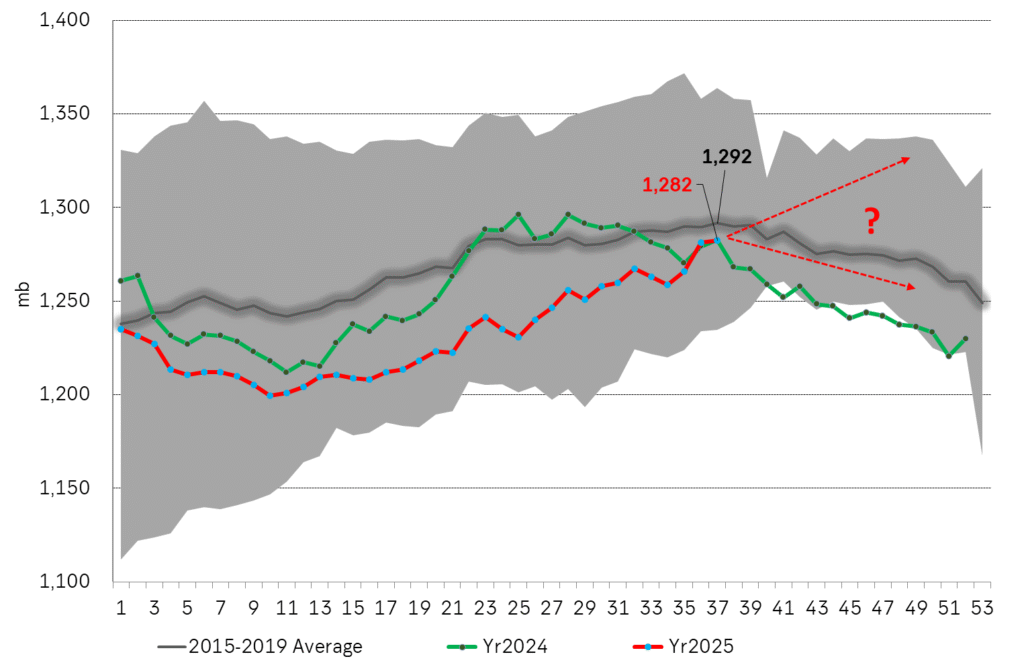
If US oil stocks continues higher in Q4 we’ll start to feel the bearish pressure more intensely. US commercial crude and product stocks have been below normal and below levels from last year as well all until now. Inventories have been rising since week 10 and steadily faster than the normal seasonal trend and today are finally on par with last year and only 10 mb below normal. From here to the end of the year is however is the interesting part as inventories normally decline from now to the end of the year. If US inventories instead continues to rise, then the divergence with normal inventories will be very explicit and help to drive the price lower. So keep a keen eye on US commercial inventories in the coming weeks for such a possible divergence.
US Commercial crude and product stocks in million barrels.
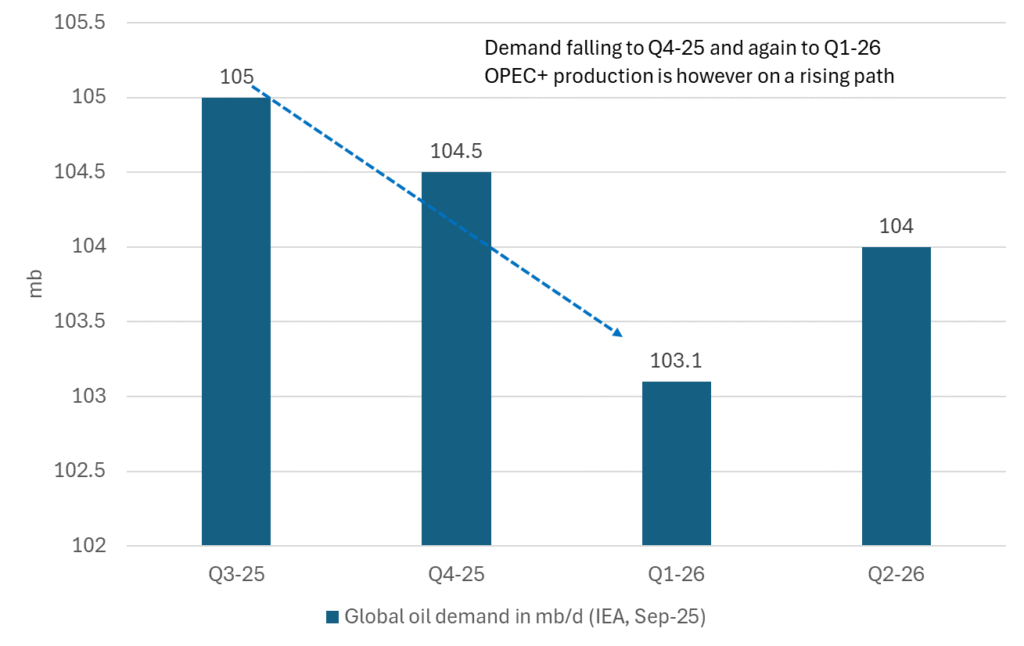
Falling seasonal demand and rising OPEC+ supply will likely drive oil lower in Q4-25. The setup for the oil market is that global oil demand is set to taper off from Q3 to Q4 and again to Q1-26. At the same time production by OPEC+ is on a rising path. The big question this is of course if China will stockpile the increasing surplus or whether the oil price will be pushed lower into the 50ies. We believe the latter.
Outlook for global oil demand by IEA in the OMR September report
Brent crude has climbed roughly USD 1.5-2 per barrel since Friday, yet falling USD 0.3 per barrel this mornig and currently trading near USD 67.25/bbl after yesterday’s climb. While the rally reflects short-term geopolitical tension, price action has been choppy, and crude remains locked in a broader range – caught between supply-side pressure and spot resilience.

Prices have been supported by renewed Ukrainian drone strikes targeting Russian infrastructure. Over the weekend, falling debris triggered a fire at the 20mtpa Kirishi refinery, following last week’s attack on the key Primorsk terminal.
Argus estimates that these attacks have halted ish 300 kbl/d of Russian refining capacity in August and September. While the market impact is limited for now, the action signals Kyiv’s growing willingness to disrupt oil flows – supporting a soft geopolitical floor under prices.
The political environment is shifting: the EU is reportedly considering sanctions on Indian and Chinese firms facilitating Russian crude flows, while the U.S. has so far held back – despite Bessent warning that any action from Washington depends on broader European participation. Senator Graham has also publicly criticized NATO members like Slovakia and Hungary for continuing Russian oil imports.
It’s worth noting that China and India remain the two largest buyers of Russian barrels since the invasion of Ukraine. While New Delhi has been hit with 50% secondary tariffs, Beijing has been spared so far.
Still, the broader supply/demand balance leans bearish. Futures markets reflect this: Brent’s prompt spread (gauge of near-term tightness) has narrowed to the current USD 0.42/bl, down from USD 0.96/bl two months ago, pointing to weakening backwardation.
This aligns with expectations for a record surplus in 2026, largely driven by the faster-than-anticipated return of OPEC+ barrels to market. OPEC+ is gathering in Vienna this week to begin revising member production capacity estimates – setting the stage for new output baselines from 2027. The group aims to agree on how to define “maximum sustainable capacity,” with a proposal expected by year-end.
While the IEA pegs OPEC+ capacity at 47.9 million barrels per day, actual output in August was only 42.4 million barrels per day. Disagreements over data and quota fairness (especially from Iraq and Nigeria) have already delayed this process. Angola even quit the group last year after being assigned a lower target than expected. It also remains unclear whether Russia and Iraq can regain earlier output levels due to infrastructure constraints.
Also, macro remains another key driver this week. A 25bp Fed rate cut is widely expected tomorrow (Wednesday), and commodities in general could benefit a potential cut.
Summing up: Brent crude continues to drift sideways, finding near-term support from geopolitics and refining strength. But with surplus building and market structure softening, the upside may remain capped.
Brent crude is essentially flat on the week, but after a volatile ride. Prices started Monday near USD 65.5/bl, climbed steadily to a mid-week high of USD 67.8/bl on Wednesday evening, before falling sharply – losing about USD 2/bl during Thursday’s session.
Brent is currently trading around USD 65.8/bl, right back where it began. The volatility reflects the market’s ongoing struggle to balance growing surplus risks against persistent geopolitical uncertainty and resilient refined product margins. Thursday’s slide snapped a three-day rally and came largely in response to a string of bearish signals, most notably from the IEA’s updated short-term outlook.
The IEA now projects record global oversupply in 2026, reinforcing concerns flagged earlier by the U.S. EIA, which already sees inventories building this quarter. The forecast comes just days after OPEC+ confirmed it will continue returning idle barrels to the market in October – albeit at a slower pace of +137,000 bl/d. While modest, the move underscores a steady push to reclaim market share and adds to supply-side pressure into year-end.
Thursday’s price drop also followed geopolitical incidences: Israeli airstrikes reportedly targeted Hamas leadership in Doha, while Russian drones crossed into Polish airspace – events that initially sent crude higher as traders covered short positions.
Yet, sentiment remains broadly cautious. Strong refining margins and low inventories at key pricing hubs like Europe continue to support the downside. Chinese stockpiling of discounted Russian barrels and tightness in refined product markets – especially diesel – are also lending support.
On the demand side, the IEA revised up its 2025 global demand growth forecast by 60,000 bl/d to 740,000 bl/d YoY, while leaving 2026 unchanged at 698,000 bl/d. Interestingly, the agency also signaled that its next long-term report could show global oil demand rising through 2050.
Meanwhile, OPEC offered a contrasting view in its latest Monthly Oil Market Report, maintaining expectations for a supply deficit both this year and next, even as its members raise output. The group kept its demand growth estimates for 2025 and 2026 unchanged at 1.29 million bl/d and 1.38 million bl/d, respectively.
We continue to watch whether the bearish supply outlook will outweigh geopolitical risk, and if Brent can continue to find support above USD 65/bl – a level increasingly seen as a soft floor for OPEC+ policy.


Guldpriset uppe på nya höjder, nu 3750 USD
Market waiting and watching for when seasonally softer demand meets rising OPEC+ supply

Kolkraft är här för att stanna

Tyskland har så höga elpriser att företag inte har råd att använda elektricitet
Brent crude ticks higher on tension, but market structure stays soft

Mahvie Minerals är verksamt i guldrikt område i Finland
Increasing risk that OPEC+ will unwind the last 1.65 mb/d of cuts when they meet on 7 September

Eurobattery Minerals satsar på kritiska metaller för Europas självförsörjning

Neil Atkinson spår att priset på olja kommer att stiga till 70 USD
Guldpriset kan närma sig 5000 USD om centralbankens oberoende skadas
-
 Nyheter4 veckor sedan
Mahvie Minerals är verksamt i guldrikt område i Finland
-
Analys4 veckor sedan
Increasing risk that OPEC+ will unwind the last 1.65 mb/d of cuts when they meet on 7 September
-
 Nyheter3 veckor sedan
Eurobattery Minerals satsar på kritiska metaller för Europas självförsörjning
-
 Nyheter4 veckor sedan
Neil Atkinson spår att priset på olja kommer att stiga till 70 USD
-
 Nyheter2 veckor sedan
Guldpriset kan närma sig 5000 USD om centralbankens oberoende skadas
-
Analys3 veckor sedan
OPEC+ in a process of retaking market share
-

 Nyheter2 veckor sedan
Mahvie Minerals i en guldtrend
-

 Nyheter1 vecka sedan
Aktier i guldbolag laggar priset på guld