

Analys
USD weakness, inventory draws and a pinch of Venezuela concerns

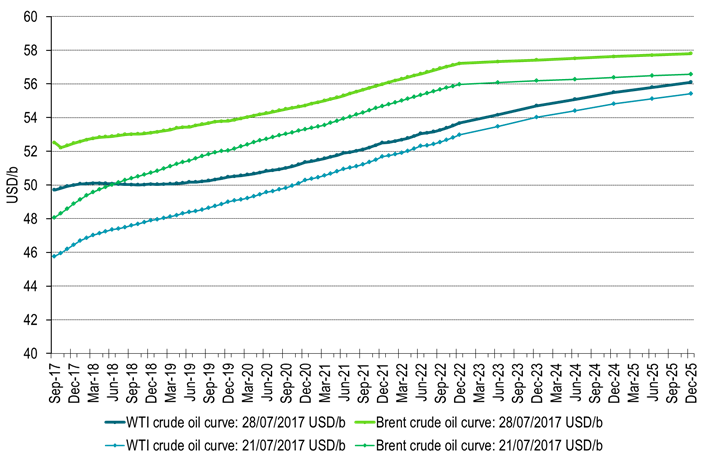
 Last week Brent crude gained 9.3% w/w with a close of $52.52/b on Friday. WTI gained comparably much (+8.6%) with a close of $49.71/b. The main gains were in the front end of the crude curves leading to a substantial flattening of the forward curves. Brent crude Dec 2020 only gained 2.6% with a close of $54.72/b and thus a way smaller gain than in the front end of the forward curves. For WTI the front end contract now only sits $0.34/b below the 18 mth forward WTI contracts which closed the week at $50.05/b.
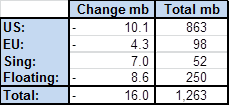
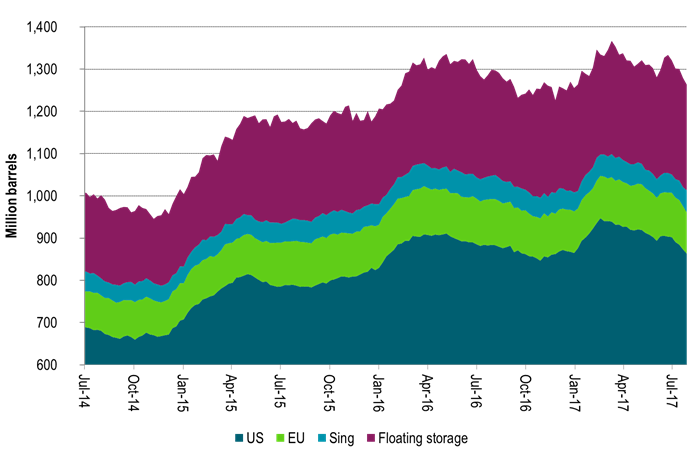
Continued inventory draws last week underpinned the crude oil price rally and the flattening of the forward crude curves. Weekly inventory data last week saw draws of 16 mb of which 10 mb were in the US while a reduction of 8.6 mb in floating storage also took a solid bite. Over the past 5 weeks inventories have drawn down some 70 mb in weekly data. Thus inventory draws kicked in and accelerated almost on the clock as we entered stronger seasonal consumption in Q3-17. Since mid-March weekly data indicate an inventory draw of 104 mb of which 76 mb took place in the US while 18 mb were drawn in floating storage. Refineries are rapidly coming back online with increased crude oil consumption as a result. There are still more refineries to come back online both in Asia and LatAm while Europe and Africa are mostly all up and running. We expect continued draws in H2-17.
Saudi Arabia of course added some extra fuel on the fire last week as they promised exports of no more than 6.6 mb/d in August. That would be their lowest monthly export since early 2011 (not including oil products). From Jan-May Saudi Arabia exported 7.17 kb/d. If it sticks to 6.6 mb/d exports in August it will be a reduction of 705 kb/d y/y versus its pledged production cut of 490 kb/d. The lower export pledged in August of course coincide with high domestic summer demand in Saudi Arabia. As such it remains to be seen whether the export cap of 6.6 mb/d remains in place after August. What it shows more than anything is determination by the Saudi energy minister Al-Falih. Determination to draw inventories down and the time to do it is H2-17 before US shale oil revival extends too far in 2018. It is thus possible that Saudi Arabia maintains its export cap beyond August.
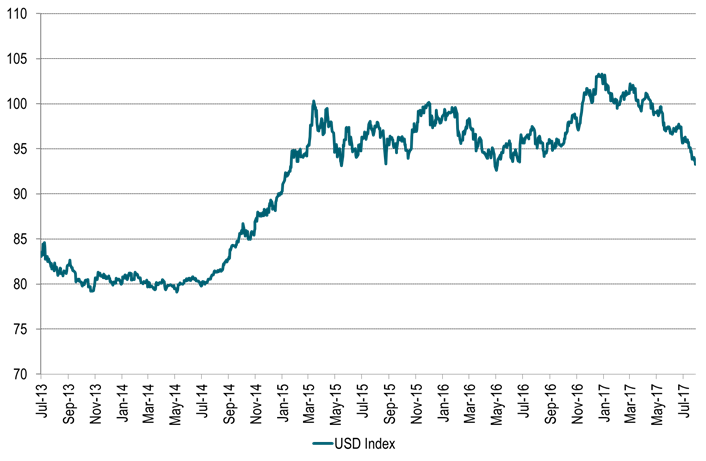
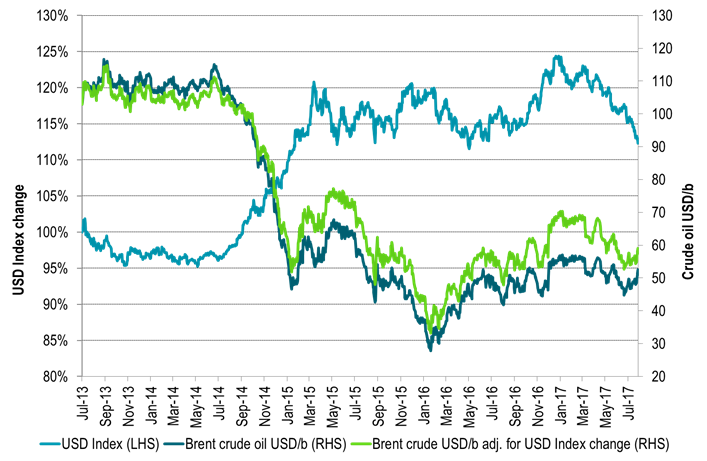
The softening in the US dollar has definitely underpinned the whole crude oil rally. It has underpinned a rally in the whole commodity complex. Over the past 5 weeks Bloomberg’s commodity index has gained 8.3% with 11.9% in Energy, 8.3% in Agri, 7% in Industrial metals and 1% in precious. The USD index has declined a substantial 4.1% over the period with half of the overall commodity index gain being a nominal impact from a softer dollar. IMF’s upgrade last week of growth in Europe, Japan and China while downgrading US growth from 2.3% to 2.1% (little hope for promised tax cuts) is the example in case which drives the dollar lower. US growth has been ahead of the curve for a long time and now the rest of the world is catching up. If the dollar weakness continues it will undoubtedly drive commodity prices in general and oil prices specifically higher in nominal terms. With the 4.1% USD Index decline over the past 5 weeks the Brent crude Dec 2020 contract has gained 5.5%. Thus almost all of this can be attributed to the dollar effect.
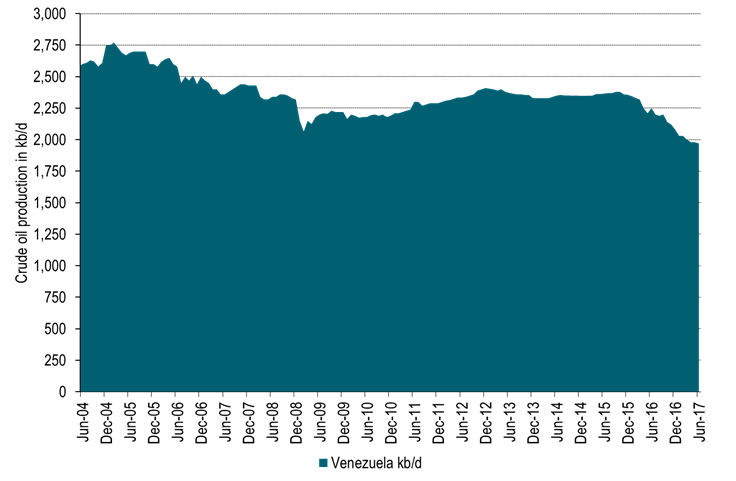
The deteriorating situation in Venezuela probably adds some support to oil prices as well. A national election was held this weekend to vote for members of a National Constituent Assembly. This Assembly will have no fixed term, it will have powers to rewrite the constitution. It will supersede the National Assembly and hand Nicolas Maduro close to dictatorial power and end close to six decades of democracy. At least 10 people were killed in clashes during the election this weekend and some 120 people have been killed in uprisings since April. Venezuela probably holds the world’s largest oil reserves (297 billion barrels) and produced 1.97 mb/d in June (Blberg) which is close to exactly equal to the production cap under the current OPEC production agreement. Its production has however deteriorated steadily due to lack of investments with production standing at 2.37 mb/d back in July 2015. The main concern in the oil market following the election is possible sanctions by Donald Trump. The US buys a third of Venezuela’s oil exports. Extensive US sanctions could make it almost impossible for international oil companies to work in Venezuela. For now the market is awaiting reactions from Donald Trump.
Today equities are up across the board, industrial metals are up 1% and Brent crude traded as much as 0.8% higher before now trading flat at $52.5/b. Thus so far this morning crude oil is lagging behind the gains in industrial metals. Crude oil is trading cautiously following five consecutive days of solid gains. A slight negative this morning is the USD Index which gains 0.3%. We expect to see further oil inventory draws also this week. If the USD Index also continues on its softening trend the two drivers are likely to push crude oil prices yet higher also this week. Money managers have added net long positions for 4 weeks in a row now but probably have room to add more. Producers are likely to sell into the forward crude prices. This is likely to hold back gains for medium term crude prices while inventory draws and investor appetite continues to push upwards in the front leading to a yet flatter crude curve. Potentially shifting the curves into backwardation.
The crude oil inventory draws taking place at the moment are of course real and they will draw down more during H2-17. Still it is important to remember that they are artificially managed by a 1.8 mb/d cut by OPEC and some non-OPEC members. Currently they help to draw down invnetories and to flatten curude curves. When needed however, the volumes will be put back into the market some time in 2018 or 2019.
Ch 1: Inventories in global weekly data drew 16 mb last week.
Over the past 5 weeks inventories have drawn down 70 mb in weekly data
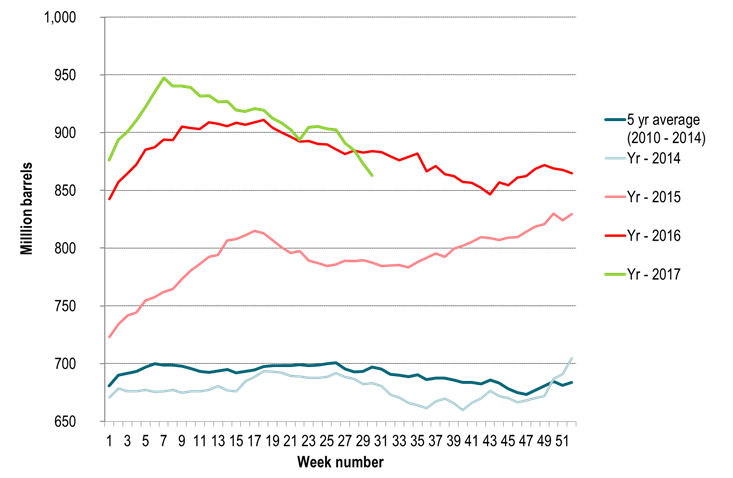
Ch2: US crude and product stocks now well below last year
And down y/y first time since 2014
Ch3: The USD Index has moved down 9.6% since the start of the year
More specifically it has moved down 4.2% since crude oil prices bottomed out in June 21st.
It is now the weakest since a brief sell-off in February 2016.
However, it needs to decline another 15% to get down the the weakness it had in 2014.
Ch4: If we had had USD weakness as in 2014 we should nominally have had an oil price of close to $60/b
Ch5: Crude oil forward curves flattened substantially last week
As investors and refineries bought the front while producers probably sold into the rally out on the curve
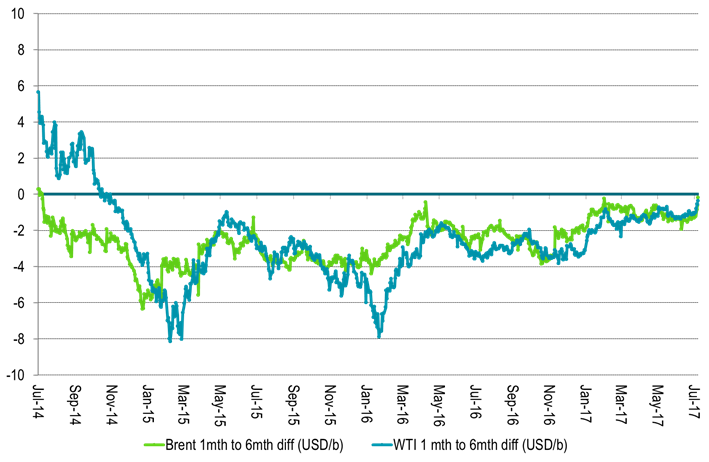
Ch6: The 1 to 6mth crude time spreads got close to zero
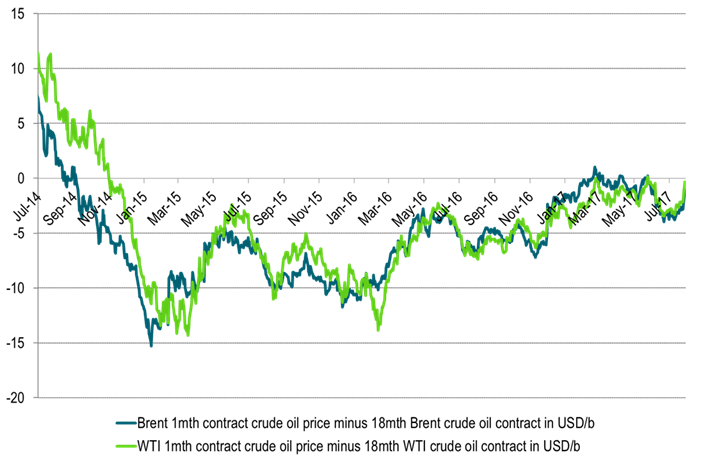
Ch7: And crude time spreads of 1mth to 18mth were not far away either
With WTI 1mth closing just $0.34/b below the 18mth on Friday and trading just $0.19/b below today
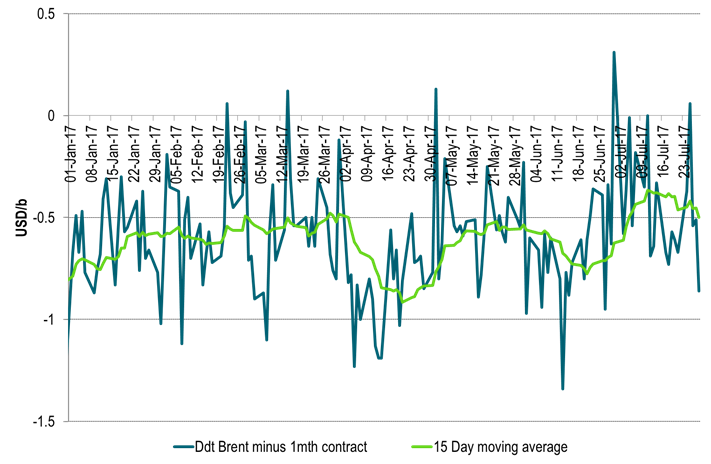
Ch8: A word of caution though. The tightness is not so evident in the Brent crude oil spot market
Dated Brent still trades at a $0.5/b discount to the 1mth contract in a sign that deficit of crude oil is still not quite yet here
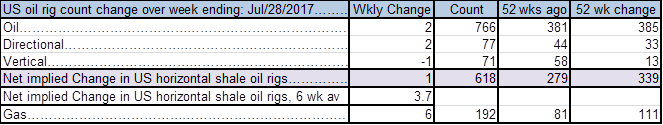
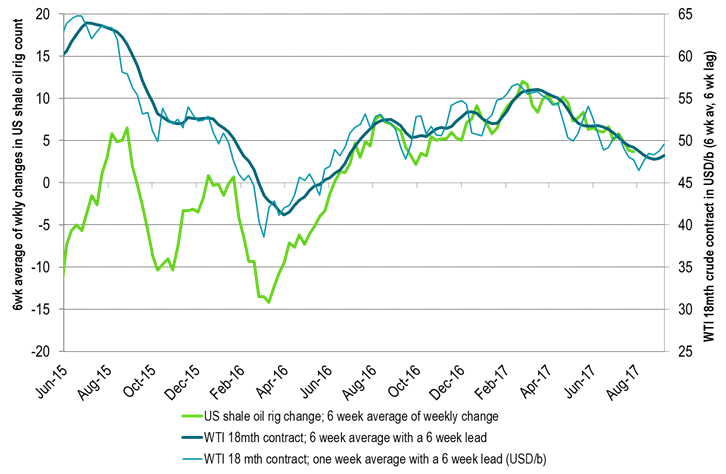
Ch9: US oil players added 2 rigs last week
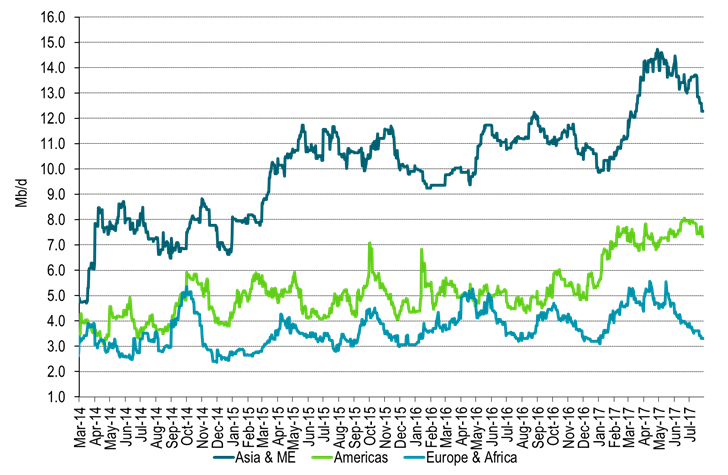
Ch10: Global refineries are rapidly getting back on line consuming more crude oil
More to come in Asia, ME and LatAm
Ch11: Deteriorating crude production in Venezuela
Production could be hit hard by possible US sanctions
Ch12: Net long managed money probably has room to add more length
Even though length has been added 4 weeks in a row now

Kind regards
Bjarne Schieldrop
Chief analyst, Commodities
SEB Markets
Merchant Banking

The latest weekly report from the US DOE showed a substantial drawdown across key petroleum categories, adding more upside potential to the fundamental picture.

Commercial crude inventories (excl. SPR) fell by 5.8 million barrels, bringing total inventories down to 415.1 million barrels. Now sitting 11% below the five-year seasonal norm and placed in the lowest 2015-2022 range (see picture below).
Product inventories also tightened further last week. Gasoline inventories declined by 2.1 million barrels, with reductions seen in both finished gasoline and blending components. Current gasoline levels are about 3% below the five-year average for this time of year.
Among products, the most notable move came in diesel, where inventories dropped by almost 4.1 million barrels, deepening the deficit to around 20% below seasonal norms – continuing to underscore the persistent supply tightness in diesel markets.
The only area of inventory growth was in propane/propylene, which posted a significant 5.1-million-barrel build and now stands 9% above the five-year average.
Total commercial petroleum inventories (crude plus refined products) declined by 4.2 million barrels on the week, reinforcing the overall tightening of US crude and products.


A classic case of “buy the rumor, sell the news” played out in oil markets, as Brent crude has dropped sharply – down nearly USD 10 per barrel since yesterday evening – following Iran’s retaliatory strike on a U.S. air base in Qatar. The immediate reaction was: “That was it?” The strike followed a carefully calibrated, non-escalatory playbook, avoiding direct threats to energy infrastructure or disruption of shipping through the Strait of Hormuz – thus calming worst-case fears.
After Monday morning’s sharp spike to USD 81.4 per barrel, triggered by the U.S. bombing of Iranian nuclear facilities, oil prices drifted sideways in anticipation of a potential Iranian response. That response came with advance warning and caused limited physical damage. Early this morning, both the U.S. President and Iranian state media announced a ceasefire, effectively placing a lid on the immediate conflict risk – at least for now.
As a result, Brent crude has now fallen by a total of USD 12 from Monday’s peak, currently trading around USD 69 per barrel.
Looking beyond geopolitics, the market will now shift its focus to the upcoming OPEC+ meeting in early July. Saudi Arabia’s decision to increase output earlier this year – despite falling prices – has drawn renewed attention considering recent developments. Some suggest this was a response to U.S. pressure to offset potential Iranian supply losses.
However, consensus is that the move was driven more by internal OPEC+ dynamics. After years of curbing production to support prices, Riyadh had grown frustrated with quota-busting by several members (notably Kazakhstan). With Saudi Arabia cutting up to 2 million barrels per day – roughly 2% of global supply – returns were diminishing, and the risk of losing market share was rising. The production increase is widely seen as an effort to reassert leadership and restore discipline within the group.
That said, the FT recently stated that, the Saudis remain wary of past missteps. In 2018, Riyadh ramped up output at Trump’s request ahead of Iran sanctions, only to see prices collapse when the U.S. granted broad waivers – triggering oversupply. Officials have reportedly made it clear they don’t intend to repeat that mistake.
The recent visit by President Trump to Saudi Arabia, which included agreements on AI, defense, and nuclear cooperation, suggests a broader strategic alignment. This has fueled speculation about a quiet “pump-for-politics” deal behind recent production moves.
Looking ahead, oil prices have now retraced the entire rally sparked by the June 13 Israel–Iran escalation. This retreat provides more political and policy space for both the U.S. and Saudi Arabia. Specifically, it makes it easier for Riyadh to scale back its three recent production hikes of 411,000 barrels each, potentially returning to more moderate increases of 137,000 barrels for August and September.
In short: with no major loss of Iranian supply to the market, OPEC+ – led by Saudi Arabia – no longer needs to compensate for a disruption that hasn’t materialized, especially not to please the U.S. at the cost of its own market strategy. As the Saudis themselves have signaled, they are unlikely to repeat previous mistakes.
Conclusion: With Brent now in the high USD 60s, buying oil looks fundamentally justified. The geopolitical premium has deflated, but tensions between Israel and Iran remain unresolved – and the risk of missteps and renewed escalation still lingers. In fact, even this morning, reports have emerged of renewed missile fire despite the declared “truce.” The path forward may be calmer – but it is far from stable.
Analys
A muted price reaction. Market looks relaxed, but it is still on edge waiting for what Iran will do
Brent crossed the 80-line this morning but quickly fell back assigning limited probability for Iran choosing to close the Strait of Hormuz. Brent traded in a range of USD 70.56 – 79.04/b last week as the market fluctuated between ”Iran wants a deal” and ”US is about to attack Iran”. At the end of the week though, Donald Trump managed to convince markets (and probably also Iran) that he would make a decision within two weeks. I.e. no imminent attack. Previously when when he has talked about ”making a decision within two weeks” he has often ended up doing nothing in the end. The oil market relaxed as a result and the week ended at USD 77.01/b which is just USD 6/b above the year to date average of USD 71/b.

Brent jumped to USD 81.4/b this morning, the highest since mid-January, but then quickly fell back to a current price of USD 78.2/b which is only up 1.5% versus the close on Friday. As such the market is pricing a fairly low probability that Iran will actually close the Strait of Hormuz. Probably because it will hurt Iranian oil exports as well as the global oil market.
It was however all smoke and mirrors. Deception. The US attacked Iran on Saturday. The attack involved 125 warplanes, submarines and surface warships and 14 bunker buster bombs were dropped on Iranian nuclear sites including Fordow, Natanz and Isfahan. In response the Iranian Parliament voted in support of closing the Strait of Hormuz where some 17 mb of crude and products is transported to the global market every day plus significant volumes of LNG. This is however merely an advise to the Supreme leader Ayatollah Ali Khamenei and the Supreme National Security Council which sits with the final and actual decision.
No supply of oil is lost yet. It is about the risk of Iran closing the Strait of Hormuz or not. So far not a single drop of oil supply has been lost to the global market. The price at the moment is all about the assessed risk of loss of supply. Will Iran choose to choke of the Strait of Hormuz or not? That is the big question. It would be painful for US consumers, for Donald Trump’s voter base, for the global economy but also for Iran and its population which relies on oil exports and income from selling oil out of that Strait as well. As such it is not a no-brainer choice for Iran to close the Strait for oil exports. And looking at the il price this morning it is clear that the oil market doesn’t assign a very high probability of it happening. It is however probably well within the capability of Iran to close the Strait off with rockets, mines, air-drones and possibly sea-drones. Just look at how Ukraine has been able to control and damage the Russian Black Sea fleet.
What to do about the highly enriched uranium which has gone missing? While the US and Israel can celebrate their destruction of Iranian nuclear facilities they are also scratching their heads over what to do with the lost Iranian nuclear material. Iran had 408 kg of highly enriched uranium (IAEA). Almost weapons grade. Enough for some 10 nuclear warheads. It seems to have been transported out of Fordow before the attack this weekend.
The market is still on edge. USD 80-something/b seems sensible while we wait. The oil market reaction to this weekend’s events is very muted so far. The market is still on edge awaiting what Iran will do. Because Iran will do something. But what and when? An oil price of 80-something seems like a sensible level until something do happen.


USA ska införa 50 procent tull på koppar

Ryska staten siktar på att konfiskera en av landets största guldproducenter

Hur säkrar vi Sveriges tillgång till kritiska metaller och mineral i en ny geopolitisk verklighet?

Lundin Mining ska bli en av de tio största kopparproducenterna i världen

Sommarvädret styr elpriset i Sverige

Uppgången i oljepriset planade ut under helgen

Mahvie Minerals växlar spår – satsar fullt ut på guld

Låga elpriser i sommar – men mellersta Sverige får en ökning

Oljan, guldet och marknadens oroande tystnad

Jonas Lindvall är tillbaka med ett nytt oljebolag, Perthro, som ska börsnoteras
-
 Nyheter4 veckor sedan
Uppgången i oljepriset planade ut under helgen
-
 Nyheter3 veckor sedan
Mahvie Minerals växlar spår – satsar fullt ut på guld
-
 Nyheter4 veckor sedan
Låga elpriser i sommar – men mellersta Sverige får en ökning
-
 Nyheter2 veckor sedan
Oljan, guldet och marknadens oroande tystnad
-
 Nyheter2 veckor sedan
Jonas Lindvall är tillbaka med ett nytt oljebolag, Perthro, som ska börsnoteras
-
Analys4 veckor sedan
Very relaxed at USD 75/b. Risk barometer will likely fluctuate to higher levels with Brent into the 80ies or higher coming 2-3 weeks
-
Analys3 veckor sedan
A muted price reaction. Market looks relaxed, but it is still on edge waiting for what Iran will do
-

 Nyheter2 veckor sedan
Domstolen ger klartecken till Lappland Guldprospektering