

Analys
More US shale oil – But it will be needed

 Price action – Buying now may be as good as it gets in H1-17
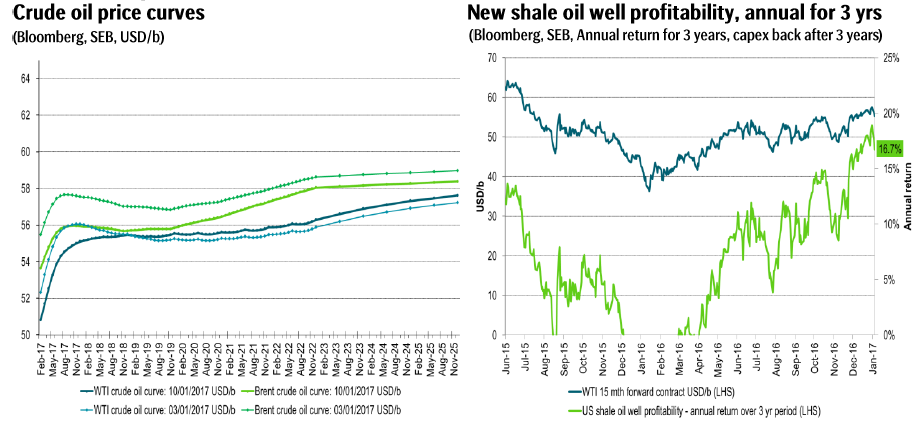
The front month Brent crude oil contract lost 2.4% yesterday with a close of $53.64/b. The longer dated contracts also lost some territory but not as much. Thus the front end of the curve pushed lower as the overly brave bulls who charged into the new year with record high net long WTI speculative positions took cover and shed some of their long specs. Last night the US EIA lifted its US crude oil production forecast for 2017 which also helped to push down the price. At the low Brent traded down to $53.58/b and thus just below the technical level of $53.63/b which we envisioned it would breach in this highly speculatively driven sell-off. We think that few envision that Brent crude at sub-$50/b is a viable price in H1-17 amid OPEC production cuts tightening up the market. If last night’s low of $53.58/b turns out to be the low point remains to be seen. However, we do think that buying in the territory between the current price of $53.88/b (this morning) and down to $50/b is probably as good as it gets for buyers in H1-17. Thus it comes back to this itching decision: Buy now at $53.88/b or hold out for possibly yet lower prices? This evening we have the US EIA’s oil inventory data at 16:00 CET and preliminary data points to no optimism for the bulls this time. The US API last night indicated that US oil inventories last week developed as follows: Crude: +1.5 mb, Gasoline: +1.7 mb and Distillates: +5.5 mb. So up across the board. On Friday we are probably going to see the first weekly rig count which was not impacted and overshadowed by the Christmas holidays. Also it is going to be now a full 6 weeks since OPEC decided to cut production back in Nov 30th and as such the effect of higher prices should start to filter through to higher rig counts. Thus still some bearish events which might hit the oil price bearishly. However, since the start of the year we have seen some increasing instability in both Libya and Nigeria which quickly could turn expectations for higher production to disappointment and thus higher prices.
The US EIA lifts projected US crude production yet higher – Will be the norm in H1-17
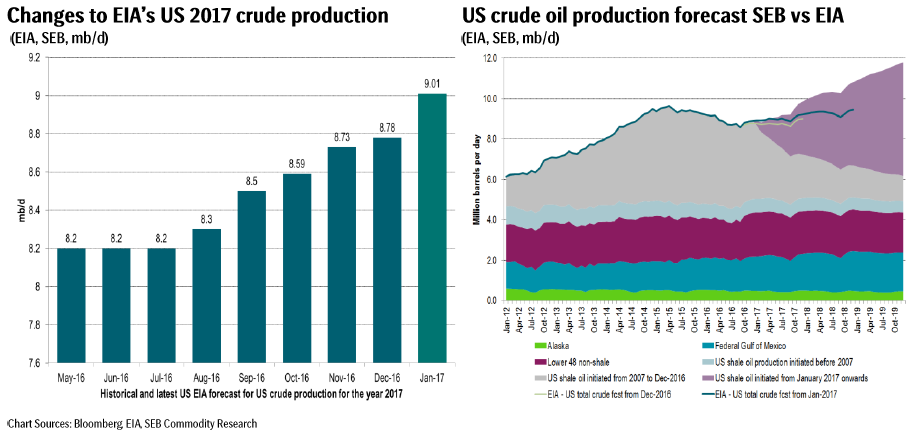
The US EIA yesterday released its January Short Term Energy Outlook (STEO) with yet another solid revision higher for its forecasted US crude oil production. For 2017 it lifted its predicted US crude production by 230 kb/d to 9.01 mb/d on average. Going back to July 2016 it has thus lifted its 2017 prognosis by 810 kb/d. Back in July 2016 it probably assumed no additions of US shale oil rigs for H2-16. A total of 170 rigs were however added into the market and volume productivity also continued to rise at an annual pace of 20%. In our US crude oil model, if we keep the latest updated shale oil volume productivity fixed at latest updated level and move the 170 shale oil rigs added in H2-16 in and out of our model we get a delta production of 502 kb/d of additional US shale oil crude production for 2017 delivery. Back in 2016 we stated that September 2016 probably would be the low point for US crude oil production. That is now also the forecast from the US EIA.
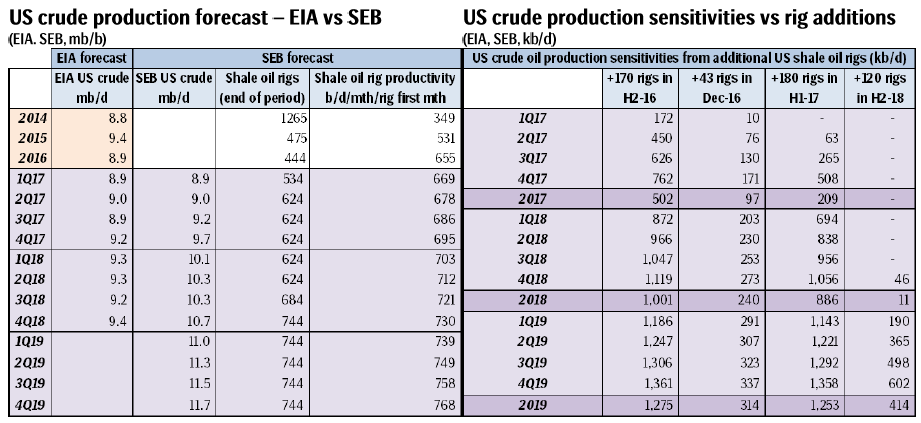
Our calculated return for a new shale oil well investment show that the annual, 3 year return, all money back after 3 years, no tail production profits had an average return of 1.2% in H1-16, 11.3% return in H2-16. Since OPEC decided to cut it has however averaged 16.7% boosting the incentive to invest yet further.
For H1-17 we expect 30 rigs per month or a total of 180 rigs for the half year to be added to the market as oil prices stay at $55-60/b during the period. In our view +180 rigs for H1-17 is a cautious estimate given that profitability for new shale oil investments will be substantially higher in H1-17 than in H2-16. We calculate that the extra 180 rigs in H1-17 will add 209 kb/d to our supply forecast for 2017 and 886 kb/d to our supply forecast for 2018. Only by bringing no additional rigs going forward do we get a US crude oil supply forecast on par with the latest US EIA forecast. As such we expect 30 rigs to be added each month through H1-17 and following we expect the US EIA to lift its 2017 and 2018 US crude oil production every month accordingly. Thus the relentless increase in US EIA’s forecasted US crude production which we experienced through H2-16 is set to continue also in H1-17. As far as we can see the US EIA hardly assumes any additional US shale oil rigs to be added into the market in H1-17 versus what is already active at the moment. We calculate every 30 shale oil rigs added and activated in H1-17 will add approximately 150 kb/d to the US 2018 crude production.
We expect to see constant revisions higher for US shale oil production in H1-17 by the EIA. This is not necessarily so bad because we think the oil will be needed. But the market will not need more rigs in H2-17 and the oil price has to adjust lower in H2-17 in order to avoid yet more rigs into the market.
Selected graphs and tables
Kind regards
Bjarne Schieldrop
Chief analyst, Commodities
SEB Markets
Merchant Banking
The latest weekly report from the US DOE showed a substantial drawdown across key petroleum categories, adding more upside potential to the fundamental picture.

Commercial crude inventories (excl. SPR) fell by 5.8 million barrels, bringing total inventories down to 415.1 million barrels. Now sitting 11% below the five-year seasonal norm and placed in the lowest 2015-2022 range (see picture below).
Product inventories also tightened further last week. Gasoline inventories declined by 2.1 million barrels, with reductions seen in both finished gasoline and blending components. Current gasoline levels are about 3% below the five-year average for this time of year.
Among products, the most notable move came in diesel, where inventories dropped by almost 4.1 million barrels, deepening the deficit to around 20% below seasonal norms – continuing to underscore the persistent supply tightness in diesel markets.
The only area of inventory growth was in propane/propylene, which posted a significant 5.1-million-barrel build and now stands 9% above the five-year average.
Total commercial petroleum inventories (crude plus refined products) declined by 4.2 million barrels on the week, reinforcing the overall tightening of US crude and products.


A classic case of “buy the rumor, sell the news” played out in oil markets, as Brent crude has dropped sharply – down nearly USD 10 per barrel since yesterday evening – following Iran’s retaliatory strike on a U.S. air base in Qatar. The immediate reaction was: “That was it?” The strike followed a carefully calibrated, non-escalatory playbook, avoiding direct threats to energy infrastructure or disruption of shipping through the Strait of Hormuz – thus calming worst-case fears.
After Monday morning’s sharp spike to USD 81.4 per barrel, triggered by the U.S. bombing of Iranian nuclear facilities, oil prices drifted sideways in anticipation of a potential Iranian response. That response came with advance warning and caused limited physical damage. Early this morning, both the U.S. President and Iranian state media announced a ceasefire, effectively placing a lid on the immediate conflict risk – at least for now.
As a result, Brent crude has now fallen by a total of USD 12 from Monday’s peak, currently trading around USD 69 per barrel.
Looking beyond geopolitics, the market will now shift its focus to the upcoming OPEC+ meeting in early July. Saudi Arabia’s decision to increase output earlier this year – despite falling prices – has drawn renewed attention considering recent developments. Some suggest this was a response to U.S. pressure to offset potential Iranian supply losses.
However, consensus is that the move was driven more by internal OPEC+ dynamics. After years of curbing production to support prices, Riyadh had grown frustrated with quota-busting by several members (notably Kazakhstan). With Saudi Arabia cutting up to 2 million barrels per day – roughly 2% of global supply – returns were diminishing, and the risk of losing market share was rising. The production increase is widely seen as an effort to reassert leadership and restore discipline within the group.
That said, the FT recently stated that, the Saudis remain wary of past missteps. In 2018, Riyadh ramped up output at Trump’s request ahead of Iran sanctions, only to see prices collapse when the U.S. granted broad waivers – triggering oversupply. Officials have reportedly made it clear they don’t intend to repeat that mistake.
The recent visit by President Trump to Saudi Arabia, which included agreements on AI, defense, and nuclear cooperation, suggests a broader strategic alignment. This has fueled speculation about a quiet “pump-for-politics” deal behind recent production moves.
Looking ahead, oil prices have now retraced the entire rally sparked by the June 13 Israel–Iran escalation. This retreat provides more political and policy space for both the U.S. and Saudi Arabia. Specifically, it makes it easier for Riyadh to scale back its three recent production hikes of 411,000 barrels each, potentially returning to more moderate increases of 137,000 barrels for August and September.
In short: with no major loss of Iranian supply to the market, OPEC+ – led by Saudi Arabia – no longer needs to compensate for a disruption that hasn’t materialized, especially not to please the U.S. at the cost of its own market strategy. As the Saudis themselves have signaled, they are unlikely to repeat previous mistakes.
Conclusion: With Brent now in the high USD 60s, buying oil looks fundamentally justified. The geopolitical premium has deflated, but tensions between Israel and Iran remain unresolved – and the risk of missteps and renewed escalation still lingers. In fact, even this morning, reports have emerged of renewed missile fire despite the declared “truce.” The path forward may be calmer – but it is far from stable.
Analys
A muted price reaction. Market looks relaxed, but it is still on edge waiting for what Iran will do
Brent crossed the 80-line this morning but quickly fell back assigning limited probability for Iran choosing to close the Strait of Hormuz. Brent traded in a range of USD 70.56 – 79.04/b last week as the market fluctuated between ”Iran wants a deal” and ”US is about to attack Iran”. At the end of the week though, Donald Trump managed to convince markets (and probably also Iran) that he would make a decision within two weeks. I.e. no imminent attack. Previously when when he has talked about ”making a decision within two weeks” he has often ended up doing nothing in the end. The oil market relaxed as a result and the week ended at USD 77.01/b which is just USD 6/b above the year to date average of USD 71/b.

Brent jumped to USD 81.4/b this morning, the highest since mid-January, but then quickly fell back to a current price of USD 78.2/b which is only up 1.5% versus the close on Friday. As such the market is pricing a fairly low probability that Iran will actually close the Strait of Hormuz. Probably because it will hurt Iranian oil exports as well as the global oil market.
It was however all smoke and mirrors. Deception. The US attacked Iran on Saturday. The attack involved 125 warplanes, submarines and surface warships and 14 bunker buster bombs were dropped on Iranian nuclear sites including Fordow, Natanz and Isfahan. In response the Iranian Parliament voted in support of closing the Strait of Hormuz where some 17 mb of crude and products is transported to the global market every day plus significant volumes of LNG. This is however merely an advise to the Supreme leader Ayatollah Ali Khamenei and the Supreme National Security Council which sits with the final and actual decision.
No supply of oil is lost yet. It is about the risk of Iran closing the Strait of Hormuz or not. So far not a single drop of oil supply has been lost to the global market. The price at the moment is all about the assessed risk of loss of supply. Will Iran choose to choke of the Strait of Hormuz or not? That is the big question. It would be painful for US consumers, for Donald Trump’s voter base, for the global economy but also for Iran and its population which relies on oil exports and income from selling oil out of that Strait as well. As such it is not a no-brainer choice for Iran to close the Strait for oil exports. And looking at the il price this morning it is clear that the oil market doesn’t assign a very high probability of it happening. It is however probably well within the capability of Iran to close the Strait off with rockets, mines, air-drones and possibly sea-drones. Just look at how Ukraine has been able to control and damage the Russian Black Sea fleet.
What to do about the highly enriched uranium which has gone missing? While the US and Israel can celebrate their destruction of Iranian nuclear facilities they are also scratching their heads over what to do with the lost Iranian nuclear material. Iran had 408 kg of highly enriched uranium (IAEA). Almost weapons grade. Enough for some 10 nuclear warheads. It seems to have been transported out of Fordow before the attack this weekend.
The market is still on edge. USD 80-something/b seems sensible while we wait. The oil market reaction to this weekend’s events is very muted so far. The market is still on edge awaiting what Iran will do. Because Iran will do something. But what and when? An oil price of 80-something seems like a sensible level until something do happen.


Nickelmarknaden under fortsatt press – överskott väntas bestå till 2026

Westinghouse planerar tio nya stora kärnreaktorer i USA – byggstart senast 2030

Eurobattery Minerals förvärvar majoritet i spansk volframgruva

USA ska införa 50 procent tull på koppar

Ryska staten siktar på att konfiskera en av landets största guldproducenter

Mahvie Minerals växlar spår – satsar fullt ut på guld
A muted price reaction. Market looks relaxed, but it is still on edge waiting for what Iran will do

Jonas Lindvall är tillbaka med ett nytt oljebolag, Perthro, som ska börsnoteras

Oljan, guldet och marknadens oroande tystnad

Domstolen ger klartecken till Lappland Guldprospektering
-
 Nyheter4 veckor sedan
Mahvie Minerals växlar spår – satsar fullt ut på guld
-
Analys4 veckor sedan
A muted price reaction. Market looks relaxed, but it is still on edge waiting for what Iran will do
-
 Nyheter3 veckor sedan
Jonas Lindvall är tillbaka med ett nytt oljebolag, Perthro, som ska börsnoteras
-
 Nyheter3 veckor sedan
Oljan, guldet och marknadens oroande tystnad
-
 Nyheter3 veckor sedan
Domstolen ger klartecken till Lappland Guldprospektering
-
Analys3 veckor sedan
Tightening fundamentals – bullish inventories from DOE
-
 Nyheter2 veckor sedan
Ryska staten siktar på att konfiskera en av landets största guldproducenter
-

 Nyheter2 veckor sedan
Sommarvädret styr elpriset i Sverige