

Analys
US crude oil 2018 production forecast by EIA still too low

 Price action – Higher on Nigeria strike, Fortis pipeline outage, lower oil rig count, softer USD and positive equities
Brent crude is gaining 0.9% this morning as it climbs to $63.8/b along with a 0.2% softer USD index and positive equity gains. A part of the positive oil price drive today is the Nigerian oil union declaring a strike as they protest against unfair labour practices thus posing a risk to Nigeria’s production of 1.7 mb/d. The Fortis pipeline carrying xxx kb/d is still off-line with the operator declares force majeure as it expects repairs of the hairline will take some 2-4 weeks. The key concern is that there might be a wider problem stretching along the whole pipeline. If the reason for the current crack is the higher sulphur content in the Buzzard crude flowing in the Fortis crude stream and sulphide corrosion as a consequence of this then the outage of the pipe could be much, much longer. The pipe carries some 450 kb/d and thus a major share of the physical supply into the Brent spot market. A decline of 2 US oil rigs last week adds some support on the margin.
Crude oil comment – US crude oil 2018 production forecast by EIA still too low
Later today we’ll have the monthly update from the US EIA on shale oil drilling productivity in the US. We expect the EIA to revise its productivity as well as its production higher. Their last productivity report had data points to Dec 2017. We expect the EIA to show that the strong production growth of on average 91 kb/d/mth from July to December this year stays intact at around 90 kb/d/mth also in January and also that well completions continued to rise also in November as they have done every month since January this year.
We do not think that the EIA update later today will necessarily hit the Brent crude oil price bearishly. More likely we expect the Brent to WTI price spread to widen further on the back of such news.
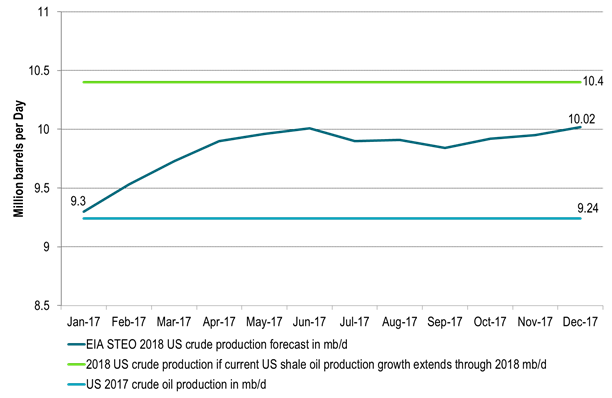
The US EIA last Tuesday adjusted its 2018 forecast for US crude oil production upwards from 9.95 mb/d to an average of 10.02 mb/d thus growing 0.78 mb/d y/y to 2018. The increase in forecast of 70 kb/d was the third upwards revision in three months. We still think that the US EIA is significantly behind the curve in terms of its projections for US crude oil production for 2018. As such we expect the US EIA to continue to revise its projection for 2018 higher in the months to come until it reaches at least an average crude oil production of around 10.4 mb/d for 2018.
US shale oil production growth is currently running at some 90 kb/d/mth. That is the exit shale oil growth rate for 2017 while the average growth rate from July to December has been 91 kb/d/mth. The implied marginal, annualized production growth rate is thus currently running at 1.1 mb/d/yr. The US EIA is however assuming that US shale oil production will only grow by some 37 kb/d/mth in 2018. That is 40% lower than the current growth rate in shale oil production. From Dec-17 to Dec-18 the EIA projects that US lower 48 (ex GoM) will grow by only 440 kb/d. If we instead apply the current 90 kb/d/mth growth rate through 2018 then L48 ex GoM would grow by 1.1 mb/d from Dec-17 to Dec-18.
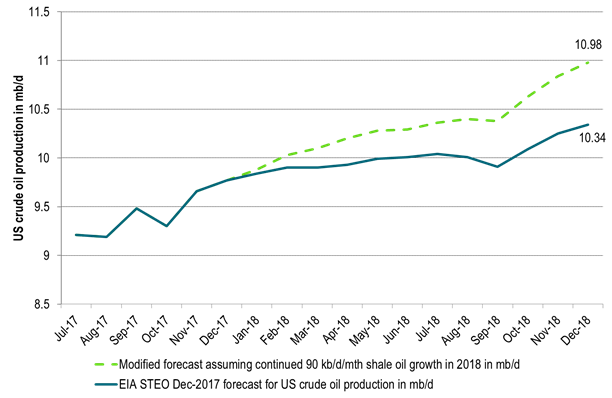
If we extrapolate the current shale oil production growth rate through 2018 it would lead US crude oil production to exit 2018 at 11 mb/d versus EIA’s forecast of 10.34 mb/d. If we include NGLs, Bio-fuels and refinery gains it would lift total US liquids production to close to 18 mb/d in December 2018 and drive total US liquids production growth to 1.7 mb/d y/y Dec-17 to Dec-18.
US shale oil well completions is still rising (+35 wells m/m in October), the drilled but uncompleted numbers of wells is still rising and oil prices have been on a constant trend upwards since mid-June . So if anything the current trend is for stronger US shale oil production growth month/month in the months ahead and not at all the sudden drop-off in shale oil production growth which the EIA predicts for 1Q18 where they expect a monthly average growth rate of only 23 kb/d/mth.
We think that one of the key reasons for why the US EIA has a too low production growth target for 2018 is due to the build-up in the DUC (Drilled but uncompleted wells) inventory which gives an impression of declining shale oil volume productivity. This decline in volume productivity is in our view not real. In our calculations we see US shale oil volume drilling productivity has continued to tick higher even though now mostly sideways. But at least we do not see productivity in decline as the official headline numbers indicate.
There is a lot of focus on a shift in investor focus from rewarding production growth and now instead demanding profits. This could possibly change shale oil producer behaviour and as such lead to softer US shale oil production growth than indicated above.
In our view such a shift should primarily hit drilling rather than completions as the shale oil companies have a huge stack of uncompleted wells which they can convert to oil and money in 2018. They can ease back on the drilling and continue to ramp up completions. Completions have been trailing drilling for a full year now. If shale oil companies pull back on investments then this should switch around in 2018 to a situation where drilling is lower than completions while spending on completions continues at a high level and drilling at a lower. Completions in 2018 could run some 20% above the Jan to Oct average completion level of 2017.
In terms of capex spending we had news last week that Keane Group, one of the largest pure-play providers of US shale completion services yesterday announced that they will order three new frac fleets on top of their existing 26. The order is a response to robust 2018 US shale oil investments announced latest weeks. Completions are the thing for 2018 which means more shale oil production.
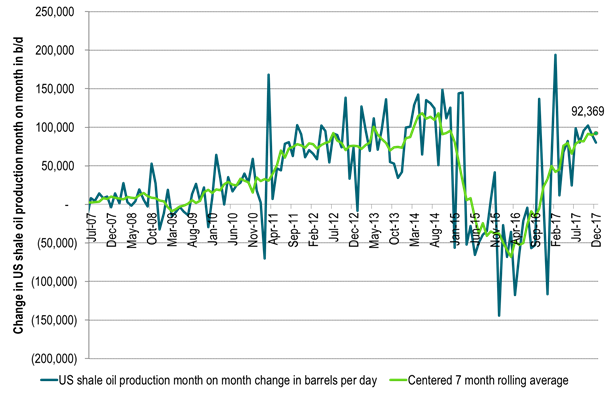
Ch1: US shale oil production growth is exiting 2017 at a rate of about 90 kb/d/mth (1.1 mb/d on a marginal annualized rate)
It is now growing as strongly as it did through 2012 and 2013
Ch2: If US shale oil production grows in 2018 as it exits 2017 (~90 kb/d/mth) then total US crude production will grow by 1.1 mb/d y/y to 10.4 mb/d y/y
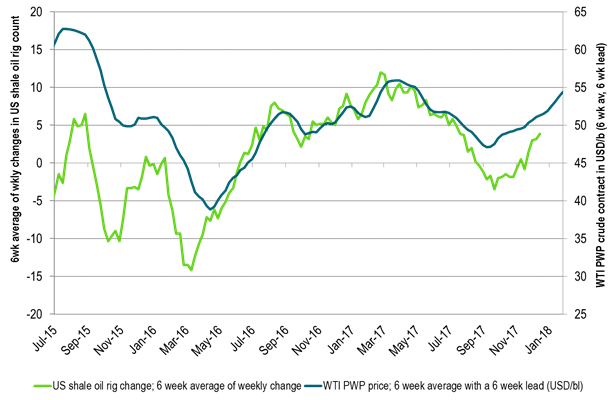
Ch3: The Production Weighting Price (PWP) of a new shale oil well with a 6 week lead has moved higher since Sep
If history is anything to go by then US shale oil action will increase in response. Drilling and or completions
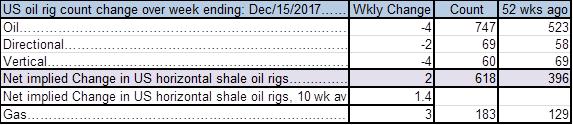
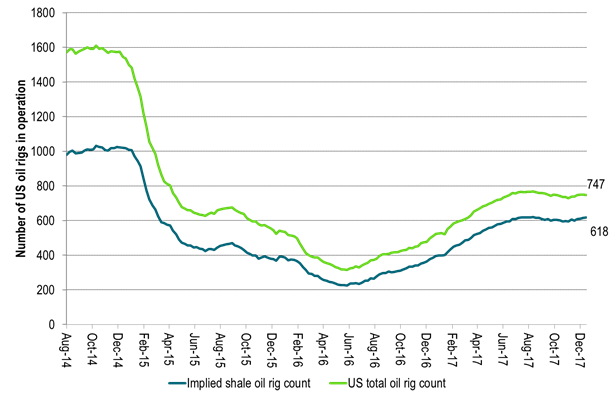
Ch4: US oil rig count moved down 4 last week but implied shale oil rigs increased by 2
US oil rig count is up by 22 over the last 5 weeks which is 17 rigs shy of the level in August
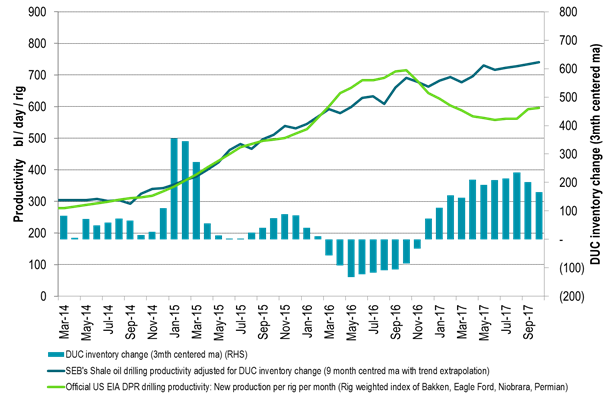
Ch5: The mirage of declining shale oil productivity created from the large build-up in DUCs (uncompleted wells)
The official US shale oil productivity was running higher than our estimate during the DUC draw down in 2016.
It is running way below our productivity estimate in 2017 during a huge build up in the DUC inventory during 2017.
As the DUC inventory eventually draws down the official productivity will again be running above our estimate
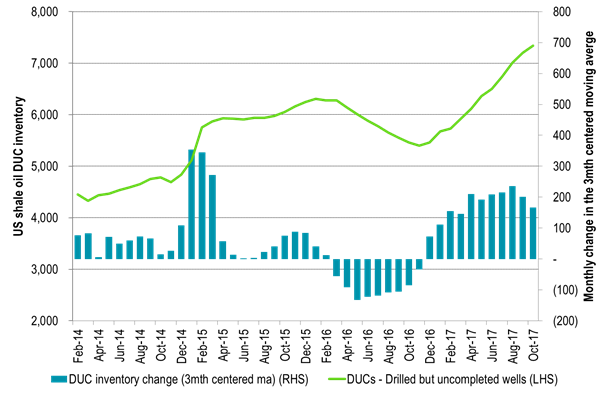
Ch6: A lot of uncompleted wells to complete in 2018!!
The DUC inventory was still BUILDING in October (the last data point)
So drilling new wells can decline a lot in 2018 while completions can increase some 20% y/y
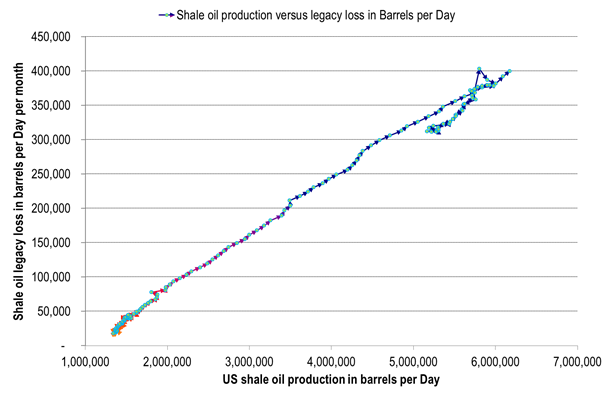
Ch7: No top-down sign that US shale oil resources are deteriorating as losses in existing production stays on scale to production level
No top-down sign as of yet of run-away losses in existing production versus production level
Ch8: US EIA crude oil production forecast likely to be lifted further up towards 10.4 mb/d
EIA lifting it forecast 3 mths in a row
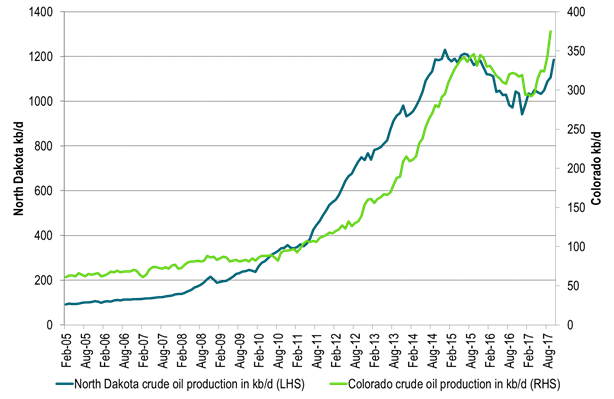
Ch9: Volume wise there are good shale oil days in both Colorado and Bakken North Dakota these days
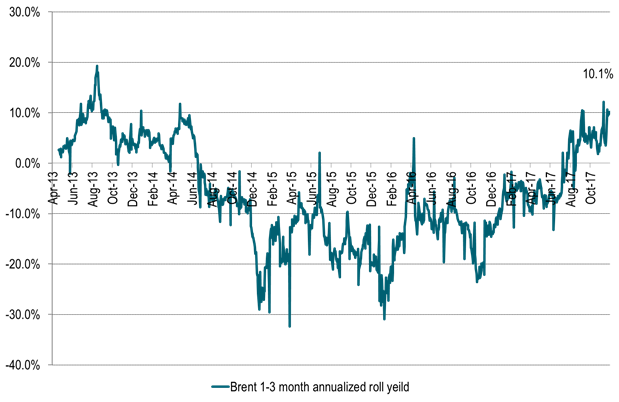
Ch10: Annualized 1-3 mth Brent backwardation fully funded roll-yield of 10% pa
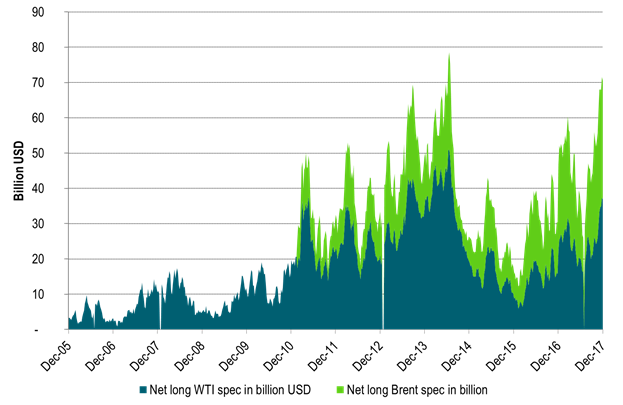
Ch11: The positive roll-yield in Brent continues to suck in more long spec into both Brent and WTI front end crude’
Kind regards
Bjarne Schieldrop
Chief analyst, Commodities
SEB Markets
Merchant Banking
Parts of the Brent crude curve dipping into the high $50ies/b. Brent crude fell 2.3% over the week to Friday. It closed the week at $61.29/b, a slight gain on the day, but also traded to a low of $60.14/b that same day and just barely avoided trading into the $50ies/b. This morning it is risk-on in equities which seems to help industrial metals a little higher. But no such luck for oil. It is down 0.8% at $60.8/b. This week looks set for Brent crude to dip its feet in the $50ies/b. The Brent 3mth contract actually traded into the high $50ies/b on Friday.

The front-end backwardation has been on a weakening foot and is now about to fully disappear. The lowest point of the crude oil curve has also moved steadily lower and lower and its discount to the 5yr contract is now $6.8/b. A solid contango. The Brent 3mth contract did actually dip into the $50ies/b intraday on Friday when it traded to a low point of $59.93/b.
More weakness to come as lots of oil at sea comes to ports. Mid-East OPEC countries have boosted exports along with lower post summer consumption and higher production. The result is highly visibly in oil at sea which increased by 17 mb to 1,311 mb over the week to Sunday. Up 185 mb since mid-August. On its way to discharge at a port somewhere over the coming month or two.
Don’t forget that the oil market path ahead is all down to OPEC+. Remember that what is playing out in the oil market now is all by design by OPEC+. The group has decided that the unwind of the voluntary cuts is what it wants to do. In a combination of meeting demand from consumers as well as taking back market share. But we need to remember that how this plays out going forward is all at the mercy of what OPEC+ decides to do. It will halt the unwinding at some point. It will revert to cuts instead of unwind at some point.
A few months with Brent at $55/b and 40-50 US shale oil rigs kicked out may be what is needed. We think OPEC+ needs to see the exit of another 40-50 drilling rigs in the US shale oil patches to set US shale oil production on a path to of a 1 mb/d year on year decline Dec-25 to Dec-26. We are not there yet. But a 2-3 months period with Brent crude averaging $55/b would probably do it.
Oil on water increased 17 mb over the week to Sunday while oil in transit increased by 23 mb. So less oil was standing still. More was moving.

Crude oil floating storage (stationary more than 7 days). Down 11 mb over week to Sunday

The lowest point of the Brent crude oil curve versus the 5yr contract. Weakest so far this year.

Crude oil 1mth to 3mth time-spreads. Dubai held out strongly through summer, but then that center of strength fell apart in late September and has been leading weakness in crude curves lower since then.

Rebounding along with most markets. But concerns over solidity of Gaza peace may also contribute. Brent crude fell 0.8% yesterday to $61.91/b and its lowest close since May this year. This morning it is bouncing up 0.9% to $62.5/b along with a softer USD amid positive sentiment with both equities and industrial metals moving higher. Concerns that the peace in Gaza may be less solid than what one might hope for also yields some support to Brent. Bets on tech stocks are rebounding, defying fears of trade war. Money moving back into markets. Gold continues upwards its strong trend and a softer dollar helps it higher today as well.
US crude & products probably rose 5.6 mb last week (API) versus a normal seasonal decline of 2.4 mb. The US API last night partial and thus indicative data for US oil inventories. Their data indicates that US crude stocks rose 7.4 mb last week, gasoline stocks rose 3.0 mb while Distillate stocks fell 4.8 mb. Altogether an increase in commercial crude and product stocks of 5.6 mb. Commercial US crude and product stocks normally decline by 2.4 mb this time of year. So seasonally adjusted the US inventories rose 8 mb last week according to the indicative numbers by the API. That is a lot. Also, the counter seasonal trend of rising stocks versus normally declining stocks this time of year looks on a solid pace of continuation. If the API is correct then total US crude and product stocks would stand 41 mb higher than one year ago and 6 mb higher than the 2015-19 average. And if we combine this with our knowledge of a sharp increase in production and exports by OPEC(+) and a large increase in oil at sea, then the current trend in US oil inventories looks set to continue. So higher stocks and lower crude oil prices until OPEC(+) switch to cuts. Actual US oil inventory data today at 18:00 CET.
US commercial crude and product stocks rising to 1293 mb in week 41 if last nights indicative numbers from API are correct.

Crude oil soon coming to a port near you. OPEC has lifted production sharply higher this autumn. At the same time demand for oil in the Middle-East has fallen as we have moved out of summer heat and crude oil burn for power for air-conditioning. The Middle-East oil producers have thus been able to lift exports higher on both accounts. Crude oil and condensates on water has shot up by 177 mb since mid-August. This oil is now on its way to ports around the world. And when they arrive, it will likely help to lift stocks onshore higher. That is probably when we will lose the last bit of front-end backwardation the the crude oil curves. That will help to drive the front-month Brent crude oil price down to the $60/b line and revisit the high $50ies/b. Then the eyes will be all back on OPEC+ when they meet in early November and then again in early December.
Crude oil and condensates at sea have moved straight up by 177 mb since mid-August as OPEC(+) has produced more, consumed less and exported more.

When it starts to move lower it moves rather quickly. Gaza, China, IEA. Brent crude is down 2.1% today to $62/b after having traded as high as $66.58/b last Thursday and above $70/b in late September. The sell-off follows the truce/peace in Gaze, a flareup in US-China trade and yet another bearish oil outlook from the IEA.
A lasting peace in Gaze could drive crude oil at sea to onshore stocks. A lasting peace in Gaza would probably calm down the Houthis and thus allow more normal shipments of crude oil to sail through the Suez Canal, the Red Sea and out through the Bab-el-Mandeb Strait. Crude oil at sea has risen from 48 mb in April to now 91 mb versus a pre-Covid normal of about 50-60 mb. The rise to 91 mb is probably the result of crude sailing around Africa to be shot to pieces by the Houthis. If sailings were to normalize through the Suez Canal, then it could free up some 40 mb in transit at sea moving onshore into stocks.
The US-China trade conflict is of course bearish for demand if it continues.
Bearish IEA yet again. Getting closer to 2026. Credibility rises. We expect OPEC to cut end of 2025. The bearish monthly report from the IEA is what it is, but the closer we get to 2026, the more likely the IEA is of being ball-park right in its outlook. In its monthly report today the IEA estimates that the need for crude oil from OPEC in 2026 will be 25.4 mb/d versus production by the group in September of 29.1 mb/d. The group thus needs to do some serious cutting at the end of 2025 if it wants to keep the market balanced and avoid inventories from skyrocketing. Given that IEA is correct that is. We do however expect OPEC to implement cuts to avoid a large increase in inventories in Q1-26. The group will probably revert to cuts either at its early December meeting when they discuss production for January or in early January when they discuss production for February. The oil price will likely head yet lower until the group reverts to cuts.
Dubai: The Mid-East anchor dragging crude oil lower. Surplus emerging in Mid-East pricing. Crude oil prices held surprisingly strong all through the summer. A sign and a key source of that strength came from the strength in the front-end backwardation of the Dubai crude oil curve. It held out strong from mid-June and all until late September with an average 1-3mth time-spread premium of $1.8/b from mid-June to end of September. The 1-3mth time-spreads for Brent and WTI however were in steady deterioration from late June while their flat prices probably were held up by the strength coming from the Persian Gulf. Then in late September the strength in the Dubai curve suddenly collapsed. Since the start of October it has been weaker than both the Brent and the WTI curves. The Dubai 1-3mth time-spread now only stands at $0.25/b. The Middle East is now exporting more as it is producing more and also consuming less following elevated summer crude burn for power (Aircon) etc.
The only bear-element missing is a sudden and solid rise in OECD stocks. The only thing that is missing for the bear-case everyone have been waiting for is a solid, visible rise in OECD stocks in general and US oil stocks specifically. So watch out for US API indications tomorrow and official US oil inventories on Thursday.
No sign of any kind of fire-sale of oil from Saudi Arabia yet. To what we can see, Saudi Arabia is not at all struggling to sell its oil. It only lowered its Official Selling Prices (OSPs) to Asia marginally for November. A surplus market + Saudi determination to sell its oil to the market would normally lead to a sharp lowering of Saudi OSPs to Asia. Not yet at least and not for November.
The 5yr contract close to fixed at $68/b. Of importance with respect to how far down oil can/will go. When the oil market moves into a surplus then the spot price starts to trade in a large discount to the 5yr contract. Typically $10-15/b below the 5yr contract on average in bear-years (2009, 2015, 2016, 2020). But the 5yr contract is usually pulled lower as well thus making this approach a moving target. But the 5yr contract price has now been rock solidly been pegged to $68/b since 2022. And in the 2022 bull-year (Brent spot average $99/b), the 5yr contract only went to $72/b on average. If we assume that the same goes for the downside and that 2026 is a bear-year then the 5yr goes to $64/b while the spot is trading at a $10-15/b discount to that. That would imply an average spot price next year of $49-54/b. But that is if OPEC doesn’t revert to cuts and instead keeps production flowing. We think OPEC(+) will trim/cut production as needed into 2026 to prevent a huge build-up in global oil stocks and a crash in prices. But for now we are still heading lower. Into the $50ies/b.


Gruvbolaget Boliden överträffade analytikernas förväntningar

Australien och USA investerar 8,5 miljarder USD för försörjningskedja av kritiska mineraler
Brent crude set to dip its feet into the high $50ies/b this week

Vad guldets uppgång egentligen betyder för världen

Spotpriset på guld över 4300 USD och silver över 54 USD

OPEC+ missar produktionsmål, stöder oljepriserna

Goldman Sachs höjer prognosen för guld, tror priset når 4900 USD

Blykalla och amerikanska Oklo inleder ett samarbete
Guld nära 4000 USD och silver 50 USD, därför kan de fortsätta stiga
Are Ukraine’s attacks on Russian energy infrastructure working?
-
 Nyheter4 veckor sedan
OPEC+ missar produktionsmål, stöder oljepriserna
-
 Nyheter2 veckor sedan
Goldman Sachs höjer prognosen för guld, tror priset når 4900 USD
-
 Nyheter3 veckor sedan
Blykalla och amerikanska Oklo inleder ett samarbete
-
 Nyheter3 veckor sedan
Guld nära 4000 USD och silver 50 USD, därför kan de fortsätta stiga
-
Analys4 veckor sedan
Are Ukraine’s attacks on Russian energy infrastructure working?
-

 Nyheter2 veckor sedan
Leading Edge Materials är på rätt plats i rätt tid
-

 Nyheter3 veckor sedan
Ett samtal om guld, olja, koppar och stål
-

 Nyheter2 veckor sedan
Nytt prisrekord, guld stiger över 4000 USD