

Analys
The Permian pipes are coming and it is no small potato


Between 2.2 m bl/d to 2.5 m bl/d of new pipeline capacity from the Permian basin to the US Gulf will be put into operation in a flash of just three quarters (Q3-2019 to Q1-2020). Effective capacity is probably about 1.7 m bl/d to 2.0 m bl/d assuming an 80% utilization rate. The Cactus II (670 k bl/d) from the Permian Basin to the USGC is coming online already the 1st of August. I.e. in only 23 days.
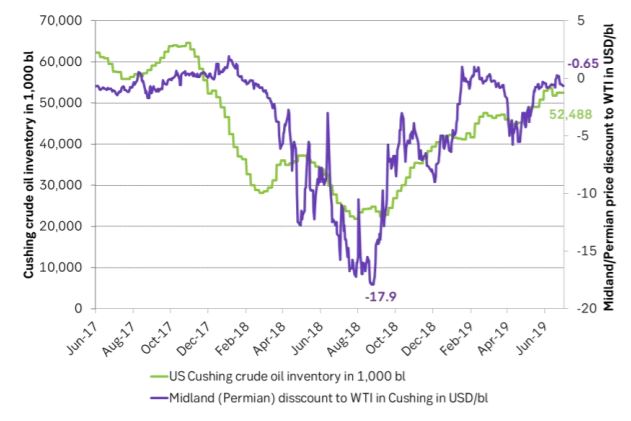
Changes to Texas pipelines had a huge impact on oil prices just one year ago. The Basin/Sunrise pipeline from Midland/Permian to Wichita falls and Cushing Oklahoma then expanded its capacity by a full 500 k bl/d to a total 800 k bl/d. This relieved bulging inventories at depressed prices in the Permian to flow into then very low inventories in Cushing Oklahoma where the WTI is priced. Cushing Oklahoma crude stocks rose strongly, the WTI price crashed, the Brent price crashed and the Midland/Permian price spread to WTI moved from minus $17.9/bl to only minus $0.7/bl today. That is last year’s price action seen from a pipeline perspective.
Now we are set for a much larger change to pipelines in the Permian and it will happen in just three quarters and start already in 23 days.

There has been a significant dislocation between Brent crude oil prices and WTI prices in 2019. The WTI crude curve has been in front end contango while the Brent curve has been in full backwardation and in period exceptionally strong front end backwardation. The two crude curves have told completely different stories. Global Brent market: Too little oil. Local US WTI Cushing Oklahoma market: Too much oil.
When the Cactus II from Wink in Texas (Permian Basin) to Corpus Christi at the USGC (670 k bl/d) comes into operation on 1 August it will release some 4 m barrels from the Permian to the USGC each week (assuming 80% utilization). This will relieve the pressure on other pipelines in Texas. It will for example be much less need to send crude oil from Permian via the Basin/Sunrise pipeline to Cushing Oklahoma. I.e. less crude will flow into Cushing crude stocks from the Permian. It will thus become easier to drain the currently elevated Cushing crude stocks via pipelines to the USGC.
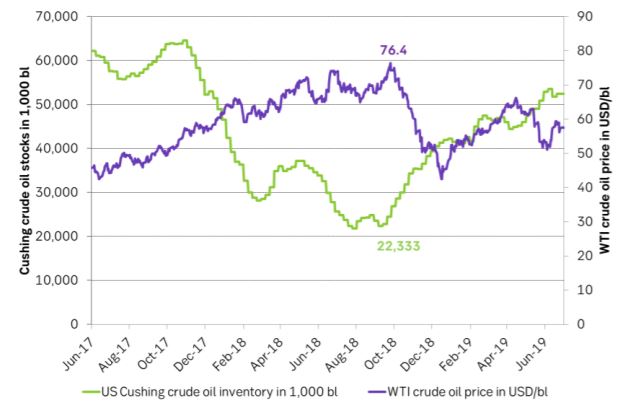
US Cushing crude oil stocks today stands at 52.5 m barrels versus only 22.3 m barrels on the 20th of September last year when the WTI price spiked at $76.4/bl. Cushing is today probably receiving a full flow of crude oil from the Permian Basin via the Basin/Sunrise 800 k bl/d pipeline. At 80% utilization that equals about 4.5 m barrels per week.
This flow of oil from the Permian into Cushing Oklahoma will likely fall partially silent starting 1 August and over the coming three quarters it will definitely fall silent and stop pumping crude oil into Cushing Oklahoma. As the three new pipelines (Cactus II (670 k bl/d), Epic crude (600 – 900 k bl/d) and the Grey Oak (900 k bl/d)) all come online over the next three quarters we might even see that Basin/Sunrise could change direction and help drain Cushing stocks via the Permian to the USGC.
But just halting the flow of oil of about 4.5 m barrels per week from the Permian to Cushing via the Basin/Sunrise pipeline could lead to a decline in Cushing Oklahoma crude oil stocks of 20 m barrels in just one month. That would drag Cushing stocks from 52.3 m barrels today to only 32 m barrels over the course of August alone.
Bullish for WTI and Bearish for Brent. A $2/bl spread is very probable in our view. Needless to say this is bullish for the WTI crude oil curve structure as well as the WTI crude oil flat price. It is also bearish for the Brent crude oil price and crude oil curve structure. The Brent and WTI crude oil price spread will tighten further and the shape of the two crude curves will converge further. Tightness in the global market place will be partially relieved while the WTI market will tighten up significantly.
Will the WTI price move up to Brent or will Brent move down to the WTI price? Global oil producers have enjoyed the luxury of getting a $7.8/bl premium over the WTI price since the start of 2018. The general assumption has been that Brent crude oil will trade in the $60-70/bl range while WTI will trade in the $50-60/bl range. And further that when the new Permian pipelines comes online the next three quarters it will shift the WTI price up towards the global benchmark Brent crude. Or will they maybe meet in the middle or will the Brent crude oil price marker move down to WTI.
We think that the initial action will be a strengthening of the WTI price. The WTI price has over the past 4 years firmly established a price to US inventory relationship. So as US inventories move lower as a result of Permian pipes coming online it will push the WTI price higher on the basis of this established price/inventory relationship.
The Brent crude oil price and curve structure will move towards the WTI curve. The Brent crude curve could move a little lower towards WTI. But a bullish sentiment hitting the WTI price on the back of declining US Cushing crude stocks could even smitten over to the Brent crude oil price and actually lift both the benchmarks. WTI the most and Brent a little.
Our view is that an overweight of global oil investors are hugely focused on the WTI price. Firstly because a large part of them are located in the U.S. Secondly because U.S. oil data are of high quality and published at a high frequency.
It gives a sense of control and that you know what you are doing when you trade WTI on the basis of data you can really trust and see on a high frequency. In other words many oil investors treat the WTI benchmark as THE global benchmark and as a reflection of the global market.
So when US crude inventories decline both in total and locally in Cushing Oklahoma it is taken by investors as a sign of a tightening global oil market even if it in this case is only a shift of oil out of the US and into the global market due to new pipelines coming online from the Permian to the USGC.
Global growth is cooling and oil demand growth along with it but it will likely be countered by an IMO-boost. The global oil market is currently weighted down by continuously deteriorating global growth indicators in combination with still strongly growing US crude oil production. Restraint from OPEC+ and losses of supply from Iran and Venezuela as well as the Russian Druzhba pipeline is helping to prevent oil prices from heading lower and trail the deteriorating global economic growth picture. But elevated US oil inventories and a weak global economic backdrop is preventing oil prices from moving higher.
Global middle distillate demand will likely rise sharply in Q4-19 and H1-20 due to the new IMO 2020 regulations which requires global shipping to consume low sulphur bunker oil. Refineries will have to run hard to meet the added mid-dist demand. We expect this to counter the cooling global growth picture.
H2-19 could see a mix of sharply declining Cushing crude oil stocks and strongly rising mid-dist demand. This could be a very bullish set-up for crude oil prices. Pushing WTI higher on the basis of Cushing crude inventory declines and pulling Brent crude higher on the back of bullish WTI sentiment and strong global mid-dist demand from the shipping side.
Down the road it could be a bit different. WTI would need to move back down to control US shale oil supply growth while Brent crude would follow lower as there would be very little pipeline capacity strains to keep the two benchmarks apart. I.e. we could see WTI back to $55-60/bl and Brent crude only a couple of USD above.
That is of course if we assume that US investors continues to bankroll under-water US shale oil production growth. If US investors demand profits and a positive cash flow from US shale oil producers then WTI would need to move higher in order to keep U.S. shale oil production growing robustly.
More pipelines are coming in 2021. In addition to the 2.2 to 2.5 m bl/d of new pipeline capacity coming online the next three quarters there will be an additional 1.4 to 1.8 m bl/d of pipeline capacity coming online in 2021: The Wink (Permian) to Webster (Houston) 1000 bl/d pipeline and the Seahorse – Tallgrass from Cushing Oklahoma to Louisiana.
What it means is that 1) The Brent to WTI price spread will be narrow over the coming years. 2) That US shale oil producers will receive a crude oil price close to the global price level and the global oil price will stimulate US shale oil production directly without a $7-10/bl discount and 3) That rising U.S. crude oil production will flow freely into the global market place and challenge OPEC+ production in all markets.
US production boom so far has meant declining US oil imports. The effect on OPEC and other non-US producers has been a redirection of oil supply away from the US and instead towards growing demand in Asia. I.e the first phase of the US oil production boom has not been so painful for non-OPEC producers as it primarily has meant a redirection of oil exports.
The next leg of the US oil production boom means US oil exports will challenge non-US producers in the global market. It may be much more difficult for non-US producers to swallow that growing US oil exports challenge them head to head in the global market place. Either stealing all demand growth or even pushing them aside. OPEC+ can probably accept to see their exports at a fixed volume level loosing percentage global market share but with no loss of volumes in absolute terms. But accepting declining volumes in absolute terms is probably a definitely no-go for OPEC+.
This means that US production growth going forward will not be allowed by OPEC+ to grow by more than global demand growth minus production declines (like we have seen in Mexico, China,..).
Ch1: Cushing crude oil stocks were very low one year ago and crude oil was locked up in the Permian basin leading to a very large discount for WTI Midland (Permian) versus WTI Cushing. Then the Basin/Sunrise pipeline expanded capacity by 500 k bl/d to a total of 800 k bl/d in Q4-18. It released oil from Permian to Cushing. Helped to drive Cushing stocks strictly higher and the spread between WTI Midland and WTI Cushing shrank from minus $17.9/bl about in September 2018 to now only minus $0.7/bl
Ch2: As the Cushing crude stocks rose sharply from late September last year the WTI crude oil price totally tanked and dragged the Brent crude oil price lower along with it.
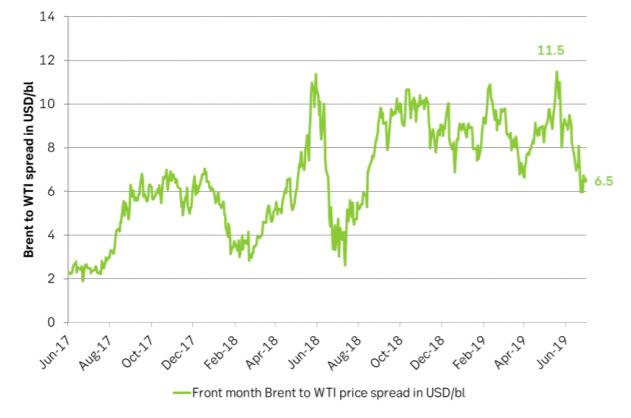
Ch3: The Brent-WTI price spread has moved from a high of $11.5/bl in May last year to now only $5.6/bl. Going forward there will be less and less pipeline constraints and the two grades will move much closer together.
Parts of the Brent crude curve dipping into the high $50ies/b. Brent crude fell 2.3% over the week to Friday. It closed the week at $61.29/b, a slight gain on the day, but also traded to a low of $60.14/b that same day and just barely avoided trading into the $50ies/b. This morning it is risk-on in equities which seems to help industrial metals a little higher. But no such luck for oil. It is down 0.8% at $60.8/b. This week looks set for Brent crude to dip its feet in the $50ies/b. The Brent 3mth contract actually traded into the high $50ies/b on Friday.

The front-end backwardation has been on a weakening foot and is now about to fully disappear. The lowest point of the crude oil curve has also moved steadily lower and lower and its discount to the 5yr contract is now $6.8/b. A solid contango. The Brent 3mth contract did actually dip into the $50ies/b intraday on Friday when it traded to a low point of $59.93/b.
More weakness to come as lots of oil at sea comes to ports. Mid-East OPEC countries have boosted exports along with lower post summer consumption and higher production. The result is highly visibly in oil at sea which increased by 17 mb to 1,311 mb over the week to Sunday. Up 185 mb since mid-August. On its way to discharge at a port somewhere over the coming month or two.
Don’t forget that the oil market path ahead is all down to OPEC+. Remember that what is playing out in the oil market now is all by design by OPEC+. The group has decided that the unwind of the voluntary cuts is what it wants to do. In a combination of meeting demand from consumers as well as taking back market share. But we need to remember that how this plays out going forward is all at the mercy of what OPEC+ decides to do. It will halt the unwinding at some point. It will revert to cuts instead of unwind at some point.
A few months with Brent at $55/b and 40-50 US shale oil rigs kicked out may be what is needed. We think OPEC+ needs to see the exit of another 40-50 drilling rigs in the US shale oil patches to set US shale oil production on a path to of a 1 mb/d year on year decline Dec-25 to Dec-26. We are not there yet. But a 2-3 months period with Brent crude averaging $55/b would probably do it.
Oil on water increased 17 mb over the week to Sunday while oil in transit increased by 23 mb. So less oil was standing still. More was moving.

Crude oil floating storage (stationary more than 7 days). Down 11 mb over week to Sunday

The lowest point of the Brent crude oil curve versus the 5yr contract. Weakest so far this year.

Crude oil 1mth to 3mth time-spreads. Dubai held out strongly through summer, but then that center of strength fell apart in late September and has been leading weakness in crude curves lower since then.

Rebounding along with most markets. But concerns over solidity of Gaza peace may also contribute. Brent crude fell 0.8% yesterday to $61.91/b and its lowest close since May this year. This morning it is bouncing up 0.9% to $62.5/b along with a softer USD amid positive sentiment with both equities and industrial metals moving higher. Concerns that the peace in Gaza may be less solid than what one might hope for also yields some support to Brent. Bets on tech stocks are rebounding, defying fears of trade war. Money moving back into markets. Gold continues upwards its strong trend and a softer dollar helps it higher today as well.
US crude & products probably rose 5.6 mb last week (API) versus a normal seasonal decline of 2.4 mb. The US API last night partial and thus indicative data for US oil inventories. Their data indicates that US crude stocks rose 7.4 mb last week, gasoline stocks rose 3.0 mb while Distillate stocks fell 4.8 mb. Altogether an increase in commercial crude and product stocks of 5.6 mb. Commercial US crude and product stocks normally decline by 2.4 mb this time of year. So seasonally adjusted the US inventories rose 8 mb last week according to the indicative numbers by the API. That is a lot. Also, the counter seasonal trend of rising stocks versus normally declining stocks this time of year looks on a solid pace of continuation. If the API is correct then total US crude and product stocks would stand 41 mb higher than one year ago and 6 mb higher than the 2015-19 average. And if we combine this with our knowledge of a sharp increase in production and exports by OPEC(+) and a large increase in oil at sea, then the current trend in US oil inventories looks set to continue. So higher stocks and lower crude oil prices until OPEC(+) switch to cuts. Actual US oil inventory data today at 18:00 CET.
US commercial crude and product stocks rising to 1293 mb in week 41 if last nights indicative numbers from API are correct.

Crude oil soon coming to a port near you. OPEC has lifted production sharply higher this autumn. At the same time demand for oil in the Middle-East has fallen as we have moved out of summer heat and crude oil burn for power for air-conditioning. The Middle-East oil producers have thus been able to lift exports higher on both accounts. Crude oil and condensates on water has shot up by 177 mb since mid-August. This oil is now on its way to ports around the world. And when they arrive, it will likely help to lift stocks onshore higher. That is probably when we will lose the last bit of front-end backwardation the the crude oil curves. That will help to drive the front-month Brent crude oil price down to the $60/b line and revisit the high $50ies/b. Then the eyes will be all back on OPEC+ when they meet in early November and then again in early December.
Crude oil and condensates at sea have moved straight up by 177 mb since mid-August as OPEC(+) has produced more, consumed less and exported more.

When it starts to move lower it moves rather quickly. Gaza, China, IEA. Brent crude is down 2.1% today to $62/b after having traded as high as $66.58/b last Thursday and above $70/b in late September. The sell-off follows the truce/peace in Gaze, a flareup in US-China trade and yet another bearish oil outlook from the IEA.
A lasting peace in Gaze could drive crude oil at sea to onshore stocks. A lasting peace in Gaza would probably calm down the Houthis and thus allow more normal shipments of crude oil to sail through the Suez Canal, the Red Sea and out through the Bab-el-Mandeb Strait. Crude oil at sea has risen from 48 mb in April to now 91 mb versus a pre-Covid normal of about 50-60 mb. The rise to 91 mb is probably the result of crude sailing around Africa to be shot to pieces by the Houthis. If sailings were to normalize through the Suez Canal, then it could free up some 40 mb in transit at sea moving onshore into stocks.
The US-China trade conflict is of course bearish for demand if it continues.
Bearish IEA yet again. Getting closer to 2026. Credibility rises. We expect OPEC to cut end of 2025. The bearish monthly report from the IEA is what it is, but the closer we get to 2026, the more likely the IEA is of being ball-park right in its outlook. In its monthly report today the IEA estimates that the need for crude oil from OPEC in 2026 will be 25.4 mb/d versus production by the group in September of 29.1 mb/d. The group thus needs to do some serious cutting at the end of 2025 if it wants to keep the market balanced and avoid inventories from skyrocketing. Given that IEA is correct that is. We do however expect OPEC to implement cuts to avoid a large increase in inventories in Q1-26. The group will probably revert to cuts either at its early December meeting when they discuss production for January or in early January when they discuss production for February. The oil price will likely head yet lower until the group reverts to cuts.
Dubai: The Mid-East anchor dragging crude oil lower. Surplus emerging in Mid-East pricing. Crude oil prices held surprisingly strong all through the summer. A sign and a key source of that strength came from the strength in the front-end backwardation of the Dubai crude oil curve. It held out strong from mid-June and all until late September with an average 1-3mth time-spread premium of $1.8/b from mid-June to end of September. The 1-3mth time-spreads for Brent and WTI however were in steady deterioration from late June while their flat prices probably were held up by the strength coming from the Persian Gulf. Then in late September the strength in the Dubai curve suddenly collapsed. Since the start of October it has been weaker than both the Brent and the WTI curves. The Dubai 1-3mth time-spread now only stands at $0.25/b. The Middle East is now exporting more as it is producing more and also consuming less following elevated summer crude burn for power (Aircon) etc.
The only bear-element missing is a sudden and solid rise in OECD stocks. The only thing that is missing for the bear-case everyone have been waiting for is a solid, visible rise in OECD stocks in general and US oil stocks specifically. So watch out for US API indications tomorrow and official US oil inventories on Thursday.
No sign of any kind of fire-sale of oil from Saudi Arabia yet. To what we can see, Saudi Arabia is not at all struggling to sell its oil. It only lowered its Official Selling Prices (OSPs) to Asia marginally for November. A surplus market + Saudi determination to sell its oil to the market would normally lead to a sharp lowering of Saudi OSPs to Asia. Not yet at least and not for November.
The 5yr contract close to fixed at $68/b. Of importance with respect to how far down oil can/will go. When the oil market moves into a surplus then the spot price starts to trade in a large discount to the 5yr contract. Typically $10-15/b below the 5yr contract on average in bear-years (2009, 2015, 2016, 2020). But the 5yr contract is usually pulled lower as well thus making this approach a moving target. But the 5yr contract price has now been rock solidly been pegged to $68/b since 2022. And in the 2022 bull-year (Brent spot average $99/b), the 5yr contract only went to $72/b on average. If we assume that the same goes for the downside and that 2026 is a bear-year then the 5yr goes to $64/b while the spot is trading at a $10-15/b discount to that. That would imply an average spot price next year of $49-54/b. But that is if OPEC doesn’t revert to cuts and instead keeps production flowing. We think OPEC(+) will trim/cut production as needed into 2026 to prevent a huge build-up in global oil stocks and a crash in prices. But for now we are still heading lower. Into the $50ies/b.


Gruvbolaget Boliden överträffade analytikernas förväntningar

Australien och USA investerar 8,5 miljarder USD för försörjningskedja av kritiska mineraler
Brent crude set to dip its feet into the high $50ies/b this week

Vad guldets uppgång egentligen betyder för världen

Spotpriset på guld över 4300 USD och silver över 54 USD

OPEC+ missar produktionsmål, stöder oljepriserna

Goldman Sachs höjer prognosen för guld, tror priset når 4900 USD

Blykalla och amerikanska Oklo inleder ett samarbete
Guld nära 4000 USD och silver 50 USD, därför kan de fortsätta stiga
Are Ukraine’s attacks on Russian energy infrastructure working?
-
 Nyheter4 veckor sedan
OPEC+ missar produktionsmål, stöder oljepriserna
-
 Nyheter2 veckor sedan
Goldman Sachs höjer prognosen för guld, tror priset når 4900 USD
-
 Nyheter3 veckor sedan
Blykalla och amerikanska Oklo inleder ett samarbete
-
 Nyheter3 veckor sedan
Guld nära 4000 USD och silver 50 USD, därför kan de fortsätta stiga
-
Analys4 veckor sedan
Are Ukraine’s attacks on Russian energy infrastructure working?
-

 Nyheter2 veckor sedan
Leading Edge Materials är på rätt plats i rätt tid
-

 Nyheter2 veckor sedan
Nytt prisrekord, guld stiger över 4000 USD
-

 Nyheter3 veckor sedan
Ett samtal om guld, olja, koppar och stål