

Analys
Shale producers ramp up production as pipes to Gulf opens


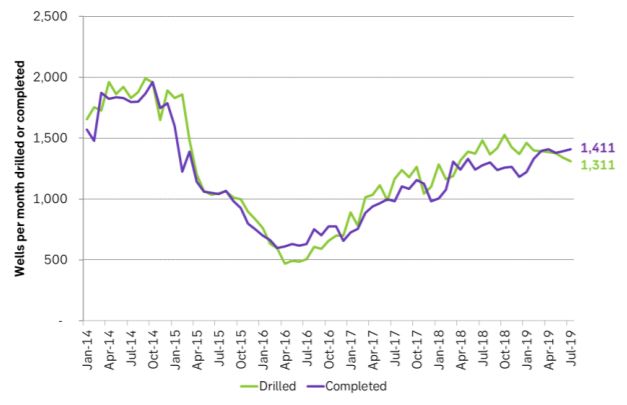
Yesterday’s report on US shale oil drilling from the EIA was mostly depressing reading for global oil producers. It showed that the completion of wells rose to 1411 wells in July (+19 MoM) and the highest nominal level since early 2015. As a result the marginal, annualized US shale oil production growth rate rose to a projected 1.0 m bl/d in September which was up from a growth rate of 0.6 m bl/d.
Shale oil producers drilled fewer wells (down 31 to 1311 wells) which is consistent with the ongoing decline in drilling rigs which have declined by 124 rigs to 764 oil rigs since November last year. With a productivity of about 1.5 drilled wells per drilling rig in operation this means that close to 200 fewer wells are being drilled today.

Instead producers are focusing on completing wells. Drilling less and completing more meant that the number of drilled but uncompleted wells declined by 100 wells to 8,108. The DUC inventory is still 2,850 wells higher than the low point in late 2016. This means that producers can continue to throw out drilling rigs while still maintaining or increasing the number of wells completed per month and thus increase production.
The hope has been that the declining drilling rig count which now has been ongoing for 9 months with investors rioting against producers losing money demanding spending discipline, positive cash flow and profits would now start to materialize into a declining rate of well completions as well. This would naturally lead to softer production growth or even production decline.
In the previous report the estimated marginal, annualized production growth rate was only 0.6 m bl/d. We estimated then that it would only take a reduction in monthly well completions of 109 wells in order to drive US shale oil production to zero growth. I.e. it would not take much to drive growth to zero. Well completions per month would only have to decline from 1383 in June to 1274 and voila US shale oil production growth would have halted to zero. That did not happen. Instead the well completion rose to 1411 in July thus driving estimated the marginal, annualized production growth rate to 1.0 m bl/d in September.
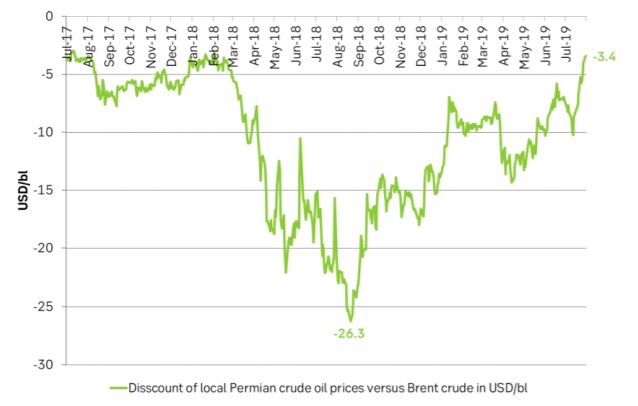
Last year we witnessed that the local, Permian (Midland) crude oil price traded at a discount of as much as $26/bl below the Brent crude oil price as production was locked in both Permian and Cushing. So far this year the discount has mostly been varying between -$15/bl and -$5/bl. The writing on the wall for Permian shale oil producers has been that if they accelerated completions and production they would just kill the local price and the marginal value of production.
Now however transportation capacity out of the Permian is rapidly opening up to the US Gulf. The Cactus II (670 k bl/d) from the Permian to Corpus Christi (US Gulf) opened in early August and much more is coming later this year and early next year. As a result the local Permian crude oil price is now only -$3.4/bl below the Brent crude oil price. And even more important is that Permian producers now know that they can ramp up well completions and production without killing the local crude oil price.
Permian producers are moving from an obvious price setter position locally in the Permian to a perceived global oil price taker. Though in fact they will in the end also be the price setter in the global market place if they just ramp up well completions and production.
Our fear as well as OPEC’s fear and global oil producers fear is that Permian shale oil producers now will focus intensely on well completions. They have 3,999 drilled but uncompleted wells to draw down and they can now accelerate production without the risk of killing the local oil price. Well completions are after all equal to production and production is money in the pocket while drilling in itself is only spending.
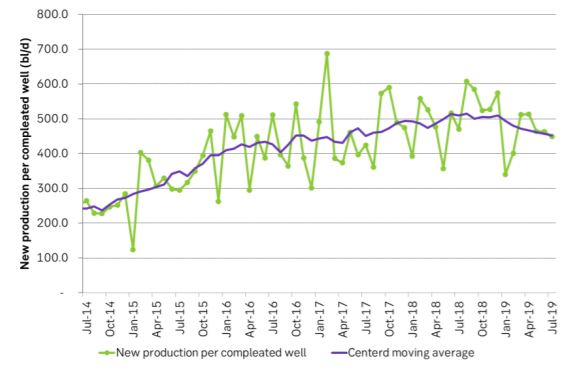
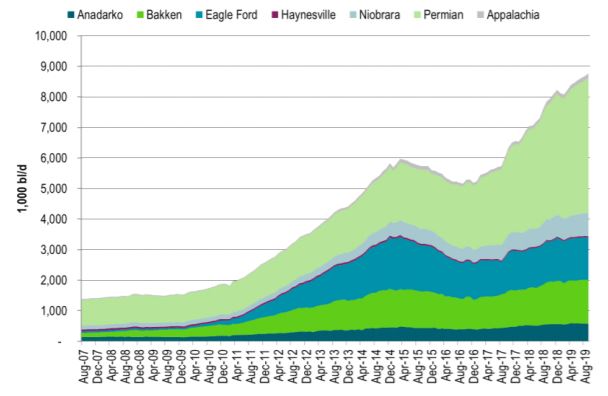
There were a few positive elements in yesterday’s numbers seen from the eyes of global oil producers. Increased well completion was basically a Permian thing with completions on average declining elsewhere. Productivity of new wells continued to decline. This is counter to the headline productivity numbers from the US EIA. EIA is calculating drilling rig productivity and not well productivity. In addition they are not adjusting for a build or a draw in the DUC inventory. When the number of DUCs is increasing they under estimate drilling productivity and when the number of DUCs is declining they over estimate drilling productivity. They do not specify well productivity though which is declining in our numbers.
Ch1: The local Permian crude oil price discount to Brent crude has rapidly evaporated as the Cactus II from Permian to Corpus Christi has opened up. Now Permian producers can ramp up well completions without the risk of killing the local oil price.
Ch2: Drilling continued to decline but well completions rose to the highest nominal rate since early 2015. When drilling has declined long enough it is clear that well completions will have to decline as well. With a large DUC inventory we do however seem to be far from that point in time yet. The US DUC inventory stood at 8,108 in July, up 2,850 since late 2016.
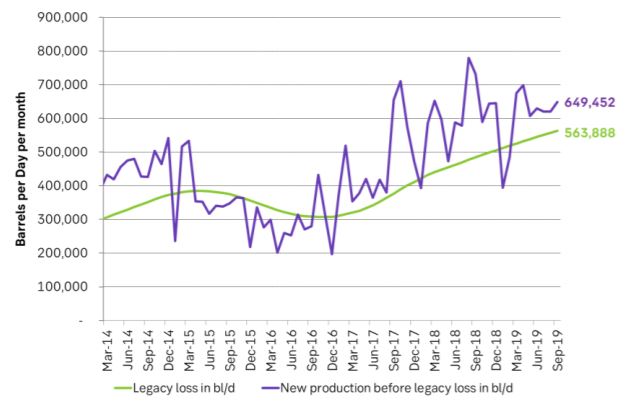
Ch3: This is driving estimated new production in September up and away from losses in existing production. Thus marginal annualized production growth accelerated to 1.0 m bl/d in September.
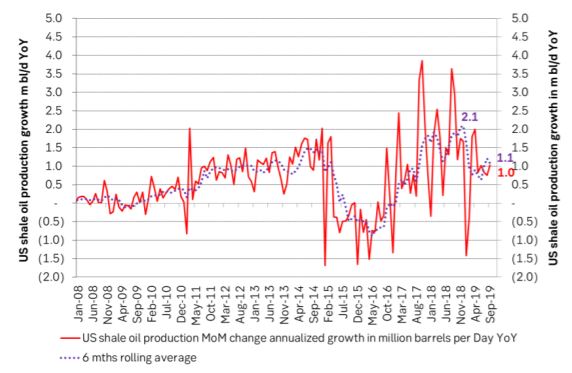
Ch4: Marginal, annualized shale oil production growth rose to an estimated 1.0 m bl/d per year. Clearly down from the extremely strong production growth last year of up to 2 m bl/d growth rate. But still up versus last months report of a rate of 0.6 m bl/d per year with hopes then that the rate would decline further.
Ch5: Overall well productivity continued to deteriorate with latest 7 data points all below the average of the previous 7 points. This could be a function of the DUC inventory draw down. When the inventory rose producers took every 10th well and put it into the DUC inventory. It is logical that producers threw the 10% least promissing wells into the DUC inventory. This then led to an overestimation of the well productivity. Now that the DUC inventory is drawing down producers will have a 20% share of less performing wells. Thus further DUC inventory draw should lead to further overall well productivity.
Ch6: US shale oil production growth has slowed. Could it accelerate again now that pipes out of the Permian are opening up?
The latest weekly report from the US DOE showed a substantial drawdown across key petroleum categories, adding more upside potential to the fundamental picture.

Commercial crude inventories (excl. SPR) fell by 5.8 million barrels, bringing total inventories down to 415.1 million barrels. Now sitting 11% below the five-year seasonal norm and placed in the lowest 2015-2022 range (see picture below).
Product inventories also tightened further last week. Gasoline inventories declined by 2.1 million barrels, with reductions seen in both finished gasoline and blending components. Current gasoline levels are about 3% below the five-year average for this time of year.
Among products, the most notable move came in diesel, where inventories dropped by almost 4.1 million barrels, deepening the deficit to around 20% below seasonal norms – continuing to underscore the persistent supply tightness in diesel markets.
The only area of inventory growth was in propane/propylene, which posted a significant 5.1-million-barrel build and now stands 9% above the five-year average.
Total commercial petroleum inventories (crude plus refined products) declined by 4.2 million barrels on the week, reinforcing the overall tightening of US crude and products.


A classic case of “buy the rumor, sell the news” played out in oil markets, as Brent crude has dropped sharply – down nearly USD 10 per barrel since yesterday evening – following Iran’s retaliatory strike on a U.S. air base in Qatar. The immediate reaction was: “That was it?” The strike followed a carefully calibrated, non-escalatory playbook, avoiding direct threats to energy infrastructure or disruption of shipping through the Strait of Hormuz – thus calming worst-case fears.
After Monday morning’s sharp spike to USD 81.4 per barrel, triggered by the U.S. bombing of Iranian nuclear facilities, oil prices drifted sideways in anticipation of a potential Iranian response. That response came with advance warning and caused limited physical damage. Early this morning, both the U.S. President and Iranian state media announced a ceasefire, effectively placing a lid on the immediate conflict risk – at least for now.
As a result, Brent crude has now fallen by a total of USD 12 from Monday’s peak, currently trading around USD 69 per barrel.
Looking beyond geopolitics, the market will now shift its focus to the upcoming OPEC+ meeting in early July. Saudi Arabia’s decision to increase output earlier this year – despite falling prices – has drawn renewed attention considering recent developments. Some suggest this was a response to U.S. pressure to offset potential Iranian supply losses.
However, consensus is that the move was driven more by internal OPEC+ dynamics. After years of curbing production to support prices, Riyadh had grown frustrated with quota-busting by several members (notably Kazakhstan). With Saudi Arabia cutting up to 2 million barrels per day – roughly 2% of global supply – returns were diminishing, and the risk of losing market share was rising. The production increase is widely seen as an effort to reassert leadership and restore discipline within the group.
That said, the FT recently stated that, the Saudis remain wary of past missteps. In 2018, Riyadh ramped up output at Trump’s request ahead of Iran sanctions, only to see prices collapse when the U.S. granted broad waivers – triggering oversupply. Officials have reportedly made it clear they don’t intend to repeat that mistake.
The recent visit by President Trump to Saudi Arabia, which included agreements on AI, defense, and nuclear cooperation, suggests a broader strategic alignment. This has fueled speculation about a quiet “pump-for-politics” deal behind recent production moves.
Looking ahead, oil prices have now retraced the entire rally sparked by the June 13 Israel–Iran escalation. This retreat provides more political and policy space for both the U.S. and Saudi Arabia. Specifically, it makes it easier for Riyadh to scale back its three recent production hikes of 411,000 barrels each, potentially returning to more moderate increases of 137,000 barrels for August and September.
In short: with no major loss of Iranian supply to the market, OPEC+ – led by Saudi Arabia – no longer needs to compensate for a disruption that hasn’t materialized, especially not to please the U.S. at the cost of its own market strategy. As the Saudis themselves have signaled, they are unlikely to repeat previous mistakes.
Conclusion: With Brent now in the high USD 60s, buying oil looks fundamentally justified. The geopolitical premium has deflated, but tensions between Israel and Iran remain unresolved – and the risk of missteps and renewed escalation still lingers. In fact, even this morning, reports have emerged of renewed missile fire despite the declared “truce.” The path forward may be calmer – but it is far from stable.
Analys
A muted price reaction. Market looks relaxed, but it is still on edge waiting for what Iran will do
Brent crossed the 80-line this morning but quickly fell back assigning limited probability for Iran choosing to close the Strait of Hormuz. Brent traded in a range of USD 70.56 – 79.04/b last week as the market fluctuated between ”Iran wants a deal” and ”US is about to attack Iran”. At the end of the week though, Donald Trump managed to convince markets (and probably also Iran) that he would make a decision within two weeks. I.e. no imminent attack. Previously when when he has talked about ”making a decision within two weeks” he has often ended up doing nothing in the end. The oil market relaxed as a result and the week ended at USD 77.01/b which is just USD 6/b above the year to date average of USD 71/b.

Brent jumped to USD 81.4/b this morning, the highest since mid-January, but then quickly fell back to a current price of USD 78.2/b which is only up 1.5% versus the close on Friday. As such the market is pricing a fairly low probability that Iran will actually close the Strait of Hormuz. Probably because it will hurt Iranian oil exports as well as the global oil market.
It was however all smoke and mirrors. Deception. The US attacked Iran on Saturday. The attack involved 125 warplanes, submarines and surface warships and 14 bunker buster bombs were dropped on Iranian nuclear sites including Fordow, Natanz and Isfahan. In response the Iranian Parliament voted in support of closing the Strait of Hormuz where some 17 mb of crude and products is transported to the global market every day plus significant volumes of LNG. This is however merely an advise to the Supreme leader Ayatollah Ali Khamenei and the Supreme National Security Council which sits with the final and actual decision.
No supply of oil is lost yet. It is about the risk of Iran closing the Strait of Hormuz or not. So far not a single drop of oil supply has been lost to the global market. The price at the moment is all about the assessed risk of loss of supply. Will Iran choose to choke of the Strait of Hormuz or not? That is the big question. It would be painful for US consumers, for Donald Trump’s voter base, for the global economy but also for Iran and its population which relies on oil exports and income from selling oil out of that Strait as well. As such it is not a no-brainer choice for Iran to close the Strait for oil exports. And looking at the il price this morning it is clear that the oil market doesn’t assign a very high probability of it happening. It is however probably well within the capability of Iran to close the Strait off with rockets, mines, air-drones and possibly sea-drones. Just look at how Ukraine has been able to control and damage the Russian Black Sea fleet.
What to do about the highly enriched uranium which has gone missing? While the US and Israel can celebrate their destruction of Iranian nuclear facilities they are also scratching their heads over what to do with the lost Iranian nuclear material. Iran had 408 kg of highly enriched uranium (IAEA). Almost weapons grade. Enough for some 10 nuclear warheads. It seems to have been transported out of Fordow before the attack this weekend.
The market is still on edge. USD 80-something/b seems sensible while we wait. The oil market reaction to this weekend’s events is very muted so far. The market is still on edge awaiting what Iran will do. Because Iran will do something. But what and when? An oil price of 80-something seems like a sensible level until something do happen.


Eurobattery Minerals förvärvar majoritet i spansk volframgruva

USA ska införa 50 procent tull på koppar

Ryska staten siktar på att konfiskera en av landets största guldproducenter

Hur säkrar vi Sveriges tillgång till kritiska metaller och mineral i en ny geopolitisk verklighet?

Lundin Mining ska bli en av de tio största kopparproducenterna i världen

Mahvie Minerals växlar spår – satsar fullt ut på guld

Uppgången i oljepriset planade ut under helgen

Låga elpriser i sommar – men mellersta Sverige får en ökning
A muted price reaction. Market looks relaxed, but it is still on edge waiting for what Iran will do

Jonas Lindvall är tillbaka med ett nytt oljebolag, Perthro, som ska börsnoteras
-
 Nyheter3 veckor sedan
Mahvie Minerals växlar spår – satsar fullt ut på guld
-
 Nyheter4 veckor sedan
Uppgången i oljepriset planade ut under helgen
-
 Nyheter4 veckor sedan
Låga elpriser i sommar – men mellersta Sverige får en ökning
-
Analys3 veckor sedan
A muted price reaction. Market looks relaxed, but it is still on edge waiting for what Iran will do
-
 Nyheter3 veckor sedan
Jonas Lindvall är tillbaka med ett nytt oljebolag, Perthro, som ska börsnoteras
-

 Nyheter3 veckor sedan
Oljan, guldet och marknadens oroande tystnad
-
Analys4 veckor sedan
Very relaxed at USD 75/b. Risk barometer will likely fluctuate to higher levels with Brent into the 80ies or higher coming 2-3 weeks
-

 Nyheter3 veckor sedan
Domstolen ger klartecken till Lappland Guldprospektering