

Analys
Shale producers ramp up production as pipes to Gulf opens


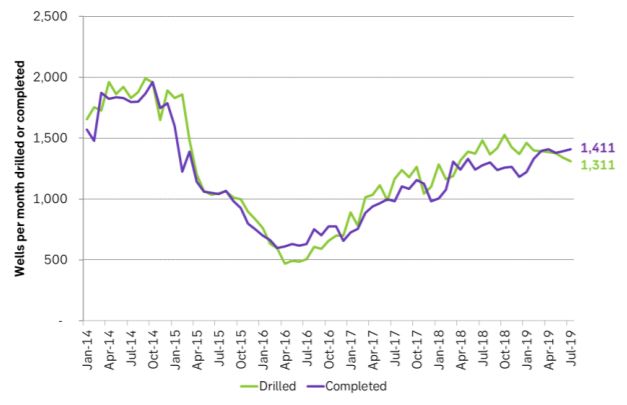
Yesterday’s report on US shale oil drilling from the EIA was mostly depressing reading for global oil producers. It showed that the completion of wells rose to 1411 wells in July (+19 MoM) and the highest nominal level since early 2015. As a result the marginal, annualized US shale oil production growth rate rose to a projected 1.0 m bl/d in September which was up from a growth rate of 0.6 m bl/d.
Shale oil producers drilled fewer wells (down 31 to 1311 wells) which is consistent with the ongoing decline in drilling rigs which have declined by 124 rigs to 764 oil rigs since November last year. With a productivity of about 1.5 drilled wells per drilling rig in operation this means that close to 200 fewer wells are being drilled today.

Instead producers are focusing on completing wells. Drilling less and completing more meant that the number of drilled but uncompleted wells declined by 100 wells to 8,108. The DUC inventory is still 2,850 wells higher than the low point in late 2016. This means that producers can continue to throw out drilling rigs while still maintaining or increasing the number of wells completed per month and thus increase production.
The hope has been that the declining drilling rig count which now has been ongoing for 9 months with investors rioting against producers losing money demanding spending discipline, positive cash flow and profits would now start to materialize into a declining rate of well completions as well. This would naturally lead to softer production growth or even production decline.
In the previous report the estimated marginal, annualized production growth rate was only 0.6 m bl/d. We estimated then that it would only take a reduction in monthly well completions of 109 wells in order to drive US shale oil production to zero growth. I.e. it would not take much to drive growth to zero. Well completions per month would only have to decline from 1383 in June to 1274 and voila US shale oil production growth would have halted to zero. That did not happen. Instead the well completion rose to 1411 in July thus driving estimated the marginal, annualized production growth rate to 1.0 m bl/d in September.
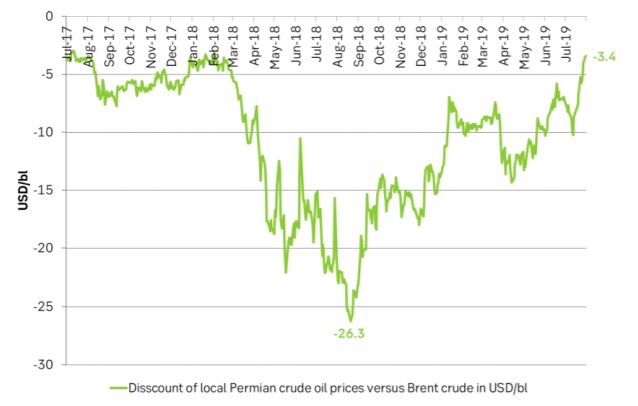
Last year we witnessed that the local, Permian (Midland) crude oil price traded at a discount of as much as $26/bl below the Brent crude oil price as production was locked in both Permian and Cushing. So far this year the discount has mostly been varying between -$15/bl and -$5/bl. The writing on the wall for Permian shale oil producers has been that if they accelerated completions and production they would just kill the local price and the marginal value of production.
Now however transportation capacity out of the Permian is rapidly opening up to the US Gulf. The Cactus II (670 k bl/d) from the Permian to Corpus Christi (US Gulf) opened in early August and much more is coming later this year and early next year. As a result the local Permian crude oil price is now only -$3.4/bl below the Brent crude oil price. And even more important is that Permian producers now know that they can ramp up well completions and production without killing the local crude oil price.
Permian producers are moving from an obvious price setter position locally in the Permian to a perceived global oil price taker. Though in fact they will in the end also be the price setter in the global market place if they just ramp up well completions and production.
Our fear as well as OPEC’s fear and global oil producers fear is that Permian shale oil producers now will focus intensely on well completions. They have 3,999 drilled but uncompleted wells to draw down and they can now accelerate production without the risk of killing the local oil price. Well completions are after all equal to production and production is money in the pocket while drilling in itself is only spending.
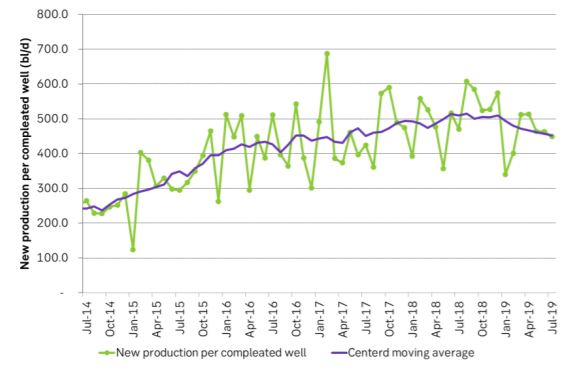
There were a few positive elements in yesterday’s numbers seen from the eyes of global oil producers. Increased well completion was basically a Permian thing with completions on average declining elsewhere. Productivity of new wells continued to decline. This is counter to the headline productivity numbers from the US EIA. EIA is calculating drilling rig productivity and not well productivity. In addition they are not adjusting for a build or a draw in the DUC inventory. When the number of DUCs is increasing they under estimate drilling productivity and when the number of DUCs is declining they over estimate drilling productivity. They do not specify well productivity though which is declining in our numbers.
Ch1: The local Permian crude oil price discount to Brent crude has rapidly evaporated as the Cactus II from Permian to Corpus Christi has opened up. Now Permian producers can ramp up well completions without the risk of killing the local oil price.
Ch2: Drilling continued to decline but well completions rose to the highest nominal rate since early 2015. When drilling has declined long enough it is clear that well completions will have to decline as well. With a large DUC inventory we do however seem to be far from that point in time yet. The US DUC inventory stood at 8,108 in July, up 2,850 since late 2016.
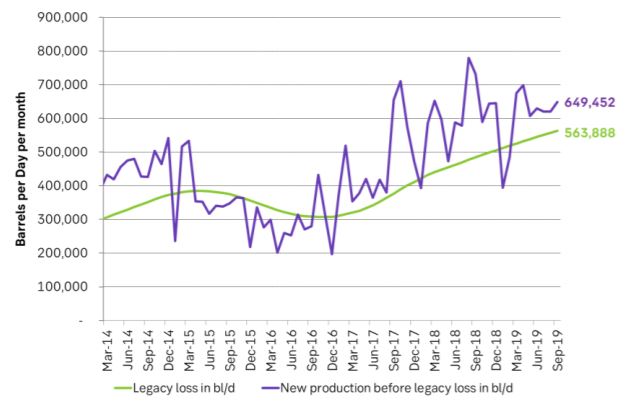
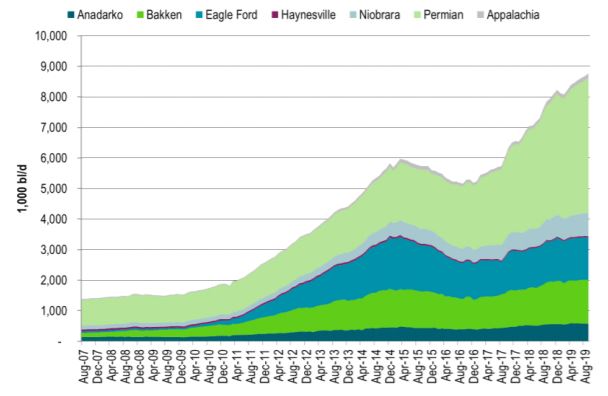
Ch3: This is driving estimated new production in September up and away from losses in existing production. Thus marginal annualized production growth accelerated to 1.0 m bl/d in September.
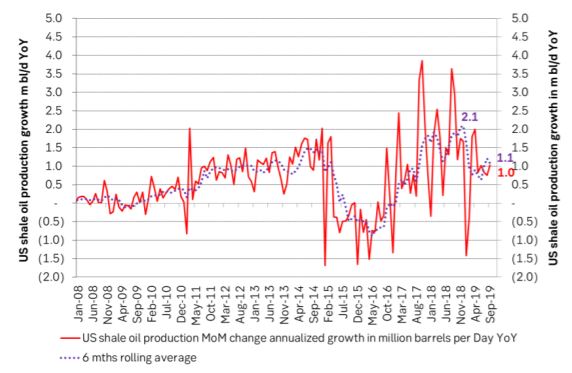
Ch4: Marginal, annualized shale oil production growth rose to an estimated 1.0 m bl/d per year. Clearly down from the extremely strong production growth last year of up to 2 m bl/d growth rate. But still up versus last months report of a rate of 0.6 m bl/d per year with hopes then that the rate would decline further.
Ch5: Overall well productivity continued to deteriorate with latest 7 data points all below the average of the previous 7 points. This could be a function of the DUC inventory draw down. When the inventory rose producers took every 10th well and put it into the DUC inventory. It is logical that producers threw the 10% least promissing wells into the DUC inventory. This then led to an overestimation of the well productivity. Now that the DUC inventory is drawing down producers will have a 20% share of less performing wells. Thus further DUC inventory draw should lead to further overall well productivity.
Ch6: US shale oil production growth has slowed. Could it accelerate again now that pipes out of the Permian are opening up?
Brent crude has climbed roughly USD 1.5-2 per barrel since Friday, yet falling USD 0.3 per barrel this mornig and currently trading near USD 67.25/bbl after yesterday’s climb. While the rally reflects short-term geopolitical tension, price action has been choppy, and crude remains locked in a broader range – caught between supply-side pressure and spot resilience.

Prices have been supported by renewed Ukrainian drone strikes targeting Russian infrastructure. Over the weekend, falling debris triggered a fire at the 20mtpa Kirishi refinery, following last week’s attack on the key Primorsk terminal.
Argus estimates that these attacks have halted ish 300 kbl/d of Russian refining capacity in August and September. While the market impact is limited for now, the action signals Kyiv’s growing willingness to disrupt oil flows – supporting a soft geopolitical floor under prices.
The political environment is shifting: the EU is reportedly considering sanctions on Indian and Chinese firms facilitating Russian crude flows, while the U.S. has so far held back – despite Bessent warning that any action from Washington depends on broader European participation. Senator Graham has also publicly criticized NATO members like Slovakia and Hungary for continuing Russian oil imports.
It’s worth noting that China and India remain the two largest buyers of Russian barrels since the invasion of Ukraine. While New Delhi has been hit with 50% secondary tariffs, Beijing has been spared so far.
Still, the broader supply/demand balance leans bearish. Futures markets reflect this: Brent’s prompt spread (gauge of near-term tightness) has narrowed to the current USD 0.42/bl, down from USD 0.96/bl two months ago, pointing to weakening backwardation.
This aligns with expectations for a record surplus in 2026, largely driven by the faster-than-anticipated return of OPEC+ barrels to market. OPEC+ is gathering in Vienna this week to begin revising member production capacity estimates – setting the stage for new output baselines from 2027. The group aims to agree on how to define “maximum sustainable capacity,” with a proposal expected by year-end.
While the IEA pegs OPEC+ capacity at 47.9 million barrels per day, actual output in August was only 42.4 million barrels per day. Disagreements over data and quota fairness (especially from Iraq and Nigeria) have already delayed this process. Angola even quit the group last year after being assigned a lower target than expected. It also remains unclear whether Russia and Iraq can regain earlier output levels due to infrastructure constraints.
Also, macro remains another key driver this week. A 25bp Fed rate cut is widely expected tomorrow (Wednesday), and commodities in general could benefit a potential cut.
Summing up: Brent crude continues to drift sideways, finding near-term support from geopolitics and refining strength. But with surplus building and market structure softening, the upside may remain capped.
Brent crude is essentially flat on the week, but after a volatile ride. Prices started Monday near USD 65.5/bl, climbed steadily to a mid-week high of USD 67.8/bl on Wednesday evening, before falling sharply – losing about USD 2/bl during Thursday’s session.
Brent is currently trading around USD 65.8/bl, right back where it began. The volatility reflects the market’s ongoing struggle to balance growing surplus risks against persistent geopolitical uncertainty and resilient refined product margins. Thursday’s slide snapped a three-day rally and came largely in response to a string of bearish signals, most notably from the IEA’s updated short-term outlook.
The IEA now projects record global oversupply in 2026, reinforcing concerns flagged earlier by the U.S. EIA, which already sees inventories building this quarter. The forecast comes just days after OPEC+ confirmed it will continue returning idle barrels to the market in October – albeit at a slower pace of +137,000 bl/d. While modest, the move underscores a steady push to reclaim market share and adds to supply-side pressure into year-end.
Thursday’s price drop also followed geopolitical incidences: Israeli airstrikes reportedly targeted Hamas leadership in Doha, while Russian drones crossed into Polish airspace – events that initially sent crude higher as traders covered short positions.
Yet, sentiment remains broadly cautious. Strong refining margins and low inventories at key pricing hubs like Europe continue to support the downside. Chinese stockpiling of discounted Russian barrels and tightness in refined product markets – especially diesel – are also lending support.
On the demand side, the IEA revised up its 2025 global demand growth forecast by 60,000 bl/d to 740,000 bl/d YoY, while leaving 2026 unchanged at 698,000 bl/d. Interestingly, the agency also signaled that its next long-term report could show global oil demand rising through 2050.
Meanwhile, OPEC offered a contrasting view in its latest Monthly Oil Market Report, maintaining expectations for a supply deficit both this year and next, even as its members raise output. The group kept its demand growth estimates for 2025 and 2026 unchanged at 1.29 million bl/d and 1.38 million bl/d, respectively.
We continue to watch whether the bearish supply outlook will outweigh geopolitical risk, and if Brent can continue to find support above USD 65/bl – a level increasingly seen as a soft floor for OPEC+ policy.
Brent crude makes some gains as Israel’s attack on Hamas in Qatar rattles markets. Brent crude spiked to a high of USD 67.38/b yesterday as Israel made a strike on Hamas in Qatar. But it wasn’t able to hold on to that level and only closed up 0.6% in the end at USD 66.39/b. This morning it is starting on the up with a gain of 0.9% at USD 67/b. Still rattled by Israel’s attack on Hamas in Qatar yesterday. Brent is getting some help on the margin this morning with Asian equities higher and copper gaining half a percent. But the dark cloud of surplus ahead is nonetheless hanging over the market with Brent trading two dollar lower than last Tuesday.

Geopolitical risk premiums in oil rarely lasts long unless actual supply disruption kicks in. While Israel’s attack on Hamas in Qatar is shocking, the geopolitical risk lifting crude oil yesterday and this morning is unlikely to last very long as such geopolitical risk premiums usually do not last long unless real disruption kicks in.
US API data yesterday indicated a US crude and product stock build last week of 3.1 mb. The US API last evening released partial US oil inventory data indicating that US crude stocks rose 1.3 mb and middle distillates rose 1.5 mb while gasoline rose 0.3 mb. In total a bit more than 3 mb increase. US crude and product stocks usually rise around 1 mb per week this time of year. So US commercial crude and product stock rose 2 mb over the past week adjusted for the seasonal norm. Official and complete data are due today at 16:30.
A 2 mb/week seasonally adj. US stock build implies a 1 – 1.4 mb/d global surplus if it is persistent. Assume that if the global oil market is running a surplus then some 20% to 30% of that surplus ends up in US commercial inventories. A 2 mb seasonally adjusted inventory build equals 286 kb/d. Divide by 0.2 to 0.3 and we get an implied global surplus of 950 kb/d to 1430 kb/d. A 2 mb/week seasonally adjusted build in US oil inventories is close to noise unless it is a persistent pattern every week.
US IEA STEO oil report: Robust surplus ahead and Brent averaging USD 51/b in 2026. The US EIA yesterday released its monthly STEO oil report. It projected a large and persistent surplus ahead. It estimates a global surplus of 2.2 m/d from September to December this year. A 2.4 mb/d surplus in Q1-26 and an average surplus for 2026 of 1.6 mb/d resulting in an average Brent crude oil price of USD 51/b next year. And that includes an assumption where OPEC crude oil production only averages 27.8 mb/d in 2026 versus 27.0 mb/d in 2024 and 28.6 mb/d in August.
Brent will feel the bear-pressure once US/OECD stocks starts visible build. In the meanwhile the oil market sits waiting for this projected surplus to materialize in US and OECD inventories. Once they visibly starts to build on a consistent basis, then Brent crude will likely quickly lose altitude. And unless some unforeseen supply disruption kicks in, it is bound to happen.
US IEA STEO September report. In total not much different than it was in January

US IEA STEO September report. US crude oil production contracting in 2026, but NGLs still growing. Close to zero net liquids growth in total.


Tyskland har så höga elpriser att företag inte har råd att använda elektricitet
Brent crude ticks higher on tension, but market structure stays soft

Kinas elproduktion slog nytt rekord i augusti, vilket även kolkraft gjorde

Det stigande guldpriset en utmaning för smyckesköpare

Aktier i guldbolag laggar priset på guld

Meta bygger ett AI-datacenter på 5 GW och 2,25 GW gaskraftverk
Aker BP gör ett av Norges största oljefynd på ett decennium, stärker resurserna i Yggdrasilområdet
Sommarens torka kan ge högre elpriser i höst
Brent edges higher as India–Russia oil trade draws U.S. ire and Powell takes the stage at Jackson Hole

Mahvie Minerals är verksamt i guldrikt område i Finland
-
 Nyheter4 veckor sedan
Meta bygger ett AI-datacenter på 5 GW och 2,25 GW gaskraftverk
-
 Nyheter4 veckor sedan
Aker BP gör ett av Norges största oljefynd på ett decennium, stärker resurserna i Yggdrasilområdet
-
 Nyheter4 veckor sedan
Sommarens torka kan ge högre elpriser i höst
-
Analys4 veckor sedan
Brent edges higher as India–Russia oil trade draws U.S. ire and Powell takes the stage at Jackson Hole
-
 Nyheter3 veckor sedan
Mahvie Minerals är verksamt i guldrikt område i Finland
-
Analys3 veckor sedan
Increasing risk that OPEC+ will unwind the last 1.65 mb/d of cuts when they meet on 7 September
-

 Nyheter3 veckor sedan
Neil Atkinson spår att priset på olja kommer att stiga till 70 USD
-
Analys2 veckor sedan
OPEC+ in a process of retaking market share