Analys
SEB – Råvarukommentarer vecka 34 2012
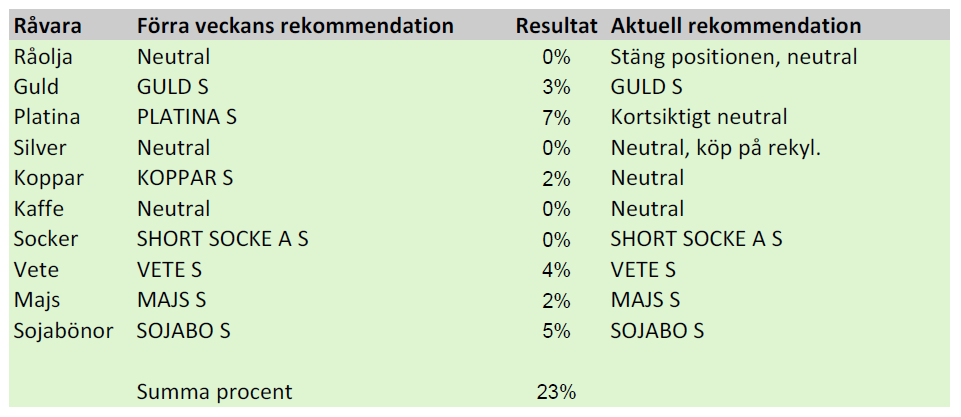
Sammanfattning av rekommendationer
Råolja – Brent
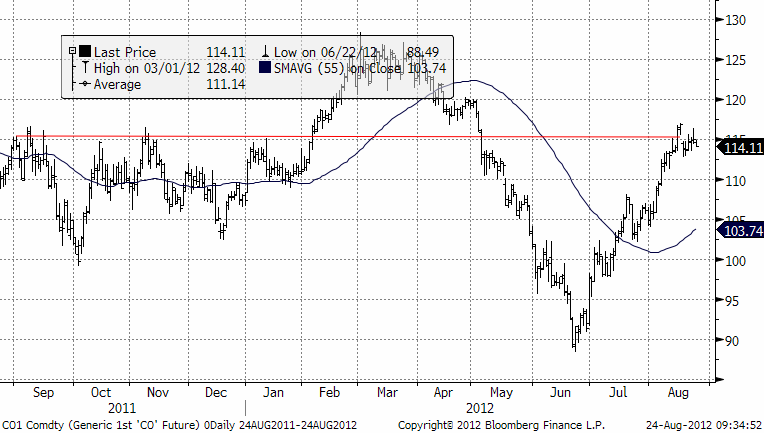
Oljan närmar sig slutet av den här uppgångsfasen. Det är en ”tight” balans mellan tillgång och efterfrågan på råolja i Atlanten. Detta återspeglas i ”backwardation” i terminskurvan. Nedan ser vi kursdiagrammet på spotkontraktet på Brent på ICE.
SEB:s teknisk analys tyder på en sidledes utveckling, så vi fortsätter att vara neutrala på kort sikt.
Guld
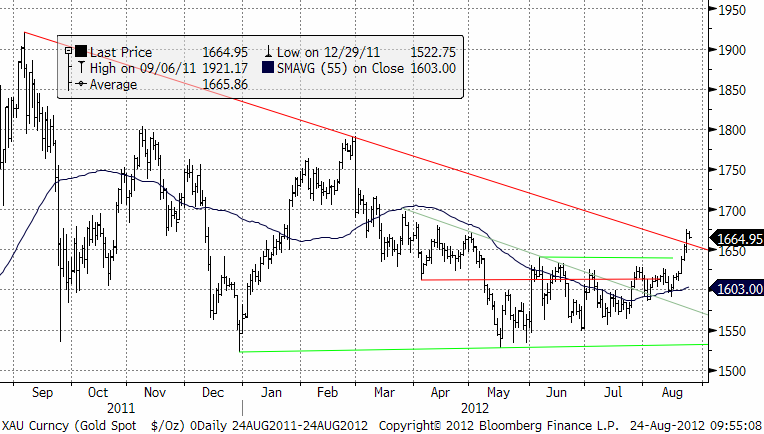
Vår favorit bland ädelmetallerna, platina har utvecklat sig väl. De som följt vårt råd borde vara glada därför att PLATINA S har gått upp med drygt 7% sedan förra veckobrevet. Det börjar pratas om ett nytt QE3. I FOMC-protokollet sägs detta rätt så tydligt. Så här skrev man: MORE STIMULUS SHOULD BE LAUNCHED IF A ”SUBSTANTIAL AND SUSTAINABLE” IMPROVEMENT IN THE RECOVERY IS NOT SEEN ”FAIRLY SOON”. Det talar för ädelmetaller. Vi tycker att man ska äga PLATINA S, GULD S och SILVER S. Möjligen kan man ta hem vinster på PLATINA S nu och byta till GULD S. Vi ser i diagrammet nedan, att guldpriset i dollar har brutit motståndslinjen, vilket är en teknisk köpsignal.
Platina
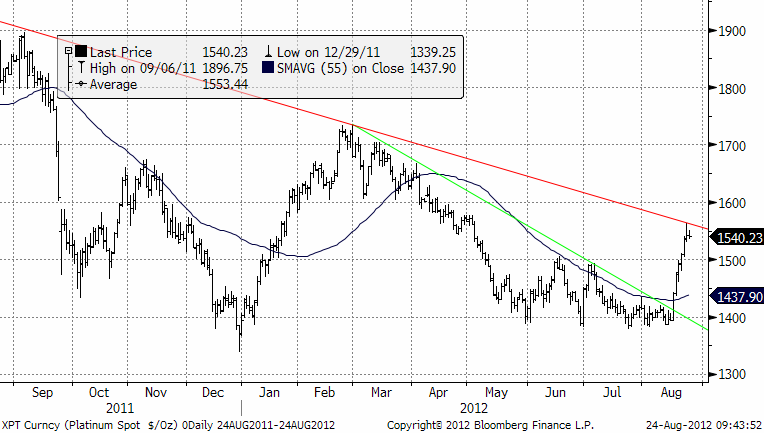
Sedan oroligheterna vid Lonmin’s Marikana-gruva i Sydafrika eskalerade i förra veckan har priset stiga ca 10 %., från ca $1400/oz till dagens notering på $1547. Lonmin har finansiella problem vilket förvärrar situationen. Företaget producerar 750 000 oz, ca 16 % av Sydafrikas totala utbud som i sin tur utgör hela 75 % av det globala utbudet (ca 6,4 Milj oz). Risken finns att konflikten sprider sig till andra gruvor i landet. Den senaste strejken vid Impalas gruvor i januari varade i 6 veckor och orsakades av samma orsaker, vilket inkluderar en maktkamp mellan olika fackföreningar. För att ytterligare störa situationen gav Sydafrikas president, Jacob Zuma, gruvarbetarna sitt stöd. Han hotade med att ta Lonmins gruvlicens om bolaget inte gav gruvarbetarna 40% mer i lön, som är vad de kräver. Lonmin tjänar inga pengar, utan redovisade en förlust det första halvåret i år. Det är alltså en ohållbar situation och det torde innebära att priset på platina, allt annat lika, kommer att gå upp. Förutom utbudsrisken får Platina stöd i sig egenskap av ädelmetall, och hänger på guldprisets uppåt (där förhoppningar om ett amerikanskt stimulanspaket är huvudförklaringen). Platina klassas som ädelmetall, men sett till konsumtionen är den en industrimetall. Bilindustrin är den största konsumenten där metallen är en viktig beståndsdel i katalysatorer, vars tillverkning står för ca 35 % av den totala efterfrågan. Med vår syn på basmetaller och guld kombinerat talar det mesta för en fortsatt stark prisbild på sikt. Kortsiktigt finns dock risk för rekyl då uppgången gått lite väl fort i samband med oroligheterna i Sydafrika.
Mot bakgrund av den senaste veckans kraftiga prisuppgång på platina och att vi har en uppgång på 7% i PLATINA S, gör att vi väljer att kliva av här. Notera också att priset i diagrammet ovan gått upp precis till motståndslinjen. Skulle den brytas gå vi omedelbart in igen!
Silver
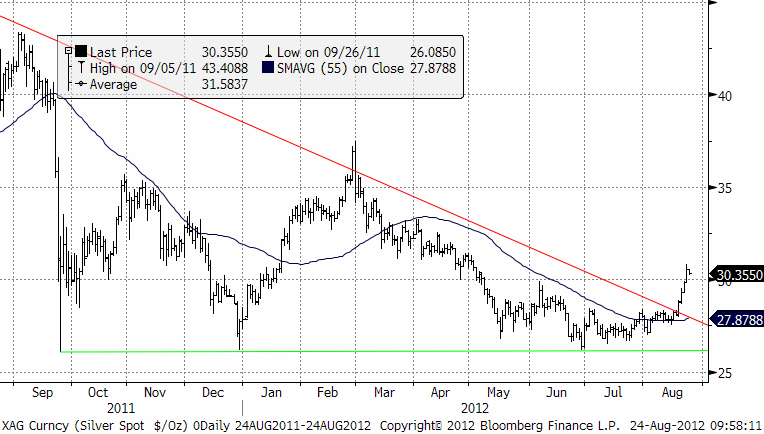
Silver har levererat på den tekniska bilden, på ett nästan skolboksmässigt sätt. Priset har gått upp hastigt och det vore inte förvånande om det kom en kortsiktig rekyl, som då är ett köptillfälle, ett tillfälle att köpa SILVER S.
Koppar
Efter en i övrigt ganska nyhetsfattig vecka blev den stora höjdpunkten onsdagskvällens FEDs protokoll. Marknaden gillade att ett tillräckligt stort antal ledamöter var positiva till ett nytt stimulanspaket. Riskhattarna åkte på. Basmetaller hade redan börjat vända upp i början av veckan. Prisuppgången i veckan ligger mellan 2 och 4 % för de största metallerna. Nickel utmärker sig (som varit den svagaste den senaste tiden) med en uppgång på 4,5 % sen öppningen i måndags. En viktig nyhet under veckan var att BHP meddelade att de lägger tre sedan tidigare planerade projekt på is med ett värde av 68 Mdr dollar.
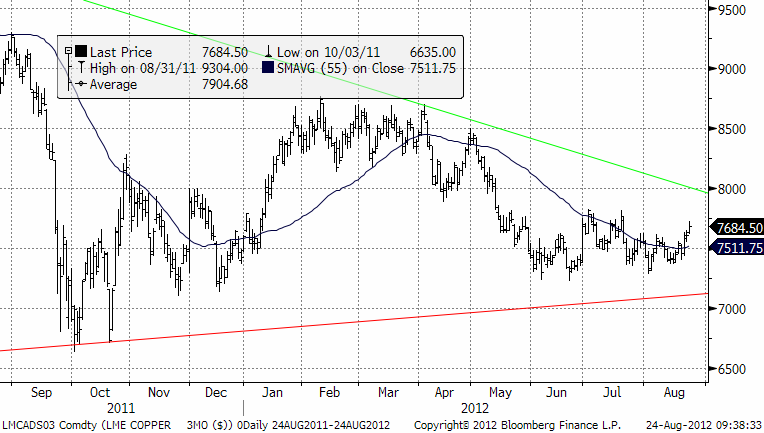
Man anger låga råvarupriser som huvudsakligt skäl. En förklaring till den svaga tendensen under sommaren har just varit oron för ett ökat utbud. Vi utryckte vår bedömning förra veckan att priserna ligger i startgroparna inför det säsongsmässigt starkare fjärde kvartalet. Frågan är om det vi nu ser är en tjuvstart? Det mesta talar för en början till vändning, men risken är stor att priserna (vid någon besvikelse över någon makrodata) faller tillbaka igen. Tekniskt sett har trenderna definitivt vänt från neråtgående till mer sidledes. Det behövs mer tid för kraftansamling. Koppar visade vid sidan av nickel störst styrka under veckan. Det är för tidigt att tala om en vändning uppåt. Tekniska analytiker bevakar 100dagarssnittet som kommer in på $7724. Dagens högsta nivå är 7720 ! Marknaden står och väger och frågan är om den har kraft nog att bryta uppåt i nuläget. Oron kvarstår för Kina. Helgens nyhet att fastighetspriserna steg i 49 av 70 större städer som regeringen följer i juli jämfört med juni, minskar sannolikheten för ett snart stimulanspaket i Kina. Det finns således anledning att vila lite på hanen. För den tradingbenägne kan det dock erbjudas intressanta möjligheter i intervallet: 7300-7400 på nedsidan och 7600-7700 på uppsidan.
Vi rekommenderade förra veckan ett köp av KOPPAR S, som sedan dess stigit med 2%. Vi tror att det är lite för tidigt att gå in för lite längre sikt, så vi kliver ur den positionen och har en neutral vy.
Kaffe
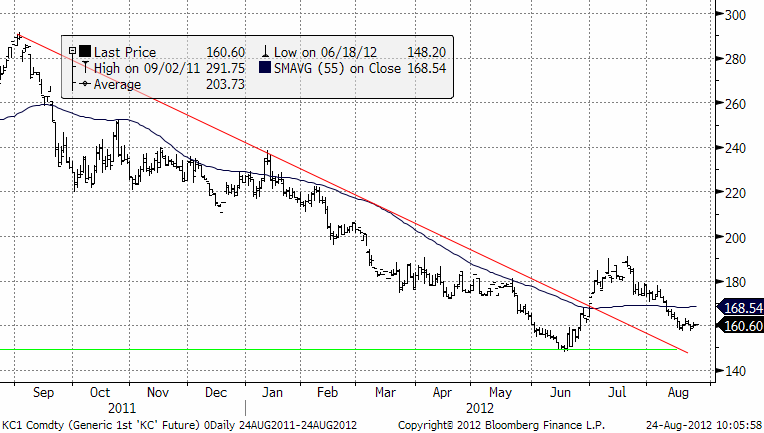
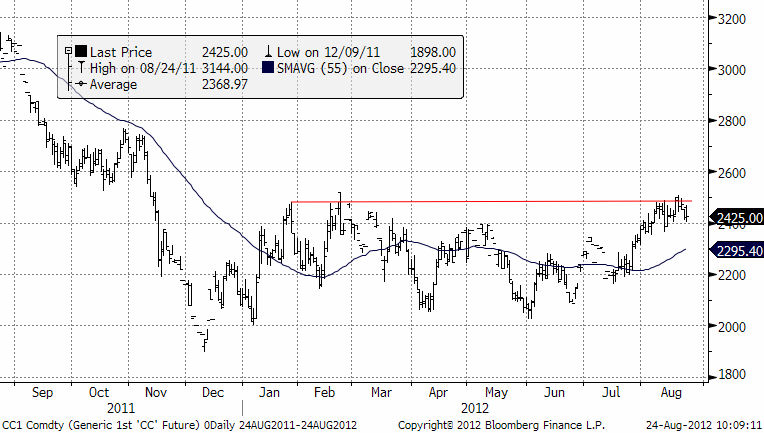
Priset på Arabica, har funnit ett stöd på den jämna siffran 160 cent. Möjligen kan detta stöd bli en bas för en ny uppgång såsom skedde i juni – juli.
Det är låga priser på kaffe och det är, kanske på grund av El Niño – torrt i Vietnam, världens största producent av Robusta. Det gör att bönorna blir mindre, med mindre skörd som följd. Det finns alltså fundamenta som inte bara pekar på lägre priser.
Socker
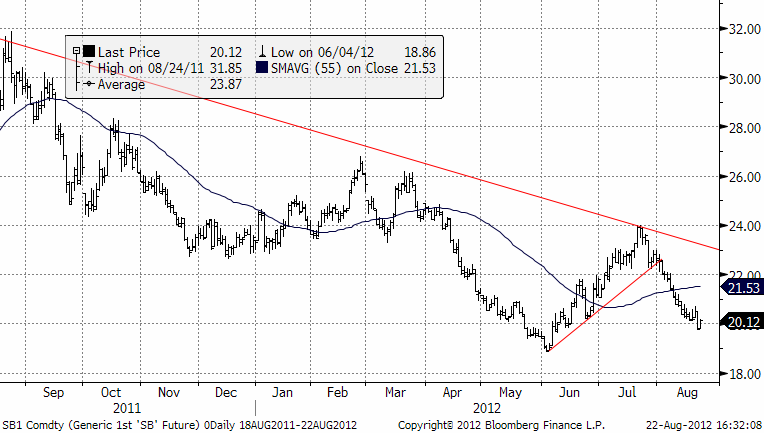
Priset på socker har, såsom vi har förutspått, fortsatt att sjunka. Vi skrev för en vecka sedan att 20 cent är en psykologiskt viktig nivå. Marknaden tvekade lite där, men bröt sedan stödet. Det gör att vi tror att priset kommer att fortsätta ner mot 19 cent i första hand.
Brasiliens sockerrörsområden har haft uppehåll i regnen, vilket gör att skörden kan gå framåt snabbare.
Vi rekommenderade köp av certifikatet SHORT SOCKE A S med en hävstång på – 1.2 för två veckor sedan. Första veckan gav den +5% och den senaste veckan +3%.
Vi rekommenderar att man fortsatt är kort socker, men den som vill ta hem vinster nu vid 20 cent kan kanske göra det för att sedan försöka sälja igen om priset rekylerar upp lite.
Kakao
Kakaopriset har fortsatt att backa efter att ha stött på tekniskt motstånd vid 2500. Vi fortsätter att förhålla oss neutrala vad gäller vår uppfattning om priset.
Om jordbruksprodukterna
Priserna på jordbruksprodukter har fortsatt upp. Tekniskt ser det ut som om priserna på spannmål och oljeväxter kommer att fortsätta stiga, men gårdagskvällens rapport från StatsCanada, som visar en av de största skördarna av spannmål någonsin och den största skörden av raps någonsin, fick marknaderna att tveka.
Pro Farmer crop tour visar en skörd i bättre skick än USDA har förutspått.
Eurozonen ser ut att gå mot en vecka där man får se sanningen i vitögat och det lär knappast öka konsumtionsviljan.
Vi tror att detta kan vara ett köptillfälle och vi fortsätter att tro på högre priser. Än har ransoneringen av konsumtionen av majs – den mest kritiska marknaden – och drivande för vetemarknaden – inte visat något tecken på att komma igång. Tvärtom, faktiskt. Såväl utfordring av djur i USA, som etanolproduktion i USA ökar enligt de senaste rapporterna.
För spannmål och övriga jordbruksprodukter hänvisas till gårdagens nyhetsbrev.
[box]SEB Veckobrev Veckans råvarukommentar är producerat av SEB Merchant Banking och publiceras i samarbete och med tillstånd på Råvarumarknaden.se[/box]
Disclaimer
The information in this document has been compiled by SEB Merchant Banking, a division within Skandinaviska Enskilda Banken AB (publ) (“SEB”).
Opinions contained in this report represent the bank’s present opinion only and are subject to change without notice. All information contained in this report has been compiled in good faith from sources believed to be reliable. However, no representation or warranty, expressed or implied, is made with respect to the completeness or accuracy of its contents and the information is not to be relied upon as authoritative. Anyone considering taking actions based upon the content of this document is urged to base his or her investment decisions upon such investigations as he or she deems necessary. This document is being provided as information only, and no specific actions are being solicited as a result of it; to the extent permitted by law, no liability whatsoever is accepted for any direct or consequential loss arising from use of this document or its contents.
About SEB
SEB is a public company incorporated in Stockholm, Sweden, with limited liability. It is a participant at major Nordic and other European Regulated Markets and Multilateral Trading Facilities (as well as some non-European equivalent markets) for trading in financial instruments, such as markets operated by NASDAQ OMX, NYSE Euronext, London Stock Exchange, Deutsche Börse, Swiss Exchanges, Turquoise and Chi-X. SEB is authorized and regulated by Finansinspektionen in Sweden; it is authorized and subject to limited regulation by the Financial Services Authority for the conduct of designated investment business in the UK, and is subject to the provisions of relevant regulators in all other jurisdictions where SEB conducts operations. SEB Merchant Banking. All rights reserved.
Analys
A sharp weakening at the core of the oil market: The Dubai curve

Down to the lowest since early May. Brent crude has fallen sharply the latest four days. It closed at USD 64.11/b yesterday which is the lowest since early May. It is staging a 1.3% rebound this morning along with gains in both equities and industrial metals with an added touch of support from a softer USD on top.

What stands out the most to us this week is the collapse in the Dubai one to three months time-spread.
Dubai is medium sour crude. OPEC+ is in general medium sour crude production. Asian refineries are predominantly designed to process medium sour crude. So Dubai is the real measure of the balance between OPEC+ holding back or not versus Asian oil demand for consumption and stock building.
A sharp weakening of the front-end of the Dubai curve. The front-end of the Dubai crude curve has been holding out very solidly throughout this summer while the front-end of the Brent and WTI curves have been steadily softening. But the strength in the Dubai curve in our view was carrying the crude oil market in general. A source of strength in the crude oil market. The core of the strength.
The now finally sharp decline of the front-end of the Dubai crude curve is thus a strong shift. Weakness in the Dubai crude marker is weakness in the core of the oil market. The core which has helped to hold the oil market elevated.
Facts supports the weakening. Add in facts of Iraq lifting production from Kurdistan through Turkey. Saudi Arabia lifting production to 10 mb/d in September (normal production level) and lifting exports as well as domestic demand for oil for power for air con is fading along with summer heat. Add also in counter seasonal rise in US crude and product stocks last week. US oil stocks usually decline by 1.3 mb/week this time of year. Last week they instead rose 6.4 mb/week (+7.2 mb if including SPR). Total US commercial oil stocks are now only 2.1 mb below the 2015-19 seasonal average. US oil stocks normally decline from now to Christmas. If they instead continue to rise, then it will be strongly counter seasonal rise and will create a very strong bearish pressure on oil prices.
Will OPEC+ lift its voluntary quotas by zero, 137 kb/d, 500 kb/d or 1.5 mb/d? On Sunday of course OPEC+ will decide on how much to unwind of the remaining 1.5 mb/d of voluntary quotas for November. Will it be 137 kb/d yet again as for October? Will it be 500 kb/d as was talked about earlier this week? Or will it be a full unwind in one go of 1.5 mb/d? We think most likely now it will be at least 500 kb/d and possibly a full unwind. We discussed this in a not earlier this week: ”500 kb/d of voluntary quotas in October. But a full unwind of 1.5 mb/d”
The strength in the front-end of the Dubai curve held out through summer while Brent and WTI curve structures weakened steadily. That core strength helped to keep flat crude oil prices elevated close to the 70-line. Now also the Dubai curve has given in.

Brent crude oil forward curves

Total US commercial stocks now close to normal. Counter seasonal rise last week. Rest of year?

Total US crude and product stocks on a steady trend higher.

Analys
OPEC+ will likely unwind 500 kb/d of voluntary quotas in October. But a full unwind of 1.5 mb/d in one go could be in the cards

Down to mid-60ies as Iraq lifts production while Saudi may be tired of voluntary cut frugality. The Brent December contract dropped 1.6% yesterday to USD 66.03/b. This morning it is down another 0.3% to USD 65.8/b. The drop in the price came on the back of the combined news that Iraq has resumed 190 kb/d of production in Kurdistan with exports through Turkey while OPEC+ delegates send signals that the group will unwind the remaining 1.65 mb/d (less the 137 kb/d in October) of voluntary cuts at a pace of 500 kb/d per month pace.

Signals of accelerated unwind and Iraqi increase may be connected. Russia, Kazakhstan and Iraq were main offenders versus the voluntary quotas they had agreed to follow. Russia had a production ’debt’ (cumulative overproduction versus quota) of close to 90 mb in March this year while Kazakhstan had a ’debt’ of about 60 mb and the same for Iraq. This apparently made Saudi Arabia angry this spring. Why should Saudi Arabia hold back if the other voluntary cutters were just freeriding? Thus the sudden rapid unwinding of voluntary cuts. That is at least one angle of explanations for the accelerated unwinding.
If the offenders with production debts then refrained from lifting production as the voluntary cuts were rapidly unwinded, then they could ’pay back’ their ’debts’ as they would under-produce versus the new and steadily higher quotas.
Forget about Kazakhstan. Its production was just too far above the quotas with no hope that the country would hold back production due to cross-ownership of oil assets by international oil companies. But Russia and Iraq should be able to do it.
Iraqi cumulative overproduction versus quotas could reach 85-90 mb in October. Iraq has however steadily continued to overproduce by 3-5 mb per month. In July its new and gradually higher quota came close to equal with a cumulative overproduction of only 0.6 mb that month. In August again however its production had an overshoot of 100 kb/d or 3.1 mb for the month. Its cumulative production debt had then risen to close to 80 mb. We don’t know for September yet. But looking at October we now know that its production will likely average close to 4.5 mb/d due to the revival of 190 kb/d of production in Kurdistan. Its quota however will only be 4.24 mb/d. Its overproduction in October will thus likely be around 250 kb/d above its quota with its production debt rising another 7-8 mb to a total of close to 90 mb.
Again, why should Saudi Arabia be frugal while Iraq is freeriding. Better to get rid of the voluntary quotas as quickly as possible and then start all over with clean sheets.
Unwinding the remaining 1.513 mb/d in one go in October? If OPEC+ unwinds the remaining 1.513 mb/d of voluntary cuts in one big go in October, then Iraq’s quota will be around 4.4 mb/d for October versus its likely production of close to 4.5 mb/d for the coming month..
OPEC+ should thus unwind the remaining 1.513 mb/d (1.65 – 0.137 mb/d) in one go for October in order for the quota of Iraq to be able to keep track with Iraq’s actual production increase.
October 5 will show how it plays out. But a quota unwind of at least 500 kb/d for Oct seems likely. An overall increase of at least 500 kb/d in the voluntary quota for October looks likely. But it could be the whole 1.513 mb/d in one go. If the increase in the quota is ’only’ 500 kb/d then Iraqi cumulative production will still rise by 5.7 mb to a total of 85 mb in October.
Iraqi production debt versus quotas will likely rise by 5.7 mb in October if OPEC+ only lifts the overall quota by 500 kb/d in October. Here assuming historical production debt did not rise in September. That Iraq lifts its production by 190 kb/d in October to 4.47 mb/d (August level + 190 kb/d) and that OPEC+ unwinds 500 kb/d of the remining quotas in October when they decide on this on 5 October.

Analys
Modest draws, flat demand, and diesel back in focus

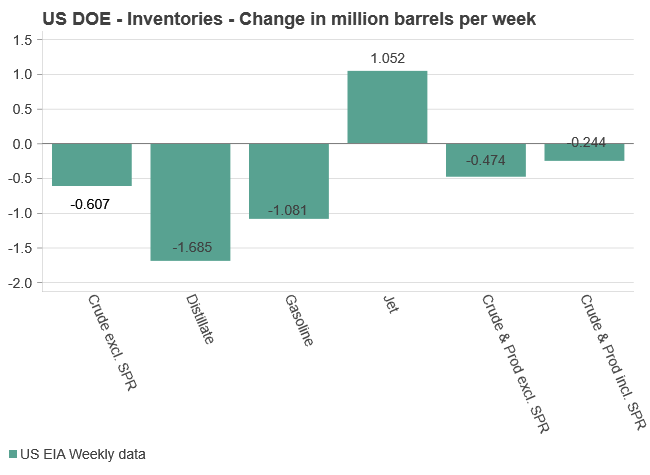
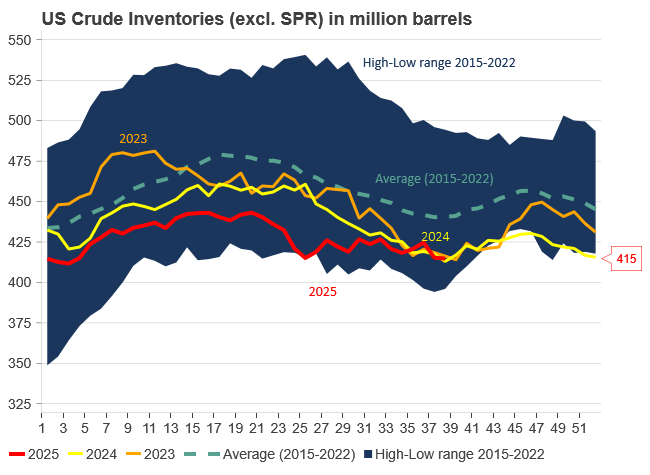
U.S. commercial crude inventories posted a marginal draw last week, falling by 0.6 million barrels to 414.8 million barrels. Inventories remain 4% below the five-year seasonal average, but the draw is far smaller than last week’s massive 9.3-million-barrel decline. Higher crude imports (+803,000 bl d WoW) and steady refinery runs (93% utilization) helped keep the crude balance relatively neutral.

Yet another drawdown indicates commercial crude inventories continue to trend below the 2015–2022 seasonal norm (~440 million barrels), though at 414.8 million barrels, levels are now almost exactly in line with both the 2023 and 2024 trajectory, suggesting stable YoY conditions (see page 3 attached).
Gasoline inventories dropped by 1.1 million barrels and are now 2% below the five-year average. The decline was broad-based, with both finished gasoline and blending components falling, indicating lower output and resilient end-user demand as we enter the shoulder season post-summer (see page 6 attached).
On the diesel side, distillate inventories declined by 1.7 million barrels, snapping a two-week streak of strong builds. At 125 million barrels, diesel inventories are once again 8% below the five-year average and trending near the low end of the historical range.
In total, commercial petroleum inventories (excl. SPR) slipped by 0.5 million barrels on the week to ish 1,281.5 million barrels. While essentially flat, this ends a two-week streak of meaningful builds, reflecting a return to a slightly tighter situation.
On the demand side, the DOE’s ‘products supplied’ metric (see page 6 attached), a proxy for implied consumption, softened slightly. Total demand for crude oil over the past four weeks averaged 20.5 million barrels per day, up just 0.9% YoY.
Summing up: This week’s report shows a re-tightening in diesel supply and modest draws across the board, while demand growth is beginning to flatten. Inventories remain structurally low, but the tone is less bullish than in recent weeks.
-

 Nyheter4 veckor sedan
Mahvie Minerals i en guldtrend
-

 Nyheter4 veckor sedan
Guldpriset kan närma sig 5000 USD om centralbankens oberoende skadas
-

 Nyheter4 veckor sedan
OPEC signalerar att de inte bryr sig om oljepriset faller kommande månader
-

 Analys4 veckor sedan
Volatile but going nowhere. Brent crude circles USD 66 as market weighs surplus vs risk
-
 Nyheter4 veckor sedan
Aktier i guldbolag laggar priset på guld
-

 Nyheter3 veckor sedan
Kinas elproduktion slog nytt rekord i augusti, vilket även kolkraft gjorde
-

 Nyheter3 veckor sedan
Tyskland har så höga elpriser att företag inte har råd att använda elektricitet
-
 Nyheter4 veckor sedan
Guld når sin högsta nivå någonsin, nu även justerat för inflation


