Analys
SEB – Råvarukommentarer vecka 26 2012
Sammanfattning: Denna vecka
- Brett råvaruindex: +2,74%
UBS Bloomberg CMCI TR Index - Energi: +1,05%
UBS Bloomberg CMCI Energy TR Index - Ädelmetaller: +0,18%
UBS Bloomberg CMCI Precious Metals TR Index - Industrimetaller: +1,44%
UBS Bloomberg CMCI Industrial Metals TR Index - Jordbruk: +6,44%
UBS Bloomberg CMCI Agriculture TR Index
Kortsiktig marknadsvy:
- Guld: Neutral/köp
- Olja: Neutral/köp
- Koppar: Neutral
- Majs: Köp
- Vete: Köp
Guld
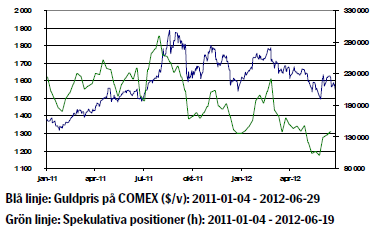
Fokus i veckan har riktats mot gårdagens och dagens EU-toppmöte. Tongångarna mellan ledarna har varit skarpa och den rådande oenigheten är stor, framförallt vad gäller möjligheten till en framtida fiskal integration, något som skulle inskränka ländernas nationella självbestämmande. Möjligheterna att EU-ledarna ska komma fram till några tydliga beslut måste betraktas som små. Idag på morgon är det övervägande positiv stämning som överväger det negativa sentiment som rådde igår. Natten till idag enades ledarna att några nödvändiga punkter som börjar likna en krisplan.
Oron för Spanien fortsätter och i veckan kom dessutom formella ansökningar om stöd från både Cypern och Spanien.
I Grekland är en ny regering på plats och det finns förmodligen ett visst utrymme för att man ska komma överens med sina långivare om smärre lättnader i villkoren för stödlånen.
Guldet har backat 0,10 procent under veckan. Vi anser inte att guldrally är troligt men att vi kommer se högre priser på kort sikt.
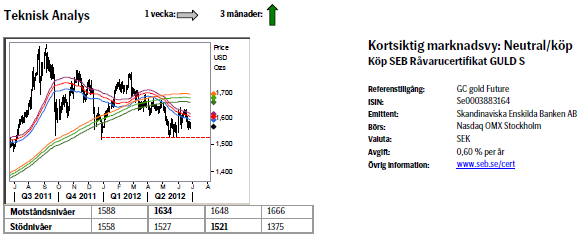
Teknisk analys: Tillbaka under 55d bandet.
Något förvånande, i.a.f. för undertecknad, föll den gula metallen tillbaka under 55dagars bandet, något som gör att vi måste vara lite försiktigare. Fortfarande gäller att så länge vi inte bryter under decembers botten, 1521, så kvarstår den generellt positiva vyn. Förnyad styrka utlöses vid uppgång över 1634.
Olja
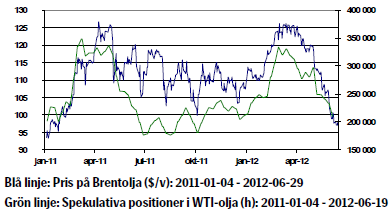
Priset på Brentolja steg 2,3 procent under veckan och handlade vid fler tillfällen under 90 dollar nivån. En av orsakerna till det fallande oljepriset är det utbudsöverskott som vi ser för tillfället.
Den pågående strejken bland norska oljearbetare minskar oljeproduktionen med cirka 200 000 fat per dag vilket ger stöd åt priset.
EU-ländernas embargo mot Iran träder i kraft nästa vecka. Försäkringsbolag i Europa är förbjudna att försäkra oljefrakt från Iran. Effekterna av sanktionerna mot Iran börjar bli kännbara för landets invånare och dess regim. En mycket försvårande omständighet för landet är kraftigt ökade spannmålspriser på världsmarknaden vilka bidrar till att hålla inflationen hög.
American Petroleum Institute publicerade i tisdags den inofficiella statistiken över amerikanska oljelager vilken visade att lagren av råolja steg med 0,5 miljoner fat förra veckan. Statistiken från USA:s energidepartement, DOE, inkom i onsdags och visade att lagren av råolja sjönk med ringa 0,1 miljoner fat under förra veckan.
Positiva nyheter från EU-toppmötet och en fortsatt försvagning av dollarn kan snabbt ge ett Brentpris över hundra dollar. På kort sikt ser det fortsatt osäkert ut.
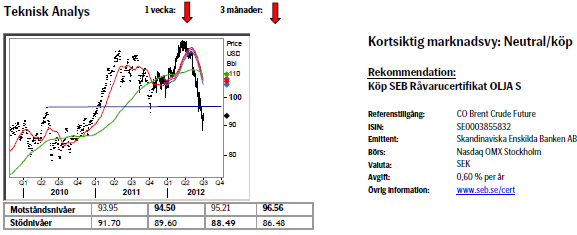
Teknisk analys: Ramlade ned i falluckan.
En ny stark säljsignal utlöstes i och med förra veckans stängning. Då vi nu fallit igenom huvudstödet sätter vi ett nytt medelsiktigt mål runt $78. Uppgångar förväntas bli temporära och inte orka mycket mer än 96.50 området samt om de inträffar utnyttjas till att sälja.
Koppar
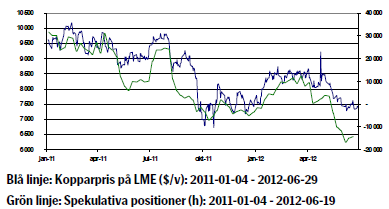
Kopparpriset steg 3,2 procent under veckan.
I onsdags publicerades kontrakterade hus affärer i USA vilka överraskade positivt och kopparpriset steg på siffrorna. Antalet nya kontrakt om köp av befintliga bostäder i USA steg med 5,9 procent i maj jämfört med föregående månad. Det framgår av National Association of Realtors, NAR, index över kontrakterade husaffärer.
På grund av risken för inflation i Kina om matpriser fortsätter att stiga kan kinesiska myndigheter som följd avvakta med de stimulanser man tidigare annonserat vilket skulle påverka kopparpriset negativt.
Med en europeisk skuldkris som fortsätter skapa stor osäkerhet och allmänt sett svag makrostatistik med en långsam återhämtning i USA och en inbromsning i Kina är risken stor att kopparpriset ligger kvar på nuvarande nivåer på kort sikt.
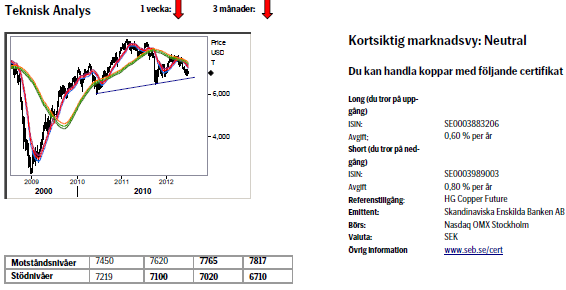
Teknisk analys: Nacklinjen nästa.
Den mindre uppgång som vi såg som ytterst korrektiv har nu avslutats och marknaden följaktligen vänt nedåt. Nästa viktiga steg kommer att bli ett test av nacklinjen (av den stora huvud-skuldra formation som nu befinner sig i sitt slutskede (nickel o alu har redan brutit ned från liknande toppformationer) och ett brott (troligt) bör få långtgående implikationer för kopparpriset.
Majs
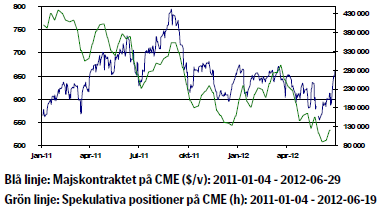
Amerikansk majs har handlats upp kraftigt p.g.a. av den allvarliga torka som råder i USA och majsen fortsätter att handla på höga nivåer. Bristen på fukt kan komma påverka kvalitén negativt. Majspriset steg 15 procent under veckan och det är en helt väderrelaterad prisökning.
Spreaden mellan juliterminskontraktet och decemberterminskontraktet har minskat till 20-månaders lägsta eftersom priset på närliggande terminskontrakt stigit kraftigt p.g.a. ökad oro för den kommande skörden.
I Europa är däremot vädret betydligt mera gynnsamt.
Enligt USDA crop report för den amerikanska majsen är andelen good/excellent 56 procent, jämfört med 63 procent föregående vecka. Samma period föregående år låg nivåerna på 70 procent.
Andelen poor/very poor låg på 14 procent, förra veckan 9 procent jämfört med samma period förra året då nivån låg på 9 procent.
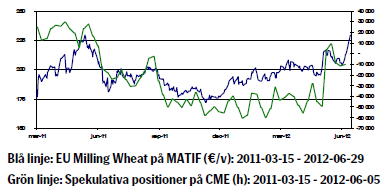
Ser man till hedgefonder och spekulanter är de enligt US Commodity Futures Trading Commission fortsatt försiktigt positionerade för högre priser med 70 715 utstående terminer och optioner i juni jämfört med ett två års genomsnitt på 257 000 kontrakt per månad.
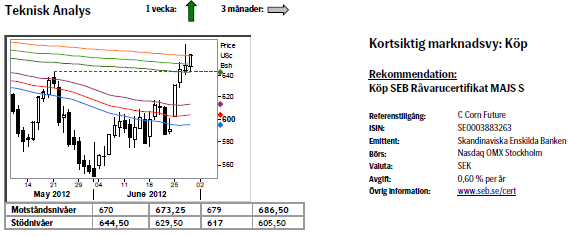
Teknisk analys: Fortsatt rally.
Rallyt har fortsatt sedan förra veckan och därigenom ökat på den positiva bilden pga 1) att vi nu passerat 55dagars bandet samt 2) att vi passerat föregående rekyltopp. Sammantaget finner vi att sannolikheten för ytterligare uppgång ser bra ut varför vi rekommenderar att köpa ett återtest av brottet av majtoppen.
Vete
Jordbrukssektorn har fortsatt högre under veckan. Förhållandena i de viktiga amerikanska odlingsområdena är fortsatt mycket torra och heta.
De senaste väderprognoserna håller fast vid hett och torrt väder och risken ökar för ytterligare skada/sämre skördar.
Enligt USDA crop report för vintervetet är andelen good/excellent 54 procent, samma siffra som föregående vecka. Samma period föregående år låg nivåerna på 25 procent.
För vårvetet är andelen good/excellent 77 procent jämfört med föregående vecka då det var 76 procent. Samma period föregående år var andelen 69 procent. I Europa gynnar regnet i de norra regionerna det planterade vetet medan det torra och varma vädret fortsätter i de södra delarna där skörden alltså kan fortgå utan problem.
I USA finns det på grund av torkan risker för skador men några större skador har ännu inte skett i praktiken. Situationen kan alltså förbättras snabbt om man får lite mer regn.
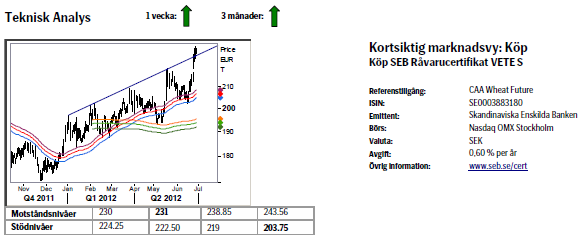
Teknisk analys: Upp i överljudsfart.
I en enastående hastighet har marknaden stigit sedan det senaste besöket i 55dagars bandet, vilket ligger helt i plan med vår vy, denna pekade som sagt var inte bara på ett återtest av 218.75 utan också att 2011 års topp, 231, ska passeras. Ligg lång men passopp om vi återvänder ned under den tidigare topplinjen.
[box]SEB Veckobrev Veckans råvarukommentar är producerat av SEB Merchant Banking och publiceras i samarbete och med tillstånd på Råvarumarknaden.se[/box]
Disclaimer
The information in this document has been compiled by SEB Merchant Banking, a division within Skandinaviska Enskilda Banken AB (publ) (“SEB”).
Opinions contained in this report represent the bank’s present opinion only and are subject to change without notice. All information contained in this report has been compiled in good faith from sources believed to be reliable. However, no representation or warranty, expressed or implied, is made with respect to the completeness or accuracy of its contents and the information is not to be relied upon as authoritative. Anyone considering taking actions based upon the content of this document is urged to base his or her investment decisions upon such investigations as he or she deems necessary. This document is being provided as information only, and no specific actions are being solicited as a result of it; to the extent permitted by law, no liability whatsoever is accepted for any direct or consequential loss arising from use of this document or its contents.
About SEB
SEB is a public company incorporated in Stockholm, Sweden, with limited liability. It is a participant at major Nordic and other European Regulated Markets and Multilateral Trading Facilities (as well as some non-European equivalent markets) for trading in financial instruments, such as markets operated by NASDAQ OMX, NYSE Euronext, London Stock Exchange, Deutsche Börse, Swiss Exchanges, Turquoise and Chi-X. SEB is authorized and regulated by Finansinspektionen in Sweden; it is authorized and subject to limited regulation by the Financial Services Authority for the conduct of designated investment business in the UK, and is subject to the provisions of relevant regulators in all other jurisdictions where SEB conducts operations. SEB Merchant Banking. All rights reserved.
Analys
More weakness and lower price levels ahead, but the world won’t drown in oil in 2026

Some rebound but not much. Brent crude rebounded 1.5% yesterday to $65.47/b. This morning it is inching 0.2% up to $65.6/b. The lowest close last week was on Thursday at $64.11/b.

The curve structure is almost as week as it was before the weekend. The rebound we now have gotten post the message from OPEC+ over the weekend is to a large degree a rebound along the curve rather than much strengthening at the front-end of the curve. That part of the curve structure is almost as weak as it was last Thursday.
We are still on a weakening path. The message from OPEC+ over the weekend was we are still on a weakening path with rising supply from the group. It is just not as rapidly weakening as was feared ahead of the weekend when a quota hike of 500 kb/d/mth for November was discussed.
The Brent curve is on its way to full contango with Brent dipping into the $50ies/b. Thus the ongoing weakening we have had in the crude curve since the start of the year, and especially since early June, will continue until the Brent crude oil forward curve is in full contango along with visibly rising US and OECD oil inventories. The front-month Brent contract will then flip down towards the $60/b-line and below into the $50ies/b.
At what point will OPEC+ turn to cuts? The big question then becomes: When will OPEC+ turn around to make some cuts? At what (price) point will they choose to stabilize the market? Because for sure they will. Higher oil inventories, some more shedding of drilling rigs in US shale and Brent into the 50ies somewhere is probably where the group will step in.
There is nothing we have seen from the group so far which indicates that they will close their eyes, let the world drown in oil and the oil price crash to $40/b or below.
The message from OPEC+ is also about balance and stability. The world won’t drown in oil in 2026. The message from the group as far as we manage to interpret it is twofold: 1) Taking back market share which requires a lower price for non-OPEC+ to back off a bit, and 2) Oil market stability and balance. It is not just about 1. Thus fretting about how we are all going to drown in oil in 2026 is totally off the mark by just focusing on point 1.
When to buy cal 2026? Before Christmas when Brent hits $55/b and before OPEC+ holds its last meeting of the year which is likely to be in early December.
Brent crude oil prices have rebounded a bit along the forward curve. Not much strengthening in the structure of the curve. The front-end backwardation is not much stronger today than on its weakest level so far this year which was on Thursday last week.

The front-end backwardation fell to its weakest level so far this year on Thursday last week. A slight pickup yesterday and today, but still very close to the weakest year to date. More oil from OPEC+ in the coming months and softer demand and rising inventories. We are heading for yet softer levels.

Analys
A sharp weakening at the core of the oil market: The Dubai curve

Down to the lowest since early May. Brent crude has fallen sharply the latest four days. It closed at USD 64.11/b yesterday which is the lowest since early May. It is staging a 1.3% rebound this morning along with gains in both equities and industrial metals with an added touch of support from a softer USD on top.

What stands out the most to us this week is the collapse in the Dubai one to three months time-spread.
Dubai is medium sour crude. OPEC+ is in general medium sour crude production. Asian refineries are predominantly designed to process medium sour crude. So Dubai is the real measure of the balance between OPEC+ holding back or not versus Asian oil demand for consumption and stock building.
A sharp weakening of the front-end of the Dubai curve. The front-end of the Dubai crude curve has been holding out very solidly throughout this summer while the front-end of the Brent and WTI curves have been steadily softening. But the strength in the Dubai curve in our view was carrying the crude oil market in general. A source of strength in the crude oil market. The core of the strength.
The now finally sharp decline of the front-end of the Dubai crude curve is thus a strong shift. Weakness in the Dubai crude marker is weakness in the core of the oil market. The core which has helped to hold the oil market elevated.
Facts supports the weakening. Add in facts of Iraq lifting production from Kurdistan through Turkey. Saudi Arabia lifting production to 10 mb/d in September (normal production level) and lifting exports as well as domestic demand for oil for power for air con is fading along with summer heat. Add also in counter seasonal rise in US crude and product stocks last week. US oil stocks usually decline by 1.3 mb/week this time of year. Last week they instead rose 6.4 mb/week (+7.2 mb if including SPR). Total US commercial oil stocks are now only 2.1 mb below the 2015-19 seasonal average. US oil stocks normally decline from now to Christmas. If they instead continue to rise, then it will be strongly counter seasonal rise and will create a very strong bearish pressure on oil prices.
Will OPEC+ lift its voluntary quotas by zero, 137 kb/d, 500 kb/d or 1.5 mb/d? On Sunday of course OPEC+ will decide on how much to unwind of the remaining 1.5 mb/d of voluntary quotas for November. Will it be 137 kb/d yet again as for October? Will it be 500 kb/d as was talked about earlier this week? Or will it be a full unwind in one go of 1.5 mb/d? We think most likely now it will be at least 500 kb/d and possibly a full unwind. We discussed this in a not earlier this week: ”500 kb/d of voluntary quotas in October. But a full unwind of 1.5 mb/d”
The strength in the front-end of the Dubai curve held out through summer while Brent and WTI curve structures weakened steadily. That core strength helped to keep flat crude oil prices elevated close to the 70-line. Now also the Dubai curve has given in.

Brent crude oil forward curves

Total US commercial stocks now close to normal. Counter seasonal rise last week. Rest of year?

Total US crude and product stocks on a steady trend higher.

Analys
OPEC+ will likely unwind 500 kb/d of voluntary quotas in October. But a full unwind of 1.5 mb/d in one go could be in the cards

Down to mid-60ies as Iraq lifts production while Saudi may be tired of voluntary cut frugality. The Brent December contract dropped 1.6% yesterday to USD 66.03/b. This morning it is down another 0.3% to USD 65.8/b. The drop in the price came on the back of the combined news that Iraq has resumed 190 kb/d of production in Kurdistan with exports through Turkey while OPEC+ delegates send signals that the group will unwind the remaining 1.65 mb/d (less the 137 kb/d in October) of voluntary cuts at a pace of 500 kb/d per month pace.

Signals of accelerated unwind and Iraqi increase may be connected. Russia, Kazakhstan and Iraq were main offenders versus the voluntary quotas they had agreed to follow. Russia had a production ’debt’ (cumulative overproduction versus quota) of close to 90 mb in March this year while Kazakhstan had a ’debt’ of about 60 mb and the same for Iraq. This apparently made Saudi Arabia angry this spring. Why should Saudi Arabia hold back if the other voluntary cutters were just freeriding? Thus the sudden rapid unwinding of voluntary cuts. That is at least one angle of explanations for the accelerated unwinding.
If the offenders with production debts then refrained from lifting production as the voluntary cuts were rapidly unwinded, then they could ’pay back’ their ’debts’ as they would under-produce versus the new and steadily higher quotas.
Forget about Kazakhstan. Its production was just too far above the quotas with no hope that the country would hold back production due to cross-ownership of oil assets by international oil companies. But Russia and Iraq should be able to do it.
Iraqi cumulative overproduction versus quotas could reach 85-90 mb in October. Iraq has however steadily continued to overproduce by 3-5 mb per month. In July its new and gradually higher quota came close to equal with a cumulative overproduction of only 0.6 mb that month. In August again however its production had an overshoot of 100 kb/d or 3.1 mb for the month. Its cumulative production debt had then risen to close to 80 mb. We don’t know for September yet. But looking at October we now know that its production will likely average close to 4.5 mb/d due to the revival of 190 kb/d of production in Kurdistan. Its quota however will only be 4.24 mb/d. Its overproduction in October will thus likely be around 250 kb/d above its quota with its production debt rising another 7-8 mb to a total of close to 90 mb.
Again, why should Saudi Arabia be frugal while Iraq is freeriding. Better to get rid of the voluntary quotas as quickly as possible and then start all over with clean sheets.
Unwinding the remaining 1.513 mb/d in one go in October? If OPEC+ unwinds the remaining 1.513 mb/d of voluntary cuts in one big go in October, then Iraq’s quota will be around 4.4 mb/d for October versus its likely production of close to 4.5 mb/d for the coming month..
OPEC+ should thus unwind the remaining 1.513 mb/d (1.65 – 0.137 mb/d) in one go for October in order for the quota of Iraq to be able to keep track with Iraq’s actual production increase.
October 5 will show how it plays out. But a quota unwind of at least 500 kb/d for Oct seems likely. An overall increase of at least 500 kb/d in the voluntary quota for October looks likely. But it could be the whole 1.513 mb/d in one go. If the increase in the quota is ’only’ 500 kb/d then Iraqi cumulative production will still rise by 5.7 mb to a total of 85 mb in October.
Iraqi production debt versus quotas will likely rise by 5.7 mb in October if OPEC+ only lifts the overall quota by 500 kb/d in October. Here assuming historical production debt did not rise in September. That Iraq lifts its production by 190 kb/d in October to 4.47 mb/d (August level + 190 kb/d) and that OPEC+ unwinds 500 kb/d of the remining quotas in October when they decide on this on 5 October.

-

 Nyheter4 veckor sedan
Kinas elproduktion slog nytt rekord i augusti, vilket även kolkraft gjorde
-

 Nyheter4 veckor sedan
Tyskland har så höga elpriser att företag inte har råd att använda elektricitet
-
 Nyheter4 veckor sedan
Det stigande guldpriset en utmaning för smyckesköpare
-

 Nyheter2 veckor sedan
OPEC+ missar produktionsmål, stöder oljepriserna
-

 Nyheter3 veckor sedan
Ett samtal om guld, olja, fjärrvärme och förnybar energi
-

 Analys4 veckor sedan
Brent crude ticks higher on tension, but market structure stays soft
-

 Analys3 veckor sedan
Are Ukraine’s attacks on Russian energy infrastructure working?
-

 Nyheter1 vecka sedan
Guld nära 4000 USD och silver 50 USD, därför kan de fortsätta stiga


