Analys
SEB – Råvarukommentarer vecka 22 2012
 Brett råvaruindex: -2,79 %
UBS Bloomberg CMCI TR Index- Energi: -4,81 %
UBS Bloomberg CMCI Energy TR Index - Ädelmetaller: -1,06%
UBS Bloomberg CMCI Precious Metals TR Index - Industrimetaller: -2,15 %
UBS Bloomberg CMCI Industrial Metals TR Index - Jordbruk: -2,14 %
UBS Bloomberg CMCI Agriculture TR Index
Kortsiktig marknadsvy:
- Guld: Neutral/köp
- Olja: Neutral/sälj
- Koppar: Sälj
- Majs: Sälj
- Vete: Neutral
Guld
Sedan vårt senaste veckobrev har guldet stigit 0,30 procent. Priset verkar tillfälligtvis ha stabiliserats men överskuggas samtidigt av ekonomisk osäkerhet och en eskalerande europeisk kris. Det grekiska valet avgörs den 17:e juni och oron för att landet ska lämna eurosamarbetet är påtaglig. Greklands förre premiärminister Papademos varnar för en akut likviditetskris om folket inte röstar fram en stabil regering.
De senaste dagarna har även genomsyrats av dåliga nyheter från Spanien där läget blir allt mer bekymmersamt. De spanska bankerna är i akut behov av finansiellt stöd och även på regional nivå finns det stora finansiella problem. På tisdagskvällen meddelade dessutom centralbankschefen att han avgår en månad i förtid. Spansk tioårsräntan steg till 6,61 procent. I vanlig ordning motsvaras ränteuppgången i skuldkrisländerna av sjunkande räntor i de mer stabila länderna. Tysklands 10-åriga ränta låg igår på rekordlåga1,20 procent.
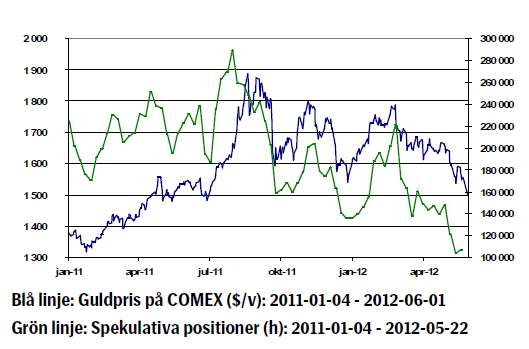
Nettolånga spekulativa positioner på COMEX har fortsatt att minska vilket sätter press på priset.
Förra veckan såg vi de lägsta nivåerna sedan december 2008. Även innehaven i världens största guld ETF, SPDR, fortsätter att minska.
Enligt indiska Bombay Bullion Association har efterfrågan på fysiskt guld i landet minskat. Enligt organisationen kommer Indien att importera cirka 50 ton guld under maj jämfört med 102 ton samma period föregående år. Anledningar till detta är en mot dollarn svag inhemsk valuta samt tullar som införts på importerat guld.
Mycket talar egentligen för guld, men guld beter sig förtillfället som en ”risky asset” och har tydligt kopplat loss från den långa stigande trenden. Vi föredrar för tillfället en försiktig hållning till guldet (med en stop loss i 1450/1500 regionen).
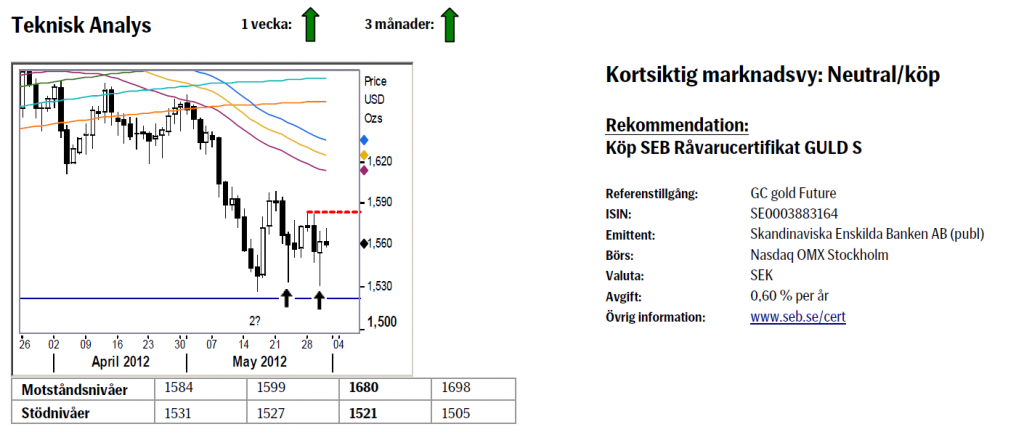
Teknisk analys: Den större bilden förblir som tidigare ograverat positiv så länge marknaden inte faller under 1521 (C vågens botten från december 2011). Denna vecka fokuserar vi lite mer på vad som skett runt maj botten. Som vi kan se har marknaden gång efter annan försökt ta sig nedåt men utan någon framgång vilket spikarna på nedsidan visar med all tydlighet. Detta beteende ska ses positivt (köparna kör över säljarna) samt att köpandet skett trots en kraftigt stigande dollar. Vi vidhåller alltså förra veckans försiktiga köprekommendation.
Olja
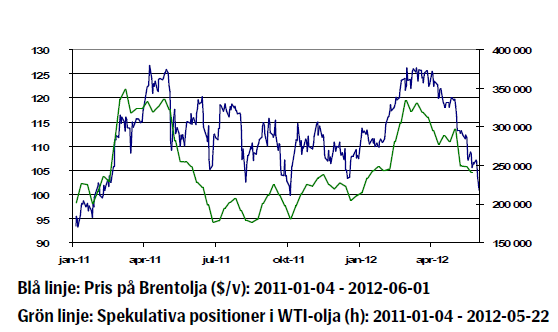
Priset på Nordsjöoljan Brent har sjunkit fem procent veckan som gått och har nu backat hela 14 procent sedan början av maj. Några av anledningarna till svagheten i oljepriset är kombinationen av en för tillfället överproduktion, dollarns styrka och ett negativt makrosentiment till följd av en förvärrad europeisk skuldkris. Saudiarabien har ett uttalat mål att få ner oljepriset till 100 dollar per fat och har hittills lyckats bra med att sätta press på priset. Ett pris under 100 dollar per fat är emellertid inte önskvärt.
Gårdagens officiella rapport över amerikanska oljelager som publiceras av DOE visade att råoljelager steg med 2,2 miljoner fat och lagren är nu de högsta på 22 år. Samtidigt är lagren av oljeprodukter relativt låga vilket är vanligt under raffinaderiunderhållssäsongen.
Spänningarna mellan Iran och västvärlden kvarstår och mötet som ägde rum förra veckan resulterade endast i beslut om nya förhandlingar i Moskva den 18-19 juni. Enligt uppgifter från FN har Iran fortsatt att öka sin produktion av anrikat uran. Iran har tydligt deklarerat att IAEA:s inspektörer inte har tillräckliga motiv för att få besöka Parchinanläggningen, ett forskningscentra för kärnvapen.
Enligt chefen för Irans kärnvapenprogram finns det ingen anledning till att upphöra med produktionen av anrikat uran vilket utgör grunden till en kärnvapenbomb. Sanktioner mot Iran träder ikraft den första juli.
Orkansäsongen har inletts. Enligt amerikanska National Hurricane Center nådde den tropiska stormen Beryl Floridas kust med vindstyrkor strax över 100 km/h. Vi ser en säsongsmässigt svag efterfrågan och vi anser att det finns risk för ett tillbakahållet oljepris på kort sikt. Dippar under 100 dollar kan innebära köptillfälle om man vill äga olja på lite längre sikt.
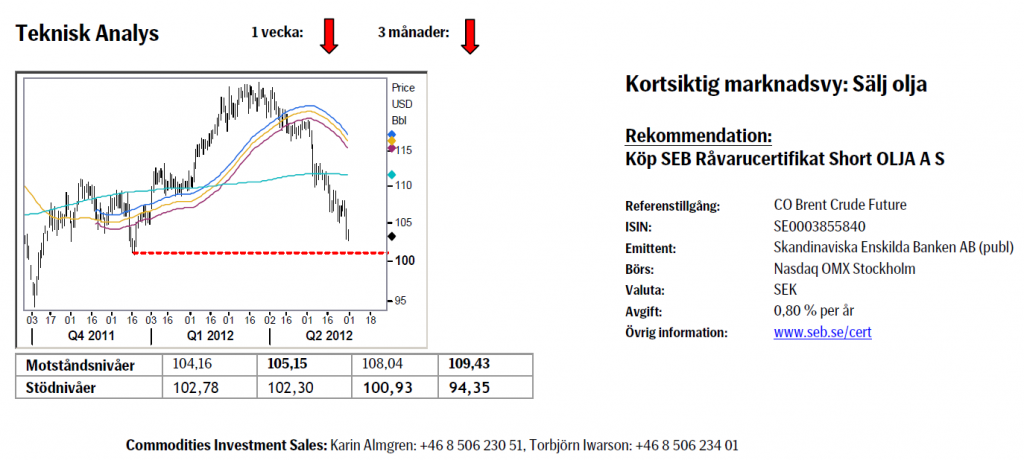
Teknisk analys: Fritt fall för det svarta guldet. Det temporära stödet, 105.15, höll under fyra/fem dagar innan vi kraschade ned igenom det. Vi är nu på väg i full fart mot ett test av nästa huvudstöd, den medel/långsiktiga nyckelnivån 100.93. Om inte köpare återfinnes där kommer en ånyo en säljsignal att utlösas, denna gång med ett mål under 94.
Koppar
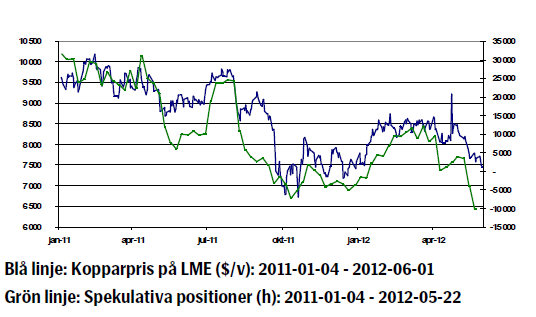
Kopparpriset föll 0,75 procent veckan som gick. Kopparn dras ner av svag kinesisk data och den starka handelskopplingen mellan Europa och Kina och vi räknar med att denna turbulens kommer att fortsätta på kort sikt. Rapporter om höga kopparlager fortsätter dessutom att strömma ut ur Kina. Osäkerheten kring Europa påverkar kopparpriset negativt. Euron föll till den lägsta nivån mot dollarn på två år.
Marknaden håller idag ett öga på viktig ekonomisk data. Kinas officiella inköpschefsindex som publicerades i morse kom in lägre än väntat vilket antyder fortsatt tillväxtinbromsning under andra kvartalet. Amerikanska viktiga arbetsmarknadssiffrorna publiceras klockan 14.30.
Frågan är hur Kina kommer att hantera inbromsningen av tillväxten. Kinesiska myndigheter har tydligt påtalat att man genom stimulanser vill stabilisera tillväxten men samtidigt har en kinesisk statlig nyhetsbyrå rapporterat att stimulanserna kommer att bli mindre jämfört med krisen 2008/2009 och denna försiktighet från myndigheternas sida håller tillbaka kopparpriset.
Den globala produktionen av koppar understeg efterfrågan med 81 000 ton i februari i år, efter ett underskott om 29 000 ton i januari. Säsongsjusterat understeg produktionen efterfrågan med 100 000 ton enligt International copper Study Group, ICSG. Detta underskott av koppar i marknaden lyckas inte få priset att lyfta, i alla fall inte på kort sikt. Vi tror inte på en kollaps i kopparpriset men att det kan fortsätta vara skakigt och kortsiktigt tror vi att priset kan falla ytterligare.
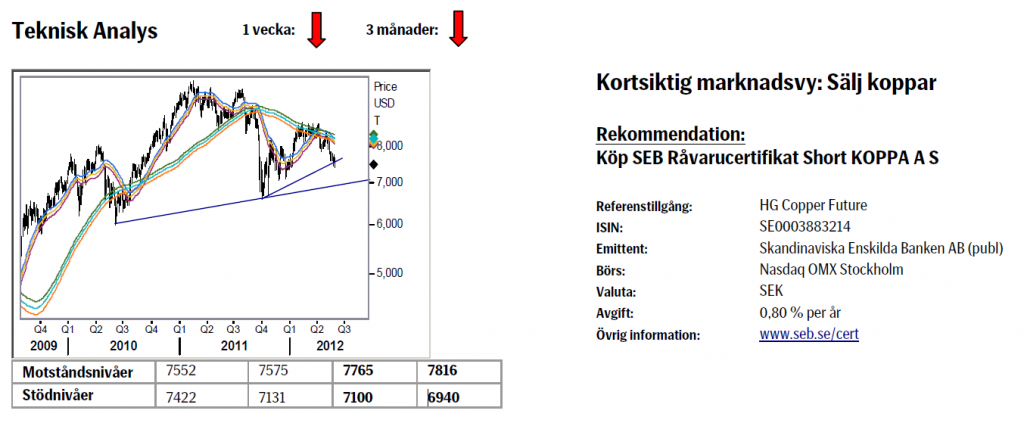
Teknisk analys: Billigare koppar på gång. Marknaden har nu även passerat stödlinjen ifrån oktober 2011 varför vi nu fått ännu mer vatten på vår kvarn avseende säljrekommendationen. Som tidigare förväntar vi oss ingen större rekyl innan nacklinjen nås vid 6940.
Majs
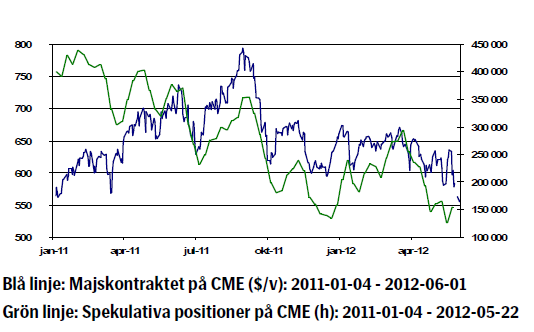
Majspriset föll 0,89 procent veckan som gick. IGC har reviderat upp den globala majs produktionen för 2012/13 med 13 miljoner ton till rekordhöga 913 miljoner ton, främst till följd av förbättrade utsikter i USA, Kina och Brasilien. Ingående lager justeras upp med 6 miljoner ton till 141 miljoner ton, långt över förra säsongens 129 miljoner ton. Utbudet förväntas vara stabilt (jämfört med 2011/12) och majs kan komma att ersätta en del av vete som foderingrediens. Globala majs lager förväntas däremot att öka till ett treårs högsta i slutet av 2012/13 till följd av en rekordhög produktion.
Ukrainas produktion av majs beräknas till rekordhöga 24 miljoner ton, en ökning med 5.3% från 2011, och exporten till 14 miljoner ton – vilket är i linje med USDA prognos. Argentinas export av majs under 2011/12 estimeras ned 20 procent från förra året.
Kinas majsareal 2012/13 beräknas uppgå till 34.4 miljoner hektar, en ökning med en miljon från tidigare estimat, och landets produktion av majs uppskattas till 189 miljoner ton, jämfört med den tidigare uppskattningen på 186 miljoner ton. Prognosen för Kinas import av majs ligger på 7 miljoner ton, vilket är en ökning med en miljon ton från tidigare estimat och också en miljon ton högre än USDA senaste prognos. Vi fortsätter att vara kortsiktigt negativa till majspriset på grund av goda skördar och höga lagernivåer och rekommenderar därför en kort position.
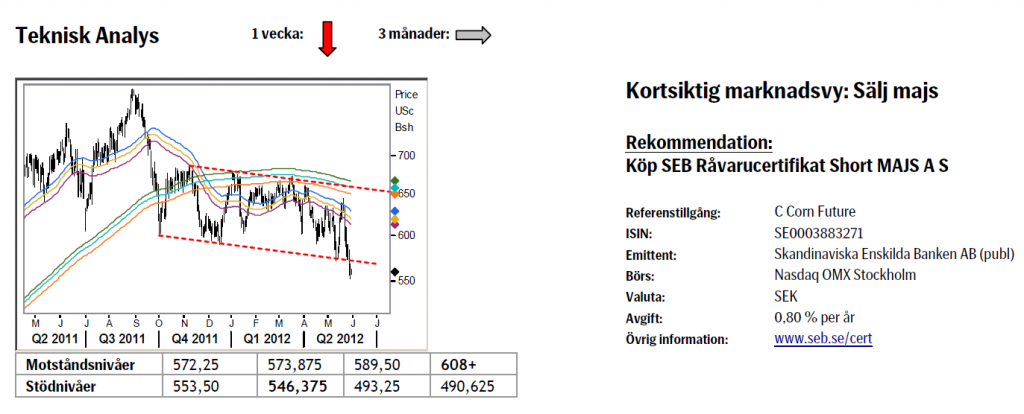
Teknisk analys: Ramlade ur kanalen. Även om rörelserna företrädesvis fortsatt att vara relativt slumpartade och med låg sannolikhet så noterar vi i alla fall att det potentiella ras vi pekade på för två veckor sedan nu skett. Brottet ned ur den sluttande kanalen ökar naturligtvis nedåttrycket och borde ge mer prispress. Om vi ska följa skolboken borde vi kunna falla så djupt som 491 innan fast mark återfinnes.
Vete
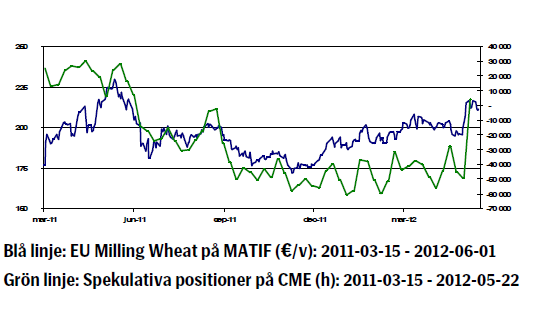
Vetepriset har under veckan fallit med 2,10 procent. Marknaden för spannmål styrs främst av väderleksrapporter och nu är det framförallt fokus på nederbörd. Efterlängtade regn i Ryssland, Svartahavsregionen, Australien och USA har dämpat oron för allvarlig torka och därmed gjort att priserna, framförallt på vete, har fallit.
Australiens spannmålsproducerande områden i öster har fått välbehövligt regn under helgen och därmed höjt förhoppningarna om en högre avkastning för 2012/13 års veteproduktion. Delar av Ryssland, Ukraina och norra Kazakstan kommer att få svalare temperaturer och regn kommande dagar, vilket gynnar grödorna.
IGC (International Grains Council) skriver i sin senaste rapport att utsikterna för vete kommande säsong 2012/13 var fortsatt goda under maj, men ogynnsamma väderförhållanden i EU, Ryssland och Marocko sänker förväntningarna på kommande skördar och bidrar till att den globala produktionen justeras ned med 5 miljoner ton till 671 miljoner ton, en kraftig nedjustering från förra årets 676 miljoner ton. En ökad användning av foder leder till högre förväntad global konsumtion på 681 miljoner ton, vilket dock lägre än för 2011/12 eftersom majs till viss del förväntas ersätta vete till djurfoder. Detta kommer dock inte att uppväga nedgången i produktionen och globala utgående lager justeras därför ned till ett fyraårs lägsta på 191 miljoner ton.
Den globala exporten förväntas också bli lägre under 2012/13 jämfört med 2011/12 på grund av mindre skördar i Svartahavsregionen och minskat överskott i EU och Argentina för export. Matifvetet steg i slutet av förra veckan på rapporterna om torka i Ryssland, Ukraina och USA. Nya prognoser denna vecka har innehållit regn vilket fått priset att falla tillbaka. Kvalitén på höstvetets skörd i USA ligger nu på 54 procent good/excellent och det är fyra procent lägre jämfört förra veckan. Vi behåller vår neutrala syn på vetet.
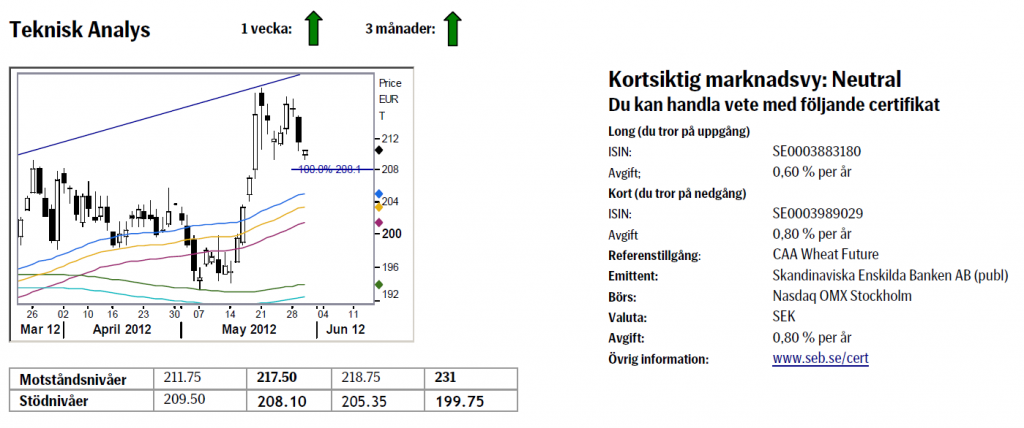
Teknisk analys: Innevarande korrektion lägre bör nu vara i sin slutfas varför vi letar efter nya köpare runt idealmålet för korrektionen, 208.10. En påföljande uppgång över 217.50 kommer sedan att bekräfta fortsättningen av uppåttrenden (och nya toppar vad det lider).
[box]SEB Veckobrev Veckans råvarukommentar är producerat av SEB Merchant Banking och publiceras i samarbete och med tillstånd på Råvarumarknaden.se[/box]
Disclaimer
The information in this document has been compiled by SEB Merchant Banking, a division within Skandinaviska Enskilda Banken AB (publ) (“SEB”).
Opinions contained in this report represent the bank’s present opinion only and are subject to change without notice. All information contained in this report has been compiled in good faith from sources believed to be reliable. However, no representation or warranty, expressed or implied, is made with respect to the completeness or accuracy of its contents and the information is not to be relied upon as authoritative. Anyone considering taking actions based upon the content of this document is urged to base his or her investment decisions upon such investigations as he or she deems necessary. This document is being provided as information only, and no specific actions are being solicited as a result of it; to the extent permitted by law, no liability whatsoever is accepted for any direct or consequential loss arising from use of this document or its contents.
About SEB
SEB is a public company incorporated in Stockholm, Sweden, with limited liability. It is a participant at major Nordic and other European Regulated Markets and Multilateral Trading Facilities (as well as some non-European equivalent markets) for trading in financial instruments, such as markets operated by NASDAQ OMX, NYSE Euronext, London Stock Exchange, Deutsche Börse, Swiss Exchanges, Turquoise and Chi-X. SEB is authorized and regulated by Finansinspektionen in Sweden; it is authorized and subject to limited regulation by the Financial Services Authority for the conduct of designated investment business in the UK, and is subject to the provisions of relevant regulators in all other jurisdictions where SEB conducts operations. SEB Merchant Banking. All rights reserved.
Analys
Tightening fundamentals – bullish inventories from DOE

The latest weekly report from the US DOE showed a substantial drawdown across key petroleum categories, adding more upside potential to the fundamental picture.

Commercial crude inventories (excl. SPR) fell by 5.8 million barrels, bringing total inventories down to 415.1 million barrels. Now sitting 11% below the five-year seasonal norm and placed in the lowest 2015-2022 range (see picture below).
Product inventories also tightened further last week. Gasoline inventories declined by 2.1 million barrels, with reductions seen in both finished gasoline and blending components. Current gasoline levels are about 3% below the five-year average for this time of year.
Among products, the most notable move came in diesel, where inventories dropped by almost 4.1 million barrels, deepening the deficit to around 20% below seasonal norms – continuing to underscore the persistent supply tightness in diesel markets.
The only area of inventory growth was in propane/propylene, which posted a significant 5.1-million-barrel build and now stands 9% above the five-year average.
Total commercial petroleum inventories (crude plus refined products) declined by 4.2 million barrels on the week, reinforcing the overall tightening of US crude and products.


Analys
Bombs to ”ceasefire” in hours – Brent below $70

A classic case of “buy the rumor, sell the news” played out in oil markets, as Brent crude has dropped sharply – down nearly USD 10 per barrel since yesterday evening – following Iran’s retaliatory strike on a U.S. air base in Qatar. The immediate reaction was: “That was it?” The strike followed a carefully calibrated, non-escalatory playbook, avoiding direct threats to energy infrastructure or disruption of shipping through the Strait of Hormuz – thus calming worst-case fears.

After Monday morning’s sharp spike to USD 81.4 per barrel, triggered by the U.S. bombing of Iranian nuclear facilities, oil prices drifted sideways in anticipation of a potential Iranian response. That response came with advance warning and caused limited physical damage. Early this morning, both the U.S. President and Iranian state media announced a ceasefire, effectively placing a lid on the immediate conflict risk – at least for now.
As a result, Brent crude has now fallen by a total of USD 12 from Monday’s peak, currently trading around USD 69 per barrel.
Looking beyond geopolitics, the market will now shift its focus to the upcoming OPEC+ meeting in early July. Saudi Arabia’s decision to increase output earlier this year – despite falling prices – has drawn renewed attention considering recent developments. Some suggest this was a response to U.S. pressure to offset potential Iranian supply losses.
However, consensus is that the move was driven more by internal OPEC+ dynamics. After years of curbing production to support prices, Riyadh had grown frustrated with quota-busting by several members (notably Kazakhstan). With Saudi Arabia cutting up to 2 million barrels per day – roughly 2% of global supply – returns were diminishing, and the risk of losing market share was rising. The production increase is widely seen as an effort to reassert leadership and restore discipline within the group.
That said, the FT recently stated that, the Saudis remain wary of past missteps. In 2018, Riyadh ramped up output at Trump’s request ahead of Iran sanctions, only to see prices collapse when the U.S. granted broad waivers – triggering oversupply. Officials have reportedly made it clear they don’t intend to repeat that mistake.
The recent visit by President Trump to Saudi Arabia, which included agreements on AI, defense, and nuclear cooperation, suggests a broader strategic alignment. This has fueled speculation about a quiet “pump-for-politics” deal behind recent production moves.
Looking ahead, oil prices have now retraced the entire rally sparked by the June 13 Israel–Iran escalation. This retreat provides more political and policy space for both the U.S. and Saudi Arabia. Specifically, it makes it easier for Riyadh to scale back its three recent production hikes of 411,000 barrels each, potentially returning to more moderate increases of 137,000 barrels for August and September.
In short: with no major loss of Iranian supply to the market, OPEC+ – led by Saudi Arabia – no longer needs to compensate for a disruption that hasn’t materialized, especially not to please the U.S. at the cost of its own market strategy. As the Saudis themselves have signaled, they are unlikely to repeat previous mistakes.
Conclusion: With Brent now in the high USD 60s, buying oil looks fundamentally justified. The geopolitical premium has deflated, but tensions between Israel and Iran remain unresolved – and the risk of missteps and renewed escalation still lingers. In fact, even this morning, reports have emerged of renewed missile fire despite the declared “truce.” The path forward may be calmer – but it is far from stable.
Analys
A muted price reaction. Market looks relaxed, but it is still on edge waiting for what Iran will do

Brent crossed the 80-line this morning but quickly fell back assigning limited probability for Iran choosing to close the Strait of Hormuz. Brent traded in a range of USD 70.56 – 79.04/b last week as the market fluctuated between ”Iran wants a deal” and ”US is about to attack Iran”. At the end of the week though, Donald Trump managed to convince markets (and probably also Iran) that he would make a decision within two weeks. I.e. no imminent attack. Previously when when he has talked about ”making a decision within two weeks” he has often ended up doing nothing in the end. The oil market relaxed as a result and the week ended at USD 77.01/b which is just USD 6/b above the year to date average of USD 71/b.

Brent jumped to USD 81.4/b this morning, the highest since mid-January, but then quickly fell back to a current price of USD 78.2/b which is only up 1.5% versus the close on Friday. As such the market is pricing a fairly low probability that Iran will actually close the Strait of Hormuz. Probably because it will hurt Iranian oil exports as well as the global oil market.
It was however all smoke and mirrors. Deception. The US attacked Iran on Saturday. The attack involved 125 warplanes, submarines and surface warships and 14 bunker buster bombs were dropped on Iranian nuclear sites including Fordow, Natanz and Isfahan. In response the Iranian Parliament voted in support of closing the Strait of Hormuz where some 17 mb of crude and products is transported to the global market every day plus significant volumes of LNG. This is however merely an advise to the Supreme leader Ayatollah Ali Khamenei and the Supreme National Security Council which sits with the final and actual decision.
No supply of oil is lost yet. It is about the risk of Iran closing the Strait of Hormuz or not. So far not a single drop of oil supply has been lost to the global market. The price at the moment is all about the assessed risk of loss of supply. Will Iran choose to choke of the Strait of Hormuz or not? That is the big question. It would be painful for US consumers, for Donald Trump’s voter base, for the global economy but also for Iran and its population which relies on oil exports and income from selling oil out of that Strait as well. As such it is not a no-brainer choice for Iran to close the Strait for oil exports. And looking at the il price this morning it is clear that the oil market doesn’t assign a very high probability of it happening. It is however probably well within the capability of Iran to close the Strait off with rockets, mines, air-drones and possibly sea-drones. Just look at how Ukraine has been able to control and damage the Russian Black Sea fleet.
What to do about the highly enriched uranium which has gone missing? While the US and Israel can celebrate their destruction of Iranian nuclear facilities they are also scratching their heads over what to do with the lost Iranian nuclear material. Iran had 408 kg of highly enriched uranium (IAEA). Almost weapons grade. Enough for some 10 nuclear warheads. It seems to have been transported out of Fordow before the attack this weekend.
The market is still on edge. USD 80-something/b seems sensible while we wait. The oil market reaction to this weekend’s events is very muted so far. The market is still on edge awaiting what Iran will do. Because Iran will do something. But what and when? An oil price of 80-something seems like a sensible level until something do happen.
-

 Nyheter4 veckor sedan
Mahvie Minerals växlar spår – satsar fullt ut på guld
-

 Analys4 veckor sedan
A muted price reaction. Market looks relaxed, but it is still on edge waiting for what Iran will do
-

 Nyheter3 veckor sedan
Jonas Lindvall är tillbaka med ett nytt oljebolag, Perthro, som ska börsnoteras
-

 Nyheter3 veckor sedan
Oljan, guldet och marknadens oroande tystnad
-

 Nyheter3 veckor sedan
Domstolen ger klartecken till Lappland Guldprospektering
-

 Analys3 veckor sedan
Tightening fundamentals – bullish inventories from DOE
-

 Nyheter2 veckor sedan
Ryska staten siktar på att konfiskera en av landets största guldproducenter
-

 Nyheter2 veckor sedan
Sommarvädret styr elpriset i Sverige


