Analys
SEB – Råvarukommentarer, 5 november 2012
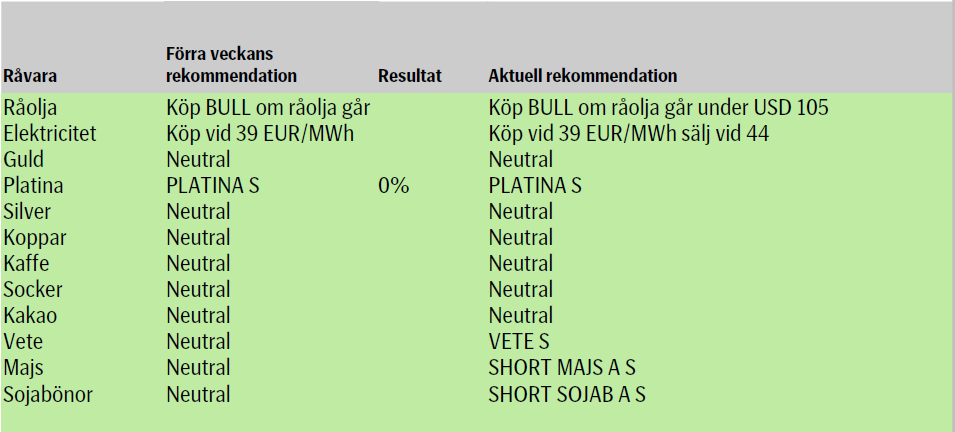
Sammanfattning av rekommendationer
Råolja – Brent
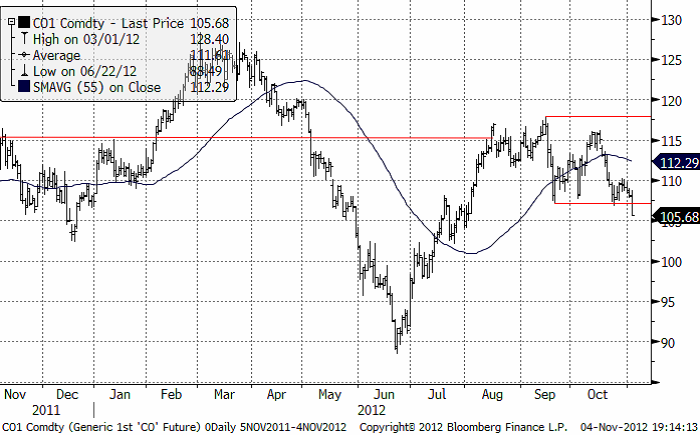
Vi fortsätter rekommendera köp av Bull Olja och Olja S vid nedgång på Brent kring $105/fat. Vi bedömer det som osannolikt att priset på råolja kommer att rasa lägre än så, såvida inte tillväxtprognoserna skrivs ned väsentligt. Vår uppfattning är att oljepriset kommer att fortsätta vara väl understött med tanke på stora geopolitiska risker, strama marknader för oljeprodukter, höga incitamentpriser för att stimulera till tillräckliga investeringar i ny kapacitet och behovet av att producentländer försvarar priser för att balansera budgetar.
Medan balansen på råoljemarknaden förbättrats något är situationen för mellandestillat fortsatt mer ansträngd. Lagren av mellandestillat är historiskt låga och en kallare än normal vinter kan komma försvåra situation ytterligare. Även under normala omständigheter har raffinaderierna problem att producera tillräckligt med mellandestillat under uppvärmningssäsongen. Det gör förråden till en nyckelfaktor för balanseringen av marknaden. Den långsiktiga strukturella balansen för marknaden för mellandestillat är också oroande eftersom det är där vi ser den enda konsumtionstillväxten i Europa.
Det som dominerat nyhetsflödet i veckan är stormen Sandy, vars framfart lett till stor förödelse, både mänskligt och materiellt. Kostnaden för Sandy beräknas nu vara uppe i 50 mdr dollar. Två tredjedelar av raffinaderierna på den amerikanska östkusten, den största oljeledningen, de flesta större hamnar samt vägar och flygplatser stängdes som en följd av Sandy. Efterfrågan minskade därmed på råolja, vilket pressat priset något. Rörelserna har ändå varit begränsade och råoljepriset ganska stabilt mellan 108 och 110 usd. För oljeprodukter, inte minst bensin, har Sandy istället lett till stora uppgångar, eftersom utbudet minskat då raffinaderikapaciteten minskat och människor hamstrat drivmedel.
Iran som är starkt pressat av sanktionerna mot landet har hittills inte gett efter för trycket från omvärlden men Irans försvarsminister uppges nu ha sagt att man inte har några planer på att stänga den vitala farleden genom Hormuzsundet då ”dessa två frågor (stängning av Hormuzsundet och sanktioner mot landet) är helt oberoende och inte relaterade till varandra”.
Vår rekommendation förblir att köpa BULL OLJA X4 S eller OLJA S om priset faller ned mot 105 dollar. På den nivån ser vi goda möjligheter att tjäna pengar.
Elektricitet
Förra veckan sänkte vi vår ingångsnivå för longa positioner till €39/MWh för Q1-2013-kontraktet på Nord Pool. Motivet var att marginalkostnaden för kolkraftproduktion fortsatt falla. Vi rekommenderar att handla kontraktet från köpsidan under november om denna utgångsnivå uppnås. Å andra sidan är €43/MWh till €44/MWh bra utgångspunkter för de som tar risken att handla vinterkontraktet NELFQ3 från säljsidan med BEAR EL X2 S eller med BEAR EL X4 S.
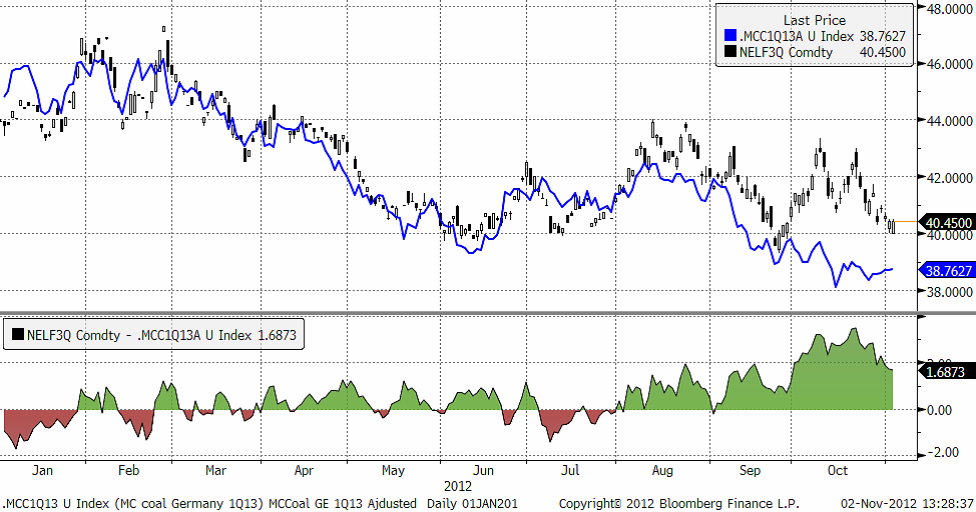
Situationen sedan förra veckan är i stort oförändrad. Det totala hydrologiska överskottet är 10-13 TWh över normalt samtidigt som kärnkraften har god tillgänglighet. Vi har därför länge argumenterat för att differensen mellan NELF3Q och vårt MCCP-index (.MCC1Q13) varit alltför stor. Nu har så en korrigering skett och differensen minskat en del. Q1-2013-kontraktet (NELF3Q) har, i takt med lägre marginalkostnad för kolkraft och fortsatt nederbördsrikt väder, pressats lägre och är senast omsatt på €40,50/MWh. Kontraktet har ändå lite ytterligare fallhöjd och ska, i rådande miljö, närma sig €39/MWh nivån innan vi tycker att kontraktet är köpvärt.
Ska man sammanfatta elmarknaden, så är det att det stora prisfallet tycks vara över. Marknaden handlar ”sidledes” med 44 euro som övre gräns. Nu har vi sänkt den nedre gränsen till 39 euro från 40 euro. I den här typen av marknaden kan man försöka komma in med BULL EL X2 S nära 39 och försöka sälja nära 44 euro. Vice versa att då försöka köpa BEAR EL X4 S.
Guld och Silver
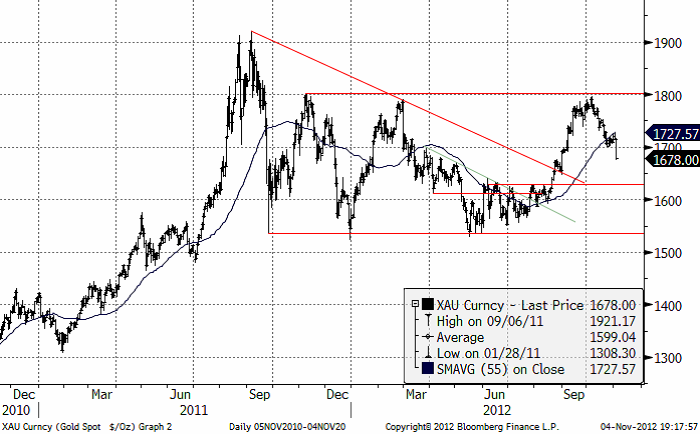
Ädelmetallerna har det jobbigt i nuvarande miljö. Som noterats de senaste två veckorna är statistiken ”för stark”. Fredagens arbetssiffra med påföljande dollarstyrka satte ordentlig press. Spotguld i London föll kraftigt från $1714 ned till $1678. Den mer volatila systermetallen silver föll procentuellt ungefär dubbelt så mycket. Vi håller oss neutrala på ädelmetaller, men det kan vara värt att börja leta köplägen. Tekniskt sett kan det fortsätta ner de närmsta dagarna, med nästa stora stödnivå för guld kring $1650.
Nedan ser vi kursdiagrammet för guld. Notera stödlinjen på 1630 dollar per uns. Om 1650 inte håller, finns nästa stöd på den nivån.
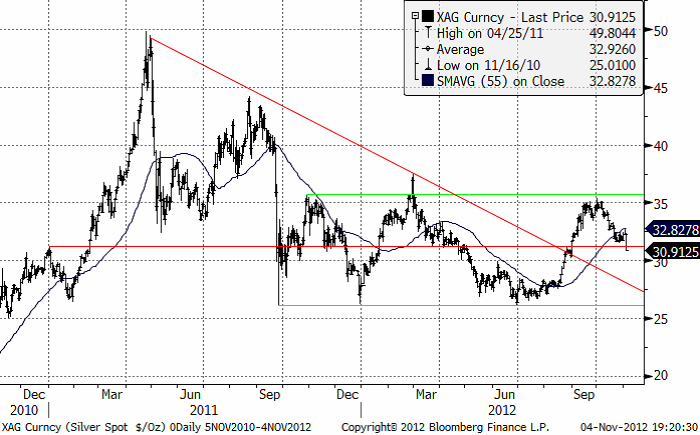
Nedan ser vi kursdiagrammet för silver i dollar per troy ounce. Vi ser att 35 dollar är ett viktigt motstånd och att 30 dollar är ett viktigt stöd. Vi skrev förra veckan att en fortsatt nedgång till 30 dollar skulle vara ett bra köptillfälle. En stopp-loss-order bör då placeras strax under 30 dollar. Detta gäller fortfarande.
Platina
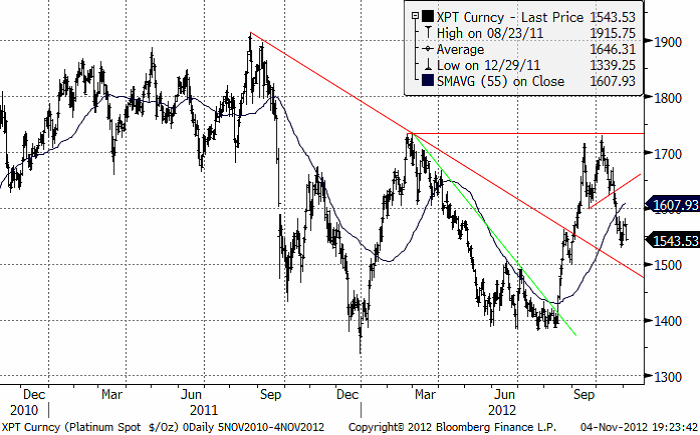
Platina föll ungefär som guldet, dock något mindre strax under 2 %. Situationen i Sydafrika är lugnare, men problemen kvarstår och gruvorna har svårt med lönsamheten. Det allmänna stämningsläget kring både bas- och ädelmetaller är dock inte det bästa just nu. Vi rekommenderar att man försöker komma in på den långa sidan i platina. Risken är dock påtaglig att priset faller ner till 1500 dollar per uns. Det tror vi i så fall är ett bra pris att köpa på.
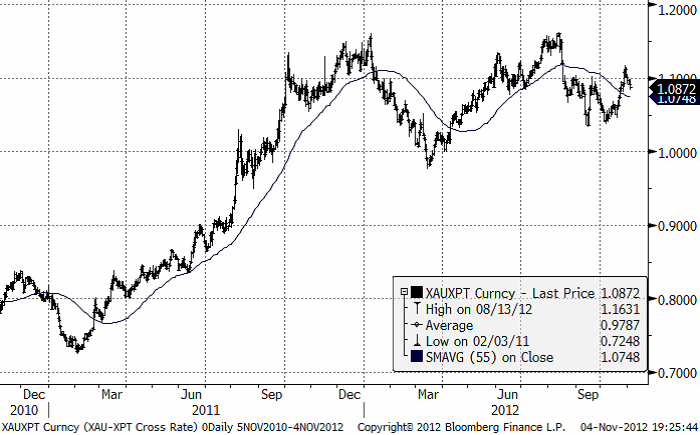
Nedan ser vi priset på guld dividerat med priset på platina. Platina har utvecklats bättre än guld. Det är en tendens vi ”borde” se mer av med tanke på att priset på guld stigit så mycket över den historiska relationen till platina och att platinagruvorna har problem med lönsamheten. Vi anser att detta är ett bra argument för att sälja guld och köpa platina, allt annat lika, eller att köpa platina enbart.
Koppar
Det är lite motsägelsefullt just nu. Fokus ligger på USA där det fortsätter att komma in positiv konjunkturdata, något som naturligtvis borde vara positivt för metallerna. Efterfrågan ökar igen. Problemet är bara att de som investerat i råvaror på basis av fortsatta penningpolitiska åtgärder från centralbanken, blir besvikna (sannolikheten minskar för ytterligare stimulanser i takt med att ekonomin återhämtar sig). Positioner som togs i september likvideras. Förra fredagen redovisades amerikansk BNP-tillväxt starkare än väntat för kvartal 3 på 2 %, jämfört med 1,3 % kvartalet före. Oro för stormen under veckans inledning lade sordin på stämningen och vi fick se ett prisfall på mellan 2 och 3 %. Kina stimulerar via marknadsoperationer vilket fick den korta inhemska räntan att falla kraftigt. Metallpriserna återhämtade i princip hela veckans fall och stod i torsdags oförändrade. På fredagen kom nästa ”kalldusch” med starka siffror. Arbetsmarknadsstatistik kom in mycket bättre än väntat, och på samma tema, d.v.s. minskad sannolikhet för ytterligare stimulanser från FED, så rasade priserna igen. Tendensen varierar mellan basmetallerna. Koppar och nickel tog mest stryk, medan zinken går mot strömmen och är faktiskt upp ett par procent i veckan. Aluminium stänger oförändrad.
Koppar
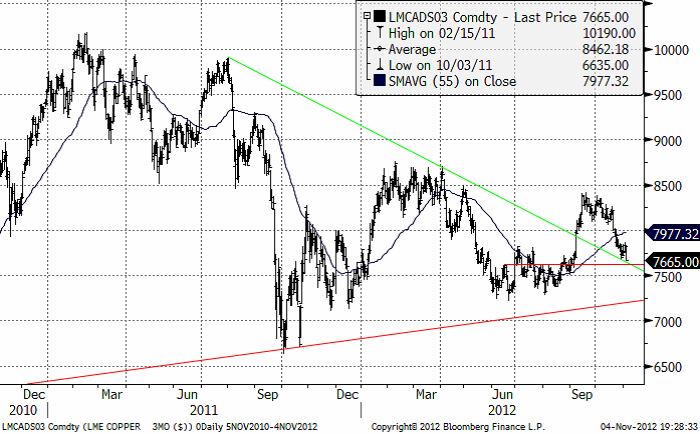
Efter fredagens statistik tappade kopparn 2 % vilket också blir veckans facit. De starkare amerikanska siffrorna stärker dollarn, vilket traditionellt är negativt för dollarnoterade råvaror. Effekten är särskilt tydlig för ädelmetaller, men koppar har svårt att stå emot när dollarrörelsen blir kraftig (EURUSD föll från 1,2930 till 1,2835 under fredagseftermiddagen). LME-lagret har ökat med nästan 10 % de två senaste veckorna. Det ska inte ses som alltför negativt, då det främst är en effekt av terminskurvan, som en tid har varit i s.k. backwardation (terminspriserna är lägre an spot). Detta ”lockar fram” fysisk vara som inte är ämnad för omedelbar konsumtion. Vad som oroar är börslagret i Shanghai, som också ökade under veckan med 1,5 %. Inte så mycket, men det tyder på att Kinas konsumtion inte riktigt vill komma igång. I nuvarande marknadssituation kan det vara värt att avvakta och hålla sig neutral, men vi kvarstår med bedömningen att koppar har en i grunden stark fundamenta med relativt små globala lagernivåer. Minsta tendens till stimulanspaket från Kina så vänder trenden väldigt snabbt. Den tekniska analysen indikerar fortsatt prispress nästa vecka. Vi har $7600 för LME-koppar i sikte som en första ”jämna” stödnivå. Om den nivån bryter får vi inte räkna bort möjligheten för en tillfällig botten ned till $7400.
Som man ser i diagrammet ovan, har mycket handel tidigare skett i ett område kring 7500 dollar. I det området låg handeln mellan maj och början på september. Före det var det ett bottenområde även för perioden september till december. Vi gissar att samma köpintressen som fanns då, nog kommer att finnas kvar även nu i november. Kommer priset ner till 7500 ska man nog anse det vara ett bra köptillfälle. Det man köper då är t ex KOPPAR S.
För spannmål och övriga jordbruksprodukter hänvisas till senaste utgåvan av veckobrevet om jordbruksprodukter.
[box]SEB Veckobrev Veckans råvarukommentar är producerat av SEB Merchant Banking och publiceras i samarbete och med tillstånd på Råvarumarknaden.se[/box]
Disclaimer
The information in this document has been compiled by SEB Merchant Banking, a division within Skandinaviska Enskilda Banken AB (publ) (“SEB”).
Opinions contained in this report represent the bank’s present opinion only and are subject to change without notice. All information contained in this report has been compiled in good faith from sources believed to be reliable. However, no representation or warranty, expressed or implied, is made with respect to the completeness or accuracy of its contents and the information is not to be relied upon as authoritative. Anyone considering taking actions based upon the content of this document is urged to base his or her investment decisions upon such investigations as he or she deems necessary. This document is being provided as information only, and no specific actions are being solicited as a result of it; to the extent permitted by law, no liability whatsoever is accepted for any direct or consequential loss arising from use of this document or its contents.
About SEB
SEB is a public company incorporated in Stockholm, Sweden, with limited liability. It is a participant at major Nordic and other European Regulated Markets and Multilateral Trading Facilities (as well as some non-European equivalent markets) for trading in financial instruments, such as markets operated by NASDAQ OMX, NYSE Euronext, London Stock Exchange, Deutsche Börse, Swiss Exchanges, Turquoise and Chi-X. SEB is authorized and regulated by Finansinspektionen in Sweden; it is authorized and subject to limited regulation by the Financial Services Authority for the conduct of designated investment business in the UK, and is subject to the provisions of relevant regulators in all other jurisdictions where SEB conducts operations. SEB Merchant Banking. All rights reserved.
Analys
More weakness and lower price levels ahead, but the world won’t drown in oil in 2026

Some rebound but not much. Brent crude rebounded 1.5% yesterday to $65.47/b. This morning it is inching 0.2% up to $65.6/b. The lowest close last week was on Thursday at $64.11/b.

The curve structure is almost as week as it was before the weekend. The rebound we now have gotten post the message from OPEC+ over the weekend is to a large degree a rebound along the curve rather than much strengthening at the front-end of the curve. That part of the curve structure is almost as weak as it was last Thursday.
We are still on a weakening path. The message from OPEC+ over the weekend was we are still on a weakening path with rising supply from the group. It is just not as rapidly weakening as was feared ahead of the weekend when a quota hike of 500 kb/d/mth for November was discussed.
The Brent curve is on its way to full contango with Brent dipping into the $50ies/b. Thus the ongoing weakening we have had in the crude curve since the start of the year, and especially since early June, will continue until the Brent crude oil forward curve is in full contango along with visibly rising US and OECD oil inventories. The front-month Brent contract will then flip down towards the $60/b-line and below into the $50ies/b.
At what point will OPEC+ turn to cuts? The big question then becomes: When will OPEC+ turn around to make some cuts? At what (price) point will they choose to stabilize the market? Because for sure they will. Higher oil inventories, some more shedding of drilling rigs in US shale and Brent into the 50ies somewhere is probably where the group will step in.
There is nothing we have seen from the group so far which indicates that they will close their eyes, let the world drown in oil and the oil price crash to $40/b or below.
The message from OPEC+ is also about balance and stability. The world won’t drown in oil in 2026. The message from the group as far as we manage to interpret it is twofold: 1) Taking back market share which requires a lower price for non-OPEC+ to back off a bit, and 2) Oil market stability and balance. It is not just about 1. Thus fretting about how we are all going to drown in oil in 2026 is totally off the mark by just focusing on point 1.
When to buy cal 2026? Before Christmas when Brent hits $55/b and before OPEC+ holds its last meeting of the year which is likely to be in early December.
Brent crude oil prices have rebounded a bit along the forward curve. Not much strengthening in the structure of the curve. The front-end backwardation is not much stronger today than on its weakest level so far this year which was on Thursday last week.

The front-end backwardation fell to its weakest level so far this year on Thursday last week. A slight pickup yesterday and today, but still very close to the weakest year to date. More oil from OPEC+ in the coming months and softer demand and rising inventories. We are heading for yet softer levels.

Analys
A sharp weakening at the core of the oil market: The Dubai curve

Down to the lowest since early May. Brent crude has fallen sharply the latest four days. It closed at USD 64.11/b yesterday which is the lowest since early May. It is staging a 1.3% rebound this morning along with gains in both equities and industrial metals with an added touch of support from a softer USD on top.

What stands out the most to us this week is the collapse in the Dubai one to three months time-spread.
Dubai is medium sour crude. OPEC+ is in general medium sour crude production. Asian refineries are predominantly designed to process medium sour crude. So Dubai is the real measure of the balance between OPEC+ holding back or not versus Asian oil demand for consumption and stock building.
A sharp weakening of the front-end of the Dubai curve. The front-end of the Dubai crude curve has been holding out very solidly throughout this summer while the front-end of the Brent and WTI curves have been steadily softening. But the strength in the Dubai curve in our view was carrying the crude oil market in general. A source of strength in the crude oil market. The core of the strength.
The now finally sharp decline of the front-end of the Dubai crude curve is thus a strong shift. Weakness in the Dubai crude marker is weakness in the core of the oil market. The core which has helped to hold the oil market elevated.
Facts supports the weakening. Add in facts of Iraq lifting production from Kurdistan through Turkey. Saudi Arabia lifting production to 10 mb/d in September (normal production level) and lifting exports as well as domestic demand for oil for power for air con is fading along with summer heat. Add also in counter seasonal rise in US crude and product stocks last week. US oil stocks usually decline by 1.3 mb/week this time of year. Last week they instead rose 6.4 mb/week (+7.2 mb if including SPR). Total US commercial oil stocks are now only 2.1 mb below the 2015-19 seasonal average. US oil stocks normally decline from now to Christmas. If they instead continue to rise, then it will be strongly counter seasonal rise and will create a very strong bearish pressure on oil prices.
Will OPEC+ lift its voluntary quotas by zero, 137 kb/d, 500 kb/d or 1.5 mb/d? On Sunday of course OPEC+ will decide on how much to unwind of the remaining 1.5 mb/d of voluntary quotas for November. Will it be 137 kb/d yet again as for October? Will it be 500 kb/d as was talked about earlier this week? Or will it be a full unwind in one go of 1.5 mb/d? We think most likely now it will be at least 500 kb/d and possibly a full unwind. We discussed this in a not earlier this week: ”500 kb/d of voluntary quotas in October. But a full unwind of 1.5 mb/d”
The strength in the front-end of the Dubai curve held out through summer while Brent and WTI curve structures weakened steadily. That core strength helped to keep flat crude oil prices elevated close to the 70-line. Now also the Dubai curve has given in.

Brent crude oil forward curves

Total US commercial stocks now close to normal. Counter seasonal rise last week. Rest of year?

Total US crude and product stocks on a steady trend higher.

Analys
OPEC+ will likely unwind 500 kb/d of voluntary quotas in October. But a full unwind of 1.5 mb/d in one go could be in the cards

Down to mid-60ies as Iraq lifts production while Saudi may be tired of voluntary cut frugality. The Brent December contract dropped 1.6% yesterday to USD 66.03/b. This morning it is down another 0.3% to USD 65.8/b. The drop in the price came on the back of the combined news that Iraq has resumed 190 kb/d of production in Kurdistan with exports through Turkey while OPEC+ delegates send signals that the group will unwind the remaining 1.65 mb/d (less the 137 kb/d in October) of voluntary cuts at a pace of 500 kb/d per month pace.

Signals of accelerated unwind and Iraqi increase may be connected. Russia, Kazakhstan and Iraq were main offenders versus the voluntary quotas they had agreed to follow. Russia had a production ’debt’ (cumulative overproduction versus quota) of close to 90 mb in March this year while Kazakhstan had a ’debt’ of about 60 mb and the same for Iraq. This apparently made Saudi Arabia angry this spring. Why should Saudi Arabia hold back if the other voluntary cutters were just freeriding? Thus the sudden rapid unwinding of voluntary cuts. That is at least one angle of explanations for the accelerated unwinding.
If the offenders with production debts then refrained from lifting production as the voluntary cuts were rapidly unwinded, then they could ’pay back’ their ’debts’ as they would under-produce versus the new and steadily higher quotas.
Forget about Kazakhstan. Its production was just too far above the quotas with no hope that the country would hold back production due to cross-ownership of oil assets by international oil companies. But Russia and Iraq should be able to do it.
Iraqi cumulative overproduction versus quotas could reach 85-90 mb in October. Iraq has however steadily continued to overproduce by 3-5 mb per month. In July its new and gradually higher quota came close to equal with a cumulative overproduction of only 0.6 mb that month. In August again however its production had an overshoot of 100 kb/d or 3.1 mb for the month. Its cumulative production debt had then risen to close to 80 mb. We don’t know for September yet. But looking at October we now know that its production will likely average close to 4.5 mb/d due to the revival of 190 kb/d of production in Kurdistan. Its quota however will only be 4.24 mb/d. Its overproduction in October will thus likely be around 250 kb/d above its quota with its production debt rising another 7-8 mb to a total of close to 90 mb.
Again, why should Saudi Arabia be frugal while Iraq is freeriding. Better to get rid of the voluntary quotas as quickly as possible and then start all over with clean sheets.
Unwinding the remaining 1.513 mb/d in one go in October? If OPEC+ unwinds the remaining 1.513 mb/d of voluntary cuts in one big go in October, then Iraq’s quota will be around 4.4 mb/d for October versus its likely production of close to 4.5 mb/d for the coming month..
OPEC+ should thus unwind the remaining 1.513 mb/d (1.65 – 0.137 mb/d) in one go for October in order for the quota of Iraq to be able to keep track with Iraq’s actual production increase.
October 5 will show how it plays out. But a quota unwind of at least 500 kb/d for Oct seems likely. An overall increase of at least 500 kb/d in the voluntary quota for October looks likely. But it could be the whole 1.513 mb/d in one go. If the increase in the quota is ’only’ 500 kb/d then Iraqi cumulative production will still rise by 5.7 mb to a total of 85 mb in October.
Iraqi production debt versus quotas will likely rise by 5.7 mb in October if OPEC+ only lifts the overall quota by 500 kb/d in October. Here assuming historical production debt did not rise in September. That Iraq lifts its production by 190 kb/d in October to 4.47 mb/d (August level + 190 kb/d) and that OPEC+ unwinds 500 kb/d of the remining quotas in October when they decide on this on 5 October.

-

 Nyheter4 veckor sedan
Mahvie Minerals i en guldtrend
-

 Analys4 veckor sedan
Volatile but going nowhere. Brent crude circles USD 66 as market weighs surplus vs risk
-
 Nyheter4 veckor sedan
Aktier i guldbolag laggar priset på guld
-

 Nyheter3 veckor sedan
Kinas elproduktion slog nytt rekord i augusti, vilket även kolkraft gjorde
-

 Nyheter3 veckor sedan
Tyskland har så höga elpriser att företag inte har råd att använda elektricitet
-
 Nyheter4 veckor sedan
Guld når sin högsta nivå någonsin, nu även justerat för inflation
-
 Nyheter4 veckor sedan
Det stigande guldpriset en utmaning för smyckesköpare
-

 Analys4 veckor sedan
Waiting for the surplus while we worry about Israel and Qatar


