

Analys
SEB – Råvarukommentarer, 24 februari 2015

Kinesiska nyåret innebär get, resor och volatilitet
MARKNADEN I KORTHET
 Ingen kan beskylla den senaste tidens ekonomiska landskap för att vara tråkigt. Varje vecka sker nya händelser och nya akter i gamla dramer tar vid där de gamla slutar. Medan danska centralbanken med näbbar och klor ser till att upprätthålla sin valutapeg mot euron, så försöker Greklands finansminister Varoufakis och representanter från EU-kommissionen, ECB och IMF hitta en hållbar lösning som gör att landet kan vara kvar i EMU och som gör alla inblandade parter åtminstone inte alltför missnöjda. Förra veckan konstaterade vi också att guldet, trots oro relaterad till situationen med Grekland, fortsatte att sjunka och vi stänger i enlighet vad vi skrev förra veckan vår Bear-position i guld som också visade sig ha en liten uppsida under rekommendationsperioden. Samtidigt fortsätter krisen i Ukraina, varför Ryssland hotas av utökade sanktioner. Oljelagren växer globalt trots att antalet amerikanska oljeriggar i bruk blir färre; om än att de blir färre i lägre hastighet än tidigare.
När vi nu är mitt uppe i det kinesiska nyårsfirandet, där nästan två miljoner människor enligt CNN beräknas lämna bara Peking för att resa hem och fira getens år – antalet individuella resor i Kina under det 40 dagar långa nyårsfirandet beräknas totalt till 3,7 miljarder stycken – sjunker efterfrågan också på råvaror generellt, liksom att likviditeten i marknaden blir sämre. Vi skriver också en del om detta nedan.
Sammantaget bjuder råvarumarknaden fortsatt många utmaningar men lika många möjligheter och vi redogör nedan för vad vi anser vara mest intressant just. På grund av att sportlovs- och influensatider tråkigt nog har råkat sammanfalla, blir denna veckas nyhetsbrev något kortare till sitt omfång.
TRENDER I SAMMANDRAG
- Geopolitisk oro fortsatt tema
- Kinesiska nyåret bidrar till sämre likviditet och lägre efterfrågan i råvarumarknaden
- Antalet amerikanska oljeriggar fortsätter att minska, men i lägre hastighet
- Lagerbyggnaden avseende olja fortsätter och priset på brentolja kommer att pressas ned till 50 US-dollar per fat
- Fundamental balans för zink och aluminium kommer att förbättras under året
REKOMMENDATIONER
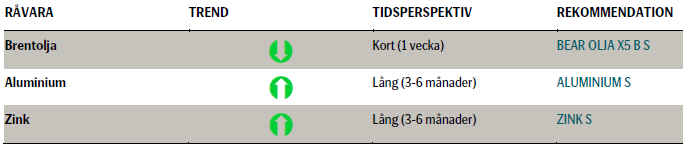
BRENTOLJA
 Under veckan som gick föll Brentoljan med 2,1 procent och bröt därigenom de senaste tre veckornas prisrally. I början av denna vecka har pressen på nedsidan fortsatt och Brentoljan har handlat strax under 60 US-dollar per fat och ibland nedåt 58 US-dollar per fat. Antalet oljeriggar i USA har fortsatt att falla, men under de senaste två veckorna i en lägre hastighet än tidigare. Samtidigt fortsätter amerikansk råoljeproduktion att öka, liksom att lagerbyggnaden fortsätter.
Meddelanden om att en olje-pipeline i Libyen nu har reparerats adderade till att oljepriset sjönk. Om Libyen kommer tillbaka till marknaden skulle det verkligen innebära ett tryck nedåt på priset för råolja. Vi förväntar oss dock inte att Libyen stabilt kommer att leverera olja till marknaden inom den närmaste tiden.
TREND
- Vi förväntar oss en fortsatt lagerbyggnad av olja och att detta kommer att trycka ned oljepriset mot en nivå om 50 US-dollar per fat
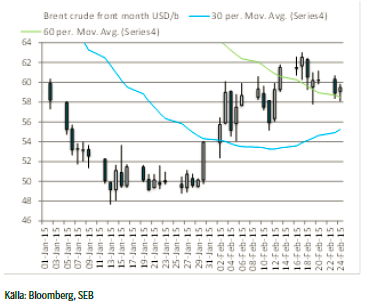
- Brentoljan behöver fortfarande bryta sitt 60-dagars glidande medelvärde innan det kan accelerera nedåt mot nivån om 50 US-dollar per fat
REKOMMENDATION
- Vi tror att fundamentala faktorer är bearish med en produktion högre än efterfrågan. Därför tror vi att en kort position nu kommer att ha den högsta avkastningen den närmaste veckan. Vi rekommenderar exempelvis BEAR OLJA X5 B S, eller något av certifikaten med lägre hävstång för den som vill ha lägre risk.
Brentoljan håller sig fortfarande över sitt 60-dagars glidande medelvärde
BASMETALLER
 Veckan som gick karaktäriserades av både låg aktivitet och likviditet i samband med det kinesiska nyårsfirandet (18-24 februari). Också som befarat innebar det överlag fallande priser. Som vi nämnt de senaste veckorna brukar perioden före och i samband med det kinesiska nyåret innebära lägre industriell aktivitet, men erfarenhetsmässigt tar det därefter fart. Med vår underliggande positiva tro på metallerna, och i synnerhet aluminium och zink, bör den närmaste veckan innebära bra köptillfällen.
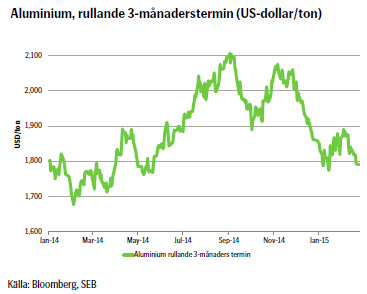
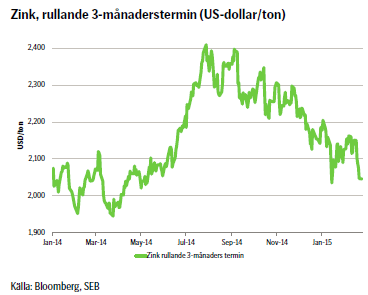 Den svagare prisutvecklingen har dämpats något av en starkare dollar. Icke desto mindre föll priserna räknat i kronor relativt kraftigt i veckan: cirka 1,8 procent för aluminium respektive cirka 4 procent för zink. Ur ett tekniskt perspektiv har zinkpriset fallit till stödnivån 2050 US-dollar per ton. Aluminium har i skrivande stund brutit genom och är under stödet vid 1800 US-dollar per ton, vilket öppnar upp för en ytterligare potentiell nedgång mot ca 1750 US-dollar per ton. Vår rekommendation på metallerna är på tre till sex månaders sikt, och vi begränsar oss till certifikat utan hävstång.
TREND
- I takt med att den fundamentala balansen förbättras bedöms priserna på aluminium och zink succesivt stärkas under året
- Flera gruvstängningar i år och nästa, kommer inte fullt ut att ersättas. Risk för brist 2016 (zink)
- Efterfrågan på aluminium har ökat 4-7 procent de senaste tre till fyra åren, vilket är en trend som förväntas fortsätta
- Terminskurvorna på båda metallerna är attraktiva. Terminspremien (contangon) är endast ca 2 procent sett tolv månader framåt.
- Bra köpläge nu efter det Kinesiska nyåret.
REKOMMENDATION
- Zink S
- Aluminium S
Notera att rekommendationerna i enlighet med vad som är beskrivet ovan är på längre sikt; tre till sex månader.
[box]SEB Veckobrev Veckans råvarukommentar är producerat av SEB:s Commodities Sales desk och publiceras i samarbete och med tillstånd på Råvarumarknaden.se[/box]
Disclaimer
Detta marknadsföringsmaterial, framtaget av SEB:s Commodities Sales desk, har upprättats enbart i informationssyfte.
Även om innehållet är baserat på källor som SEB bedömt som tillförlitliga ansvarar SEB inte för fel eller brister i informationen. Den utgör inte oberoende, objektiv investeringsanalys och skyddas därför inte av de bestämmelser som SEB har infört för att förebygga potentiella intressekonflikter. Yttranden från SEB:s Commodities Sales desk kan vara oförenliga med tidigare publicerat material från SEB, då den senare hänvisas uppmanas du att läsa den fullständiga rapporten innan någon åtgärd vidtas.
Dokumentationen utgör inte någon investeringsrådgivning och tillhandahålls till dig utan hänsyn till dina investeringsmål. Du uppmanas att självständigt bedöma och komplettera uppgifterna i denna dokumentation och att basera dina investeringsbeslut på material som bedöms erforderligt. Alla framåtblickande uttalanden, åsikter och förväntningar är föremål för risker, osäkerheter och andra faktorer och kan orsaka att det faktiska resultatet avviker väsentligt från det förväntade. Historisk avkastning är ingen garanti för framtida resultat. Detta dokument utgör inte ett erbjudande att teckna några värdepapper eller andra finansiella instrument. SEB svarar inte för förlust eller skada – direkt eller indirekt, eller av vad slag det vara må – som kan uppkomma till följd av användandet av detta material eller dess innehåll.
Observera att det kan förekomma att SEB, dess ledamöter, dess anställda eller dess moder- och/eller dotterbolag vid olika tillfällen innehar, har innehaft eller kommer att inneha aktier, positioner, rådgivningsuppdrag i samband med corporate finance-transaktioner, investment- eller merchantbanking-uppdrag och/eller lån i de bolag/finansiella instrument som nämns i materialet.
Materialet är avsett för mottagaren, all spridning, distribuering mångfaldigande eller annan användning av detta meddelande får inte ske utan SEB:s medgivande.
Oaktat detta får SEB tillåta omfördelning av materialet till utvald tredje part i enlighet med gällande avtal. Materialet får inte spridas till fysiska eller juridiska personer som är medborgare eller har hemvist i ett land där sådan spridning är otillåten enligt tillämplig lag eller annan bestämmelse.
Skandinaviska Enskilda Banken AB (publ) är ett publikt aktiebolag och står under tillsyn av Finansinspektionen samt de lokala finansiella tillsynsmyndigheter i varje jurisdiktionen där SEB har filial eller dotterbolag.
Villkor
För varje enskilt certifikat finns Slutliga Villkor som anger de fullständiga villkoren. Slutliga Villkor finns tillgängligt på kurssidan för respektive certifikat på www.seb.se, Börs & finans, fliken Strukturerade placeringar.
Risker
En sammanfattning av de risker som är förknippade med Börshandlade certifikat generellt finns i Produktbroschyren för respektive certifikat som är tillgängligt på www.seb.se/cert. För en fullständig bild av riskerna behöver du ta del av SEB:s offentliggjorda Grundprospekt för Certifikat- och Warrantprogram som är publicerat på www.seb.se/cert.


The latest weekly report from the US DOE showed a substantial drawdown across key petroleum categories, adding more upside potential to the fundamental picture.

Commercial crude inventories (excl. SPR) fell by 5.8 million barrels, bringing total inventories down to 415.1 million barrels. Now sitting 11% below the five-year seasonal norm and placed in the lowest 2015-2022 range (see picture below).
Product inventories also tightened further last week. Gasoline inventories declined by 2.1 million barrels, with reductions seen in both finished gasoline and blending components. Current gasoline levels are about 3% below the five-year average for this time of year.
Among products, the most notable move came in diesel, where inventories dropped by almost 4.1 million barrels, deepening the deficit to around 20% below seasonal norms – continuing to underscore the persistent supply tightness in diesel markets.
The only area of inventory growth was in propane/propylene, which posted a significant 5.1-million-barrel build and now stands 9% above the five-year average.
Total commercial petroleum inventories (crude plus refined products) declined by 4.2 million barrels on the week, reinforcing the overall tightening of US crude and products.


A classic case of “buy the rumor, sell the news” played out in oil markets, as Brent crude has dropped sharply – down nearly USD 10 per barrel since yesterday evening – following Iran’s retaliatory strike on a U.S. air base in Qatar. The immediate reaction was: “That was it?” The strike followed a carefully calibrated, non-escalatory playbook, avoiding direct threats to energy infrastructure or disruption of shipping through the Strait of Hormuz – thus calming worst-case fears.
After Monday morning’s sharp spike to USD 81.4 per barrel, triggered by the U.S. bombing of Iranian nuclear facilities, oil prices drifted sideways in anticipation of a potential Iranian response. That response came with advance warning and caused limited physical damage. Early this morning, both the U.S. President and Iranian state media announced a ceasefire, effectively placing a lid on the immediate conflict risk – at least for now.
As a result, Brent crude has now fallen by a total of USD 12 from Monday’s peak, currently trading around USD 69 per barrel.
Looking beyond geopolitics, the market will now shift its focus to the upcoming OPEC+ meeting in early July. Saudi Arabia’s decision to increase output earlier this year – despite falling prices – has drawn renewed attention considering recent developments. Some suggest this was a response to U.S. pressure to offset potential Iranian supply losses.
However, consensus is that the move was driven more by internal OPEC+ dynamics. After years of curbing production to support prices, Riyadh had grown frustrated with quota-busting by several members (notably Kazakhstan). With Saudi Arabia cutting up to 2 million barrels per day – roughly 2% of global supply – returns were diminishing, and the risk of losing market share was rising. The production increase is widely seen as an effort to reassert leadership and restore discipline within the group.
That said, the FT recently stated that, the Saudis remain wary of past missteps. In 2018, Riyadh ramped up output at Trump’s request ahead of Iran sanctions, only to see prices collapse when the U.S. granted broad waivers – triggering oversupply. Officials have reportedly made it clear they don’t intend to repeat that mistake.
The recent visit by President Trump to Saudi Arabia, which included agreements on AI, defense, and nuclear cooperation, suggests a broader strategic alignment. This has fueled speculation about a quiet “pump-for-politics” deal behind recent production moves.
Looking ahead, oil prices have now retraced the entire rally sparked by the June 13 Israel–Iran escalation. This retreat provides more political and policy space for both the U.S. and Saudi Arabia. Specifically, it makes it easier for Riyadh to scale back its three recent production hikes of 411,000 barrels each, potentially returning to more moderate increases of 137,000 barrels for August and September.
In short: with no major loss of Iranian supply to the market, OPEC+ – led by Saudi Arabia – no longer needs to compensate for a disruption that hasn’t materialized, especially not to please the U.S. at the cost of its own market strategy. As the Saudis themselves have signaled, they are unlikely to repeat previous mistakes.
Conclusion: With Brent now in the high USD 60s, buying oil looks fundamentally justified. The geopolitical premium has deflated, but tensions between Israel and Iran remain unresolved – and the risk of missteps and renewed escalation still lingers. In fact, even this morning, reports have emerged of renewed missile fire despite the declared “truce.” The path forward may be calmer – but it is far from stable.
Analys
A muted price reaction. Market looks relaxed, but it is still on edge waiting for what Iran will do
Brent crossed the 80-line this morning but quickly fell back assigning limited probability for Iran choosing to close the Strait of Hormuz. Brent traded in a range of USD 70.56 – 79.04/b last week as the market fluctuated between ”Iran wants a deal” and ”US is about to attack Iran”. At the end of the week though, Donald Trump managed to convince markets (and probably also Iran) that he would make a decision within two weeks. I.e. no imminent attack. Previously when when he has talked about ”making a decision within two weeks” he has often ended up doing nothing in the end. The oil market relaxed as a result and the week ended at USD 77.01/b which is just USD 6/b above the year to date average of USD 71/b.

Brent jumped to USD 81.4/b this morning, the highest since mid-January, but then quickly fell back to a current price of USD 78.2/b which is only up 1.5% versus the close on Friday. As such the market is pricing a fairly low probability that Iran will actually close the Strait of Hormuz. Probably because it will hurt Iranian oil exports as well as the global oil market.
It was however all smoke and mirrors. Deception. The US attacked Iran on Saturday. The attack involved 125 warplanes, submarines and surface warships and 14 bunker buster bombs were dropped on Iranian nuclear sites including Fordow, Natanz and Isfahan. In response the Iranian Parliament voted in support of closing the Strait of Hormuz where some 17 mb of crude and products is transported to the global market every day plus significant volumes of LNG. This is however merely an advise to the Supreme leader Ayatollah Ali Khamenei and the Supreme National Security Council which sits with the final and actual decision.
No supply of oil is lost yet. It is about the risk of Iran closing the Strait of Hormuz or not. So far not a single drop of oil supply has been lost to the global market. The price at the moment is all about the assessed risk of loss of supply. Will Iran choose to choke of the Strait of Hormuz or not? That is the big question. It would be painful for US consumers, for Donald Trump’s voter base, for the global economy but also for Iran and its population which relies on oil exports and income from selling oil out of that Strait as well. As such it is not a no-brainer choice for Iran to close the Strait for oil exports. And looking at the il price this morning it is clear that the oil market doesn’t assign a very high probability of it happening. It is however probably well within the capability of Iran to close the Strait off with rockets, mines, air-drones and possibly sea-drones. Just look at how Ukraine has been able to control and damage the Russian Black Sea fleet.
What to do about the highly enriched uranium which has gone missing? While the US and Israel can celebrate their destruction of Iranian nuclear facilities they are also scratching their heads over what to do with the lost Iranian nuclear material. Iran had 408 kg of highly enriched uranium (IAEA). Almost weapons grade. Enough for some 10 nuclear warheads. It seems to have been transported out of Fordow before the attack this weekend.
The market is still on edge. USD 80-something/b seems sensible while we wait. The oil market reaction to this weekend’s events is very muted so far. The market is still on edge awaiting what Iran will do. Because Iran will do something. But what and when? An oil price of 80-something seems like a sensible level until something do happen.


USA ska införa 50 procent tull på koppar

Ryska staten siktar på att konfiskera en av landets största guldproducenter

Hur säkrar vi Sveriges tillgång till kritiska metaller och mineral i en ny geopolitisk verklighet?

Lundin Mining ska bli en av de tio största kopparproducenterna i världen

Sommarvädret styr elpriset i Sverige

Uppgången i oljepriset planade ut under helgen

Mahvie Minerals växlar spår – satsar fullt ut på guld

Låga elpriser i sommar – men mellersta Sverige får en ökning

Oljan, guldet och marknadens oroande tystnad

Jonas Lindvall är tillbaka med ett nytt oljebolag, Perthro, som ska börsnoteras
-
 Nyheter4 veckor sedan
Uppgången i oljepriset planade ut under helgen
-
 Nyheter3 veckor sedan
Mahvie Minerals växlar spår – satsar fullt ut på guld
-
 Nyheter4 veckor sedan
Låga elpriser i sommar – men mellersta Sverige får en ökning
-
 Nyheter2 veckor sedan
Oljan, guldet och marknadens oroande tystnad
-
 Nyheter2 veckor sedan
Jonas Lindvall är tillbaka med ett nytt oljebolag, Perthro, som ska börsnoteras
-
Analys4 veckor sedan
Very relaxed at USD 75/b. Risk barometer will likely fluctuate to higher levels with Brent into the 80ies or higher coming 2-3 weeks
-
Analys3 veckor sedan
A muted price reaction. Market looks relaxed, but it is still on edge waiting for what Iran will do
-

 Nyheter2 veckor sedan
Domstolen ger klartecken till Lappland Guldprospektering