

Analys
SEB – Råvarukommentarer, 17 februari 2015

Geopolitisk oro och negativa räntor
MARKNADEN I KORTHET
 Veckan som gick präglades i mångt och mycket av makrohändelser och data. Riksbanken sänkte som bekant reporäntan till historiskt låga -0,10 procent och som en följd försvagades kronan ytterligare, statslåneräntor gick ned liksom Stibor, interbankräntan, som antog ett negativt värde. Utvecklingen i Ukraina är också i fokus. Vapenvilan som förhandlades fram i Minsk i torsdags av ledarna för Ukraina, Ryssland, Frankrike och Tyskland mottogs naturligtvis positivt och fick metallpriserna att stiga, men den visade sig vara skör – redan efter några timmar kom rapporter om raketbeskjutningar och det rapporterades om fortsatta strider på söndagen. Ryssland, som fortfarande hävdar att man inte stöder separatisterna, kan drabbas av utökade sanktioner om inte avtalet från Minsk respekteras. Ökad volatilitet är ett sannolikt resultat för råvarumarknaden av att situationen böljar fram och tillbaka och vi skriver om implikationerna både i avsnitten om metaller och sojabönor.
Situationen i Grekland, med diskussioner som också går fram och tillbaka med trojkan, är också ett ämne för oro. Varje gång en förhandling tar en negativ vändning börjar marknaden fundera på sannolikheten för ett Grexit och implikationerna inte minst för guldet är påtagliga. Mot bakgrund av vad vi konstaterar ovan justeras också en del av våra rekommendationer – läs mer i respektive avsnitt!
TRENDER I SAMMANDRAG
- Räntor strävar nedåt
- Geopolitisk oro skapar volatilitet
- Zinklager stora, men minskar snabbt
- Global produktion av vete rekordhög och justeras upp
REKOMMENDATIONER
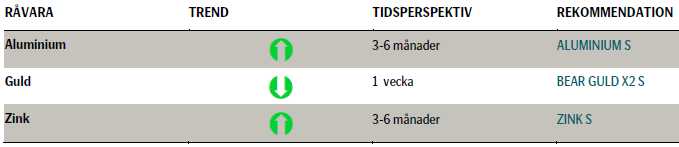
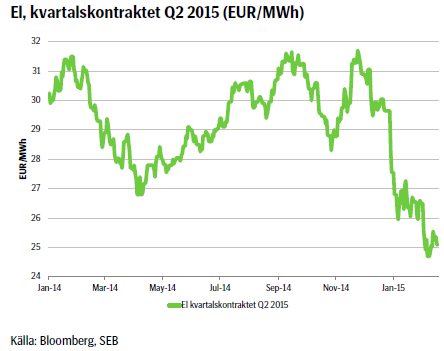
ZINK
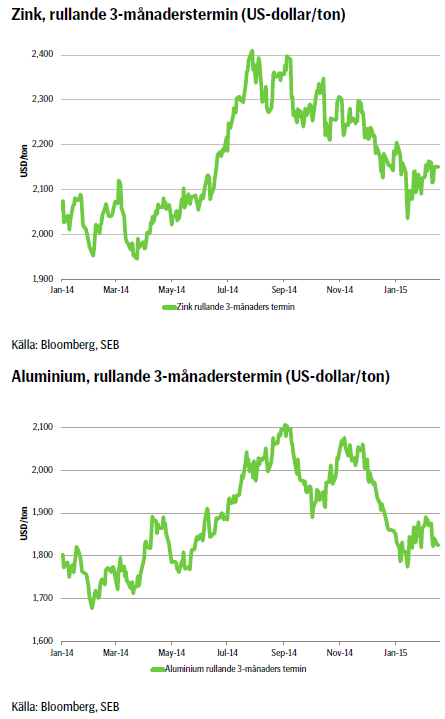 Stämningsläget på metallmarknaden följde i stort sett övriga finansiella marknader under förra veckan. Ukraina och Grekland var i fokus. Miljön med låg inflation är naturligtvis i fokus (något som vi inte minst i Sverige får känna av med en negativ reporänta). Men det är inte bara i vår del av världen som man oroas av den alltför låga inflationen. Kinas KPI kom in lägre än väntat i förra veckan (lägsta på fem år) vilket påminner marknaden om den avmattning som sker i den kinesiska ekonomin. Svaga Kina-siffror har tidigare stärkt metallpriserna på förväntan om ytterligare penningpolitiska stimulanser. Men så blev inte fallet under förra veckan, som inleddes med svaga priser. Vapenvila i Ukraina och positiva signaler från förhandlingarna om Grekland vände stämningsläget åt det positiva hållet mot slutet av veckan, vilket också fick metallpriserna att stiga. Sett över hela veckan slutade dock metallerna överlag marginellt på minus. I veckans brev lyfter vi fram zink som en alternativ köpkandidat vid sidan av aluminium (köpvärd på 3-6 månaders sikt). Den fundamentala situationen för zink påminner om den för aluminium. Lagren är stora, men minskar i snabb takt just nu. Marknader noterade redan under förra året ett underskott, något som förväntas förstärkas under innevarande år. Flera stora gruvor som är uttjänta kommer att stänga i år och under de närmaste åren. I fokus är bl.a. den gigantiska Century-gruvan i Australien. Bortfallet förväntas ersättas av nya gruvor som dock i regel är små vilket gör marknaden mer fragmenterad. Marknaden befarar även att det nya utbudet knappast fullt ut kommer att kunna ersätta bortfallet. Det finns en överhängande risk för brist på zink, om inte i år, så sannolikt nästa år. Frågan är när markandens aktörer börjar diskontera detta. Vi bedömer att detta redan kommer att ske under kv1/kv2 i år. Zink är köpvärd på 3-6 månaders sikt. På lång sikt är prispotentialen mycket stor. För 2015 prognostiserar SEB ett genomsnittligt pris på 2280 US-dollar/ton, och för 2016 2500 US-dollar/ton att jämföra med dagens 2150 US-dollar.
TREND
- I takt med att den fundamentala balansen förbättras bedöms priset successivt stärkas under året.
- Flera gruvstängningar i år och nästa, kommer inte fullt ut att ersättas. Risk för brist 2016.
- Terminskurvan är ovanligt ”billig”, dvs terminspremien (contangon) är endast 1,5 % sett 12 månader framåt.
- Attraktivt tillfälle för investerare att få exponering mot zink.
- Avvaktande inför det kinesiska nyåret.
REKOMMENDATION
- Köp ZINK S och ALUMINIUM S
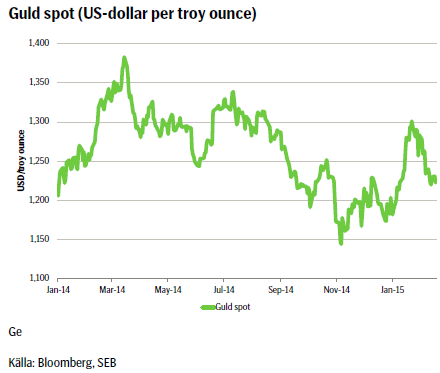
NORDISK EL
 Sedan senaste elkommentaren (två veckor sedan) har marknaden fallit ytterligare. Större delen av fallet var i början av perioden, därefter har det egentligen mest varit sidledes. I stort är fundamental input oförändrad. Spotpriset följer temperaturen och ”svarar” bra med stigande pris så snart temperaturen faller nedåt. Någon långvarig vinterkyla syns däremot inte i prognoserna och för varje dag som passerar minskar risken för ”price spikes”. Den korta änden av kurvan är fortsatt mest påverkad av den i huvudsak milda vintern och god tillgång på snömagasin. Längre ut på kurvan (som inte våra certifikat replikerar) har däremot handlat högre under en period med stöd av högre kontinentala elpriser. Elmarknaden i Tyskland har drivits upp på högre konsumtion som stigit på både bättre industriförbrukning och, under en period, även av kallare väder i Centraleuropa. Dessutom har både kol- och CO2 priser samt US-dollar stärkts. Terminen som SEB:s certifikat följer, Q215, stängde igår på 25,15 euro/MWh
TREND
- Den korta änden av kurvan är i fallande men trend har mattats av. Q215-terminen befinner sig mycket nära tidigare bottnar.
REKOMMENDATION
- I nuläget saknas nödvändiga incitament för en väsentlig/varaktig prisuppgång. Samtidigt handlas terminerna mycket nära gamla bottnar. Brott av dessa öppnar för ytterligare nedsida. Dynamiken i marknaden för den kommande veckan finns därför fortsatt på nedsidan men denna är begränsad. För investerare som redan är korta rekommenderar vi att hålla kvar åtminstone en del av positionen i väntan på brott av stödet. För de som inte redan investerat, så rekommenderar vi neutral position i väntan på nya prissignaler.
GULD
 Förra veckan rekommenderade vi våra läsare att gå kort guld. Guld i dollartermer sjönk under veckan. En starkare dollar och uppgångar i aktieindex har lett till en minskad efterfrågan för guld. Efterfrågan på guld från Kina har också minskat i takt med att den kinesiska ekonomin bromsar in. Till exempel föll kinesiska bostadspriser i januari något snabbare jämfört med månaden innan. Det kinesiska nyårsfirandet som inleds denna vecka dämpar också efterfrågan på råvaror. Oron för Grekland har ökat. Grekerna vill inte acceptera de villkor som gäller för fortsatt stöd från euroländerna och IMF. Skulle man gå med på eftergifter till grekerna vad gäller offentliga besparingar och reformer lär ett antal euroländer stå på kö för att bryta mot budgetreglerna framöver. Även om Grekland kan klara sig en viss tid utan ytterligare stödutbetalningar är bankerna beroende av centralbankslikviditet som kan stoppas av ECB om utvecklingen anses ohållbar.
TREND
- Trots Greklandsoro behåller vi vår korta position i guld även under innevarande vecka.
REKOMMENDATION
- Behåll/köp BEAR GULD X2 S
VETE
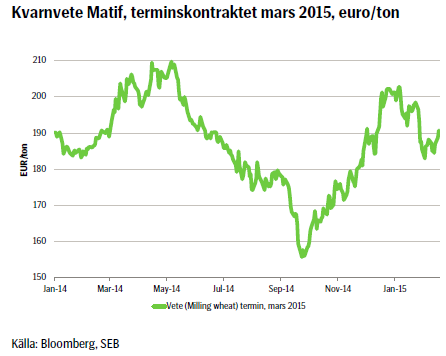 Vete på Matif inledde veckan svagt. Tisdagens månadsrapport (WASDE) från det amerikanska jordbruksdepartementet USDA fick vete att reagera negativt med fallande priser som följd.
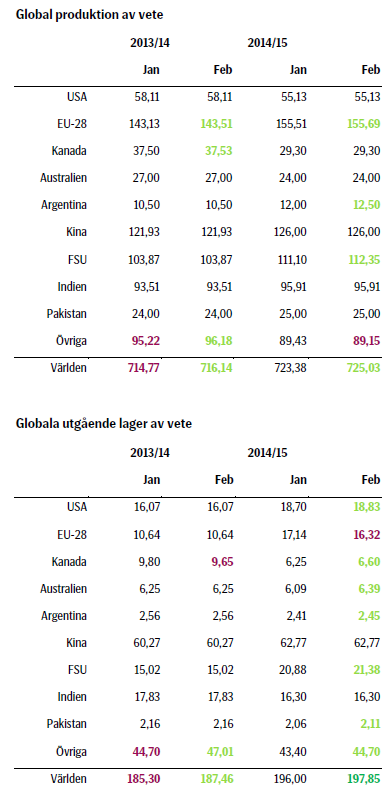
USDA justerade upp utgående lager av vete i USA med 5 miljoner bushel till 692 miljoner bushel till följd av en reducerad export som mer än väl uppväger en lägre import. Exporten väntas minska med 25 miljoner bushel till 900 miljoner bushel som en följd av ökad konkurrens från EU samt den senaste tidens stärkning av dollarn som gör amerikansk export mindre konkurrenskraftig. Marknaden hade dock väntat sig en lagernivå på 694 miljoner bushel vilket begränsade nedsidan.
Den globala produktionen av vete kvarstår på en rekordhög nivå och justeras dessutom upp med ytterligare 1,7 miljoner ton till 725,03 miljoner ton, framförallt till följd av revideringar för Argentina och Kazakstan.
Global konsumtion justeras upp med 1,5 miljoner till följd av ökad human- och foderanvändning, samtidigt som vi noterar att globala utgående lager sakta men säkert närmar sig 200 miljoner ton då de nu justeras upp med ytterligare 1,9 miljoner ton till 197,85 miljoner ton.
Priserna steg dock kraftigt i slutet av veckan till följd av vinsthemtagningar, väderprognoser som indikerar kallare väder i USA samt statistik som visar att Rysslands exportrestriktioner som trädde i kraft per den 1 februari nu ger effekt.
REKOMMENDATION
- Neutral
SOJABÖNOR
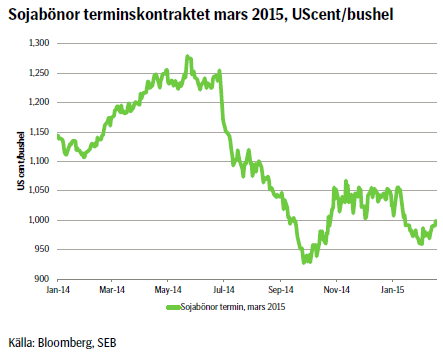 Sojabönor startade veckan med högre priser till följd av en fortsatt efterfrågan i kombination med vinsthemtagningar inför tisdagens WASDE-rapport från det amerikanska jordbruksdepartementet USDA.
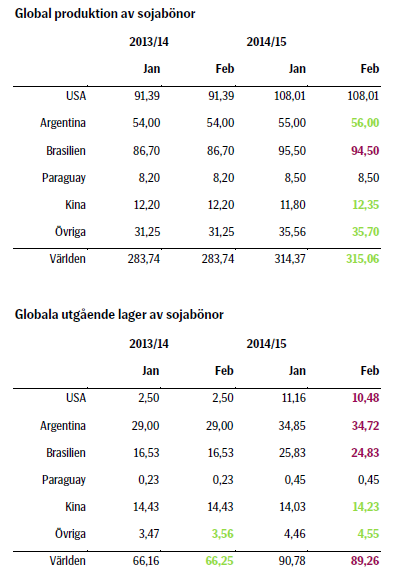
USDA justerar utgående lager av sojabönor i USA från förra månadens 410 miljoner bushel till 385 miljoner bushel, vilket var lägre än vad marknaden hade förväntat sig.
Den globala produktionen av sojabönor justeras upp med 0,7 miljoner ton till rekordhöga 315,1 miljoner ton. Utsikterna för skörden i Argentina har förbättrats som ett resultat av milda temperaturer och nederbörd vilket gör att produktionen justeras upp med 1 miljon ton till sy mycket som 56 miljoner ton. Produktionen revideras även upp för Kina, Ryssland och Ukraina. Brasiliens produktion justeras ner med 1 miljon ton sedan förra månaden till 94,5 miljoner ton då alltför lite regn i landets östra delar påverkar avkastningen negativt. Globala utgående lager justerades ner från 90,78 miljoner ton till 89,26 miljoner, vilket var mer än vad marknaden hade förväntat sig.
Även om produktionen av sojabönor i Brasiliens fortfarande förväntas bli rekordhög så är det flera privata analytiker som justerar ner sina produktionsestimat.
Veckan avslutades med en kraftig prisuppgång drivet av starka amerikanska exportsiffror, uppgången i råolja liksom en svagare dollar. Priserna fick också stöd av annonserade privata försäljningar av sojabönor till Kina.
REKOMMENDATION
- Det något stramare utbudet som visades i tisdagens WASDE-rapport gör att vi går ur vår korta position tillfälligt då priserna nu står och väger. Vi håller oss neutrala tills vi får en teknisk köp-eller säljsignal bekräftad.
[box]SEB Veckobrev Veckans råvarukommentar är producerat av SEB:s Commodities Sales desk och publiceras i samarbete och med tillstånd på Råvarumarknaden.se[/box]
Disclaimer
Detta marknadsföringsmaterial, framtaget av SEB:s Commodities Sales desk, har upprättats enbart i informationssyfte.
Även om innehållet är baserat på källor som SEB bedömt som tillförlitliga ansvarar SEB inte för fel eller brister i informationen. Den utgör inte oberoende, objektiv investeringsanalys och skyddas därför inte av de bestämmelser som SEB har infört för att förebygga potentiella intressekonflikter. Yttranden från SEB:s Commodities Sales desk kan vara oförenliga med tidigare publicerat material från SEB, då den senare hänvisas uppmanas du att läsa den fullständiga rapporten innan någon åtgärd vidtas.
Dokumentationen utgör inte någon investeringsrådgivning och tillhandahålls till dig utan hänsyn till dina investeringsmål. Du uppmanas att självständigt bedöma och komplettera uppgifterna i denna dokumentation och att basera dina investeringsbeslut på material som bedöms erforderligt. Alla framåtblickande uttalanden, åsikter och förväntningar är föremål för risker, osäkerheter och andra faktorer och kan orsaka att det faktiska resultatet avviker väsentligt från det förväntade. Historisk avkastning är ingen garanti för framtida resultat. Detta dokument utgör inte ett erbjudande att teckna några värdepapper eller andra finansiella instrument. SEB svarar inte för förlust eller skada – direkt eller indirekt, eller av vad slag det vara må – som kan uppkomma till följd av användandet av detta material eller dess innehåll.
Observera att det kan förekomma att SEB, dess ledamöter, dess anställda eller dess moder- och/eller dotterbolag vid olika tillfällen innehar, har innehaft eller kommer att inneha aktier, positioner, rådgivningsuppdrag i samband med corporate finance-transaktioner, investment- eller merchantbanking-uppdrag och/eller lån i de bolag/finansiella instrument som nämns i materialet.
Materialet är avsett för mottagaren, all spridning, distribuering mångfaldigande eller annan användning av detta meddelande får inte ske utan SEB:s medgivande.
Oaktat detta får SEB tillåta omfördelning av materialet till utvald tredje part i enlighet med gällande avtal. Materialet får inte spridas till fysiska eller juridiska personer som är medborgare eller har hemvist i ett land där sådan spridning är otillåten enligt tillämplig lag eller annan bestämmelse.
Skandinaviska Enskilda Banken AB (publ) är ett publikt aktiebolag och står under tillsyn av Finansinspektionen samt de lokala finansiella tillsynsmyndigheter i varje jurisdiktionen där SEB har filial eller dotterbolag.
Villkor
För varje enskilt certifikat finns Slutliga Villkor som anger de fullständiga villkoren. Slutliga Villkor finns tillgängligt på kurssidan för respektive certifikat på www.seb.se, Börs & finans, fliken Strukturerade placeringar.
Risker
En sammanfattning av de risker som är förknippade med Börshandlade certifikat generellt finns i Produktbroschyren för respektive certifikat som är tillgängligt på www.seb.se/cert. För en fullständig bild av riskerna behöver du ta del av SEB:s offentliggjorda Grundprospekt för Certifikat- och Warrantprogram som är publicerat på www.seb.se/cert.


The latest weekly report from the US DOE showed a substantial drawdown across key petroleum categories, adding more upside potential to the fundamental picture.

Commercial crude inventories (excl. SPR) fell by 5.8 million barrels, bringing total inventories down to 415.1 million barrels. Now sitting 11% below the five-year seasonal norm and placed in the lowest 2015-2022 range (see picture below).
Product inventories also tightened further last week. Gasoline inventories declined by 2.1 million barrels, with reductions seen in both finished gasoline and blending components. Current gasoline levels are about 3% below the five-year average for this time of year.
Among products, the most notable move came in diesel, where inventories dropped by almost 4.1 million barrels, deepening the deficit to around 20% below seasonal norms – continuing to underscore the persistent supply tightness in diesel markets.
The only area of inventory growth was in propane/propylene, which posted a significant 5.1-million-barrel build and now stands 9% above the five-year average.
Total commercial petroleum inventories (crude plus refined products) declined by 4.2 million barrels on the week, reinforcing the overall tightening of US crude and products.


A classic case of “buy the rumor, sell the news” played out in oil markets, as Brent crude has dropped sharply – down nearly USD 10 per barrel since yesterday evening – following Iran’s retaliatory strike on a U.S. air base in Qatar. The immediate reaction was: “That was it?” The strike followed a carefully calibrated, non-escalatory playbook, avoiding direct threats to energy infrastructure or disruption of shipping through the Strait of Hormuz – thus calming worst-case fears.
After Monday morning’s sharp spike to USD 81.4 per barrel, triggered by the U.S. bombing of Iranian nuclear facilities, oil prices drifted sideways in anticipation of a potential Iranian response. That response came with advance warning and caused limited physical damage. Early this morning, both the U.S. President and Iranian state media announced a ceasefire, effectively placing a lid on the immediate conflict risk – at least for now.
As a result, Brent crude has now fallen by a total of USD 12 from Monday’s peak, currently trading around USD 69 per barrel.
Looking beyond geopolitics, the market will now shift its focus to the upcoming OPEC+ meeting in early July. Saudi Arabia’s decision to increase output earlier this year – despite falling prices – has drawn renewed attention considering recent developments. Some suggest this was a response to U.S. pressure to offset potential Iranian supply losses.
However, consensus is that the move was driven more by internal OPEC+ dynamics. After years of curbing production to support prices, Riyadh had grown frustrated with quota-busting by several members (notably Kazakhstan). With Saudi Arabia cutting up to 2 million barrels per day – roughly 2% of global supply – returns were diminishing, and the risk of losing market share was rising. The production increase is widely seen as an effort to reassert leadership and restore discipline within the group.
That said, the FT recently stated that, the Saudis remain wary of past missteps. In 2018, Riyadh ramped up output at Trump’s request ahead of Iran sanctions, only to see prices collapse when the U.S. granted broad waivers – triggering oversupply. Officials have reportedly made it clear they don’t intend to repeat that mistake.
The recent visit by President Trump to Saudi Arabia, which included agreements on AI, defense, and nuclear cooperation, suggests a broader strategic alignment. This has fueled speculation about a quiet “pump-for-politics” deal behind recent production moves.
Looking ahead, oil prices have now retraced the entire rally sparked by the June 13 Israel–Iran escalation. This retreat provides more political and policy space for both the U.S. and Saudi Arabia. Specifically, it makes it easier for Riyadh to scale back its three recent production hikes of 411,000 barrels each, potentially returning to more moderate increases of 137,000 barrels for August and September.
In short: with no major loss of Iranian supply to the market, OPEC+ – led by Saudi Arabia – no longer needs to compensate for a disruption that hasn’t materialized, especially not to please the U.S. at the cost of its own market strategy. As the Saudis themselves have signaled, they are unlikely to repeat previous mistakes.
Conclusion: With Brent now in the high USD 60s, buying oil looks fundamentally justified. The geopolitical premium has deflated, but tensions between Israel and Iran remain unresolved – and the risk of missteps and renewed escalation still lingers. In fact, even this morning, reports have emerged of renewed missile fire despite the declared “truce.” The path forward may be calmer – but it is far from stable.
Analys
A muted price reaction. Market looks relaxed, but it is still on edge waiting for what Iran will do
Brent crossed the 80-line this morning but quickly fell back assigning limited probability for Iran choosing to close the Strait of Hormuz. Brent traded in a range of USD 70.56 – 79.04/b last week as the market fluctuated between ”Iran wants a deal” and ”US is about to attack Iran”. At the end of the week though, Donald Trump managed to convince markets (and probably also Iran) that he would make a decision within two weeks. I.e. no imminent attack. Previously when when he has talked about ”making a decision within two weeks” he has often ended up doing nothing in the end. The oil market relaxed as a result and the week ended at USD 77.01/b which is just USD 6/b above the year to date average of USD 71/b.

Brent jumped to USD 81.4/b this morning, the highest since mid-January, but then quickly fell back to a current price of USD 78.2/b which is only up 1.5% versus the close on Friday. As such the market is pricing a fairly low probability that Iran will actually close the Strait of Hormuz. Probably because it will hurt Iranian oil exports as well as the global oil market.
It was however all smoke and mirrors. Deception. The US attacked Iran on Saturday. The attack involved 125 warplanes, submarines and surface warships and 14 bunker buster bombs were dropped on Iranian nuclear sites including Fordow, Natanz and Isfahan. In response the Iranian Parliament voted in support of closing the Strait of Hormuz where some 17 mb of crude and products is transported to the global market every day plus significant volumes of LNG. This is however merely an advise to the Supreme leader Ayatollah Ali Khamenei and the Supreme National Security Council which sits with the final and actual decision.
No supply of oil is lost yet. It is about the risk of Iran closing the Strait of Hormuz or not. So far not a single drop of oil supply has been lost to the global market. The price at the moment is all about the assessed risk of loss of supply. Will Iran choose to choke of the Strait of Hormuz or not? That is the big question. It would be painful for US consumers, for Donald Trump’s voter base, for the global economy but also for Iran and its population which relies on oil exports and income from selling oil out of that Strait as well. As such it is not a no-brainer choice for Iran to close the Strait for oil exports. And looking at the il price this morning it is clear that the oil market doesn’t assign a very high probability of it happening. It is however probably well within the capability of Iran to close the Strait off with rockets, mines, air-drones and possibly sea-drones. Just look at how Ukraine has been able to control and damage the Russian Black Sea fleet.
What to do about the highly enriched uranium which has gone missing? While the US and Israel can celebrate their destruction of Iranian nuclear facilities they are also scratching their heads over what to do with the lost Iranian nuclear material. Iran had 408 kg of highly enriched uranium (IAEA). Almost weapons grade. Enough for some 10 nuclear warheads. It seems to have been transported out of Fordow before the attack this weekend.
The market is still on edge. USD 80-something/b seems sensible while we wait. The oil market reaction to this weekend’s events is very muted so far. The market is still on edge awaiting what Iran will do. Because Iran will do something. But what and when? An oil price of 80-something seems like a sensible level until something do happen.


USA ska införa 50 procent tull på koppar

Ryska staten siktar på att konfiskera en av landets största guldproducenter

Hur säkrar vi Sveriges tillgång till kritiska metaller och mineral i en ny geopolitisk verklighet?

Lundin Mining ska bli en av de tio största kopparproducenterna i världen

Sommarvädret styr elpriset i Sverige

Uppgången i oljepriset planade ut under helgen

Mahvie Minerals växlar spår – satsar fullt ut på guld

Låga elpriser i sommar – men mellersta Sverige får en ökning

Oljan, guldet och marknadens oroande tystnad
Very relaxed at USD 75/b. Risk barometer will likely fluctuate to higher levels with Brent into the 80ies or higher coming 2-3 weeks
-
 Nyheter4 veckor sedan
Uppgången i oljepriset planade ut under helgen
-
 Nyheter3 veckor sedan
Mahvie Minerals växlar spår – satsar fullt ut på guld
-
 Nyheter4 veckor sedan
Låga elpriser i sommar – men mellersta Sverige får en ökning
-
 Nyheter2 veckor sedan
Oljan, guldet och marknadens oroande tystnad
-
Analys4 veckor sedan
Very relaxed at USD 75/b. Risk barometer will likely fluctuate to higher levels with Brent into the 80ies or higher coming 2-3 weeks
-

 Nyheter2 veckor sedan
Jonas Lindvall är tillbaka med ett nytt oljebolag, Perthro, som ska börsnoteras
-
Analys3 veckor sedan
A muted price reaction. Market looks relaxed, but it is still on edge waiting for what Iran will do
-

 Nyheter2 veckor sedan
Domstolen ger klartecken till Lappland Guldprospektering