

Analys
SEB Råvarubrev 8 september 2015

Riktningssökande råvarumarknad efter stökiga veckor
 MARKNADEN I KORTHET
Förra veckan var något slags mellanvecka, men icke desto mindre viktig, för råvarumarknaden. Att kinesiska marknader var stängda under torsdag och fredag gav sannolikt i någon mån övriga marknader möjlighet att andas efter den senaste tidens våldsamma nedgång. Börserna runt om i världen stängde i och för sig generellt sett veckan på minus men hade en något stabilare och sidledes utveckling mot slutet av veckan. Denna vecka öppnade också med en försiktigt positiv känsla på marknaderna, men i stor utsträckning verkar det vara tekniska effekter och inte alltid med fundamentalt stöd. USA-marknaderna var också stängda igår på grund av Labor Day.
Brentoljan avslutade förra veckan sitt rally mot högre nivåer; mycket på grund av att investerare täckte sina korta positioner, men den handlade fortsatt volatilt under perioden. Dock stängde den veckan på i sammanhanget blygsamma minus en procent. Denna vecka ser vi en fortsatt risk för en kraftig rörelse mot högre nivåer om ett nytt så kallat short covering-rally skulle utlösas i och med de fortsatt mycket stora korta positionerna i marknaden. Det kommer sannolikt finnas ett fundamentalt stöd för oljepriset i och med att flera rapporter kommer under veckan, i vilka vi tror att vi kommer se uppreviderade prognoser för oljepriset samt för global efterfrågan. Läs mer i avsnittet om olja!
Vad gäller basmetaller har vi sett en marknad som söker riktning. Fundamentalt ser vi ett nedåttryck, samtidigt som flertalet metaller strävar uppåt i pris. Till stor del kan detta förklaras genom att marknaden testar högre nivåer efter den senaste tidens kraftiga nedgångar och söker på så vis något slags jämviktsnivå; åtminstone under en kortare period. Vi noterar att just koppar, vilket vi har en kort position i, i stor utsträckning har påverkats av makrofaktorer under den senaste veckan, samt den allmänna uppgången i metaller. Vi tror dock fortsatt att risken är på nedsidan, varför vi ligger kvar i vår korta rekommendation och bevakar kursen tills den, som vi tror, vänder och då utökar vår position. Läs mer i avsnittet om koppar!
Angående jordbruksprodukter så ligger vi kvar i våra korta positioner i kaffe och socker. De båda har haft en volatil resa, men risken på nedsidan kvarstår. Vi diskuterar den tekniska bilden och konstaterar att både den och fundamentala faktorer övervägande pekar mot en fortsatt nedgång; även om marknaden har varit i en tvekande fas den senaste tiden. El Niño fortsätter att vara ett, skall vi säga, orosmoln på himlen, men effekterna har inte slagit igenom med full kraft – som det verkar.
TRENDER I SAMMANDRAG
- Viss stabilisering för råvaror generellt under förra veckan med mindre nedgångar
- Fortfarande risk för rally uppåt i pris på Brentoljan på grund av stora korta positioner i marknaden. Sannolikt fundamentalt stöd under veckan, även om risken kvarstår på nedsidan
- Basmetaller söker något slags riktning och stabil nivå. Generell uppgång, men risken på nedsidan signifikant
- För jordbruksprodukter är el Niño fortsatt största orosmomentet – sannolikt ej sett alla effekter
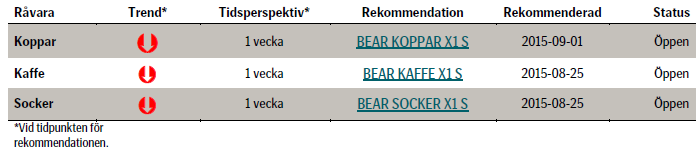
VECKANS REKOMMENDATIONER
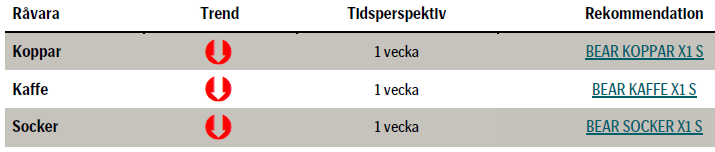
En placering i certifikat och warranter är förknippat med risker. Du kan förlora hela ditt investerade kapital. Läs mer om riskerna i SEB:s offentliggjorda Grundprospekt för certifikat- och warrantprogram på seb.se/cert eller seb.se/mini.
OLJA
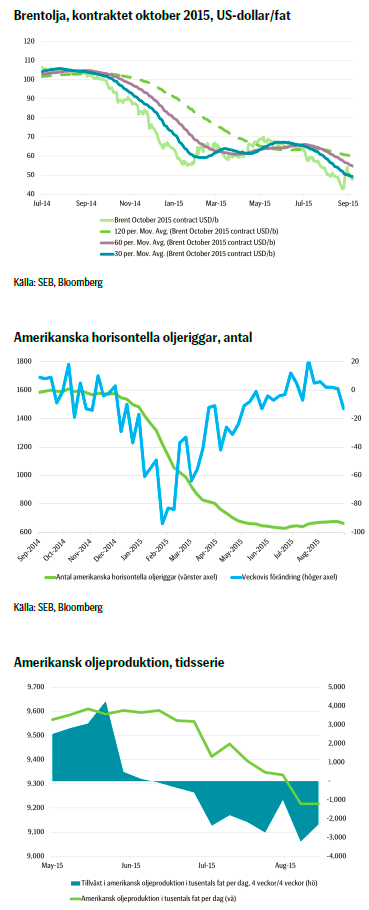 De mycket kraftiga prisrörelserna i olja som tog extra fart på grund av att investerare täckte sina korta positioner kom så till ett slut under början av förra veckan. Det kom dock en del ytterligare stöttande faktorer under samma period: Prognoser för amerikansk oljeproduktion nedreviderades relativt kraftigt, samtidigt som amerikansk faktisk oljeproduktion uppvisade en skarp veckovis minskning då siffrorna presenterades på onsdagen. Veckan avrundades genom det största fallet i antalet amerikanska oljeriggar sedan maj och den första minskningen i antal på sju veckor. Dock har ingen av dessa faktorer kunnat skjuta oljepriset vidare uppåt efter förra veckans short covering-rally. Dock är den sammanlagda korta marknadspositioneringen enorm efter att ha ackumulerats i flera månader, så skulle priset lyfta kan vi återigen få en ytterligare större rörelse uppåt då många investerare skulle vilja täcka sina korta positioner.
Denna vecka kommer amerikanska energimyndigheten att presentera sin Short Term Energy Outlook på onsdag medan International Energy Agency kommer presentera sin månatliga oljemarknadsrapport på fredag. Revisionerna nedåt av den amerikanska oljeproduktionen kommer sannolikt avspeglas i båda rapporterna och säkerligen i den amerikanska. Detta kommer i sin tur att leda till en kalkylerat mer balanserad oljemarknad samt också ett högre prognosticerat oljepris av den amerikanska energimyndigheten. Ny data visar också på en fortsatt stark tillväxt av efterfrågan under 2015, vilket sannolikt innebär att båda rapporterna kommer revidera sina prognoser för efterfrågan uppåt.
Marknaden handlade igår kring det 30 dagar långa glidande medelvärdet för oljan och prisbilden verkade inte riktigt ha tagit intryck av det överlag positiva sentimentet på aktiemarknaderna efter helgen och vi såg ett säljtryck i Brentoljemarknaden. Generellt är en sådan handel känslig, så investerare tar ofta intryck av vilken sida av medelvärdet som priset stänger på i slutet av dagen; som en indikation på sentiment och vidare riktning. Det visade sig att priset stängde under det glidande medelvärdet, vilket ändrade marknadsbilden. I skrivande stund handlar också oljan ned.
Vidare har vi en del kinesisk data denna vecka med konsumentprisindex på onsdag samt import/export och inte minst industriproduktion på söndag. Dessa data kan definitivt påverka stämningen i marknaden och de senare sätta tonen för nästa vecka.
Förra veckan konstaterade vi att risken är på nedsidan – vi får se om veckans rapporter kan ge stöd åt priset eller om öppningen på veckan med riktning nedåt kommer att sätta stämningen.
Bjarne Schieldrop
Chefsanalytiker råvaror
SEB
TREND
- Förra veckans short covering-rally avslutat
- Korta aggregerade positioner fortfarande mycket stora, vilket ger risk för ny short covering
- Sentimentet i marknaden sannolikt avhängigt veckans oljerapporter samt kinesisk data
- Vi tror att marknaden söker riktning med risken huvudsakligen på nedsidan. Dock finns en tydlig risk med den stora korta positioneringen, vilken kan accelerera en eventuell rörelse uppåt.
KAFFE
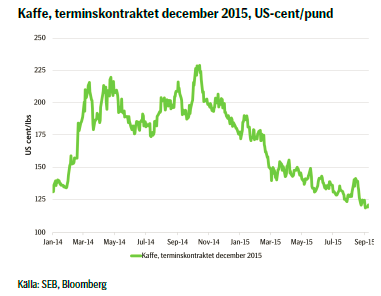 Under förra veckan såg vi en nedgång i kaffepriset, även om det gick upp något mot slutet av veckan. Vad som håller emot är att regn i Brasilien försenar skörden något – fortfarande ligger man efter, jämfört med föregående säsong – och att säsongens skörd har genererat i storlek mindre bönor än förväntat. Andra producerande länder i både Centralamerika och Afrika har varnat för ogynnsamma effekter av el Niño, vilket också ger stöd för priset.
Den brasilianska realen har dock fortsatt att försvagas, vilket har resulterat i ökad export från landet. Intressant nog fortsätter priset sin resa nedåt, så ovan nämna faktorer är inte nog för att hålla emot. Det kom även rapporter under veckan om att kaffet är ”översålt”, det vill säga nedtryckt till nivåer som inte motsvarar åtminstone den kortsiktiga balansen, men fortfarande rör sig kaffet nedåt i pris.
Mot bakgrund av det allmänna, riktningssökande sentimentet och det motsägelsefulla nyhetsflödet kring kaffet väljer vi att lita på den tekniska analysen: Vi ser att kaffet sannolikt kommer att göra ett nytt försök nedåt efter den mindre korrektionen under slutet av förra veckan; sannolikt ned mot 114 US-cent per pund. Priset har studsat mot sin stödlinje och den tydliga, men något mattare trenden är fortsatt nedåt.
Idag tisdag öppnade kaffet lägre men har handlat upp något efter att marknaderna i USA har varit stängda under måndagen. Sannolikt behöver marknaden hitta en ordentlig nivå att utgå från.
TREND
- Negativa trenden i kaffepriset fortsätter
- Motsägelsefullt nyhetsflöde
- Teknisk analys indikerar nytt försök ned mot 114 US-cent/pund
- Vi tror att kaffepriset skall fortsätta nedåt, om än med relativt hög volatilitet. Vi ligger kvar i vår korta rekommendation och bevakar nivåer nedåt 114 US-dollar per pund.
REKOMMENDATION
- BEAR KAFFE X1 S
SOCKER
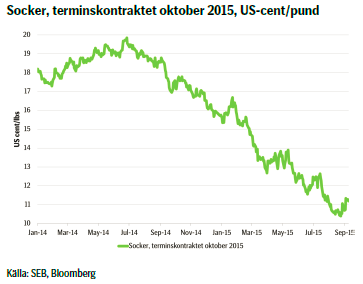 Sockerpriset har fått signifikant stöd under veckan av väderrelaterad oro på grund av el Niño: I Brasilien har det rapporterats om att regn har stört skörden och i Indien har vädret varit för torrt. Det har under förra veckan också diskuterats om sockret, liksom kaffet, har varit ”översålt”. Det skulle vara för att korta positioner är ovanligt stora och att man samtidigt har nått mycket låga prisnivåer.
Mot detta kan man argumentera att fundamentala faktorer säger att sockerpriset faktiskt skall vara lågt: Efterfrågan från Kina – en av världens numer största konsumenter – minskar, globala lager är fortsatt stora och senast i veckan kom nyheter som hävdade att etanolbilar är omoderna relativt nyare hybridalternativ.
Det skall dock sägas att stora korta positioner absolut ökar risken för så kallad short covering, där investerare i stor omfattning kliver av sina korta positioner i hastig takt och därför driver upp priset. Det är antagligen i mer än ringa utsträckning just det vi såg mot slutet av veckan. Å andra sidan är det också ett argument för att priset faktiskt skall vara lågt: Uppgången är en teknisk, och inte fundamental effekt. Icke desto mindre har ju priset faktiskt gått upp.
Så vad skall man då tro på? Det tekniska perspektivet säger att om de senaste dagarnas korrektion har varit en någorlunda normal sådan, så skulle sockret ha nått sitt mål på 11,60 US-cent per pund i fredags. Nästa stöd uppåt, om vi skulle se en plötslig vändning uppåt, är 12,80. Sannolikt lär vi efter den initiala handeln efter att USA-marknaderna åter öppnat idag se en rörelse nedåt mot en ny botten. Skulle vi inte nå en sådan är det dock läge att börja dra öronen åt sig och vara beredd på en rörelse högre.
Sammantaget tror vi att priset kommer röra sig nedåt. I den inledande handeln idag tisdag rörde sig också priset nedåt. Vi bevakar rörelsen och ser om vi når en ny botten.
TREND
- Sockerpriset rörde sig uppåt mot slutet av förra veckan; dels på grund av vädereffekter, delvis tekniskt
- Korta positioner fortfarande stora – risk för rekyl uppåt
- Vi tror att sockerpriset kommer röra sig nedåt och bevakar det tills vi når en ny botten.
REKOMMENDATION
- BEAR SOCKER X1 S
KOPPAR
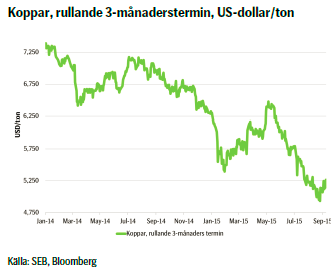 Kopparpriset handlade upp under förra veckan mot bakgrund av en lugnare marknad, sannolikt då kinesiska marknader var stängda vilket gav ett visst andrum, samt att metallen följde den allmänna uppgången. Det kom också rapporter om att den kinesiska produktionen under juli inte tog den fart som var förväntad efter schemalagt underhåll i fabrikerna. Dock blev den tekniska effekten uppåt relativt stor, då premier för fysisk leverans i Kina (det vill säga, den premie man som fysisk köpare får betala för att slippa vänta på handläggning i lagren) på koppar ökade och importen till landet ökade därför i augusti, vilket i sin tur gav stöd åt priset.
Under ECB:s presskonferens i torsdags konstaterade centralbankschefen Draghi att Kinas dämpning i tillväxeten var allvarlig. Samtidigt steg paradoxalt nog kopparpriset. På fredagen sjönk dock kopparpriset kraftigt då data kom på att tyska industriordrar sjönk i antal, samtidigt som amerikansk data (non-farm payrolls) kom in sämre än förväntat. Rörelsen intradag var hela -4,4% vilket onekligen vittnar om att risken är på nedsidan.
Igår måndag reagerade kopparpriset först negativt på svagare tysk industriproduktion och sedan positivt på att Glencore, en av världens största producenter av koppar, meddelade att man drar ned på produktionen av metallen. Denna svajighet säger en hel del om marknaden just nu.
Tekniskt ser vi att kopparpriset är inne i en korrektionsfas och den är inte klar ännu. Vi gick därför in i vår rekommendation något tidigt, men då fredagen stängde under 5237 US-dollar per ton bör korrektionen ha tappat momentum. Vi tolkar också den senaste veckans rörelse som att under nivån 5045 är det ånyo säljarna som styr. Därför ligger vi kvar i vår rekommendation och vi bevakar kursutvecklingen. När vi ser att korrektionen är klar utökar vi vår korta position ytterligare; eventuellt med högre hävstång.
TREND
- Kopparpriset inne i en korrektionsfas högre
- Stökig marknad med högre volatilitet
- Risken dock kvar på nedsidan efter färdig korrektion
- Vi tror att kopparpriset kommer att fortsätta nedåt efter avklarad korrektion. När vi tror att lokalt maximum är nått utökar vi vår korta position; eventuellt med högre hävstång.
REKOMMENDATION
- BEAR KOPPAR X1 S
EL
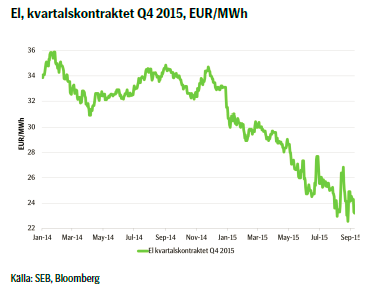 Elpriset har mer eller mindre handlat sidledes med mycket liten variation intradag. Kolpriset har, sett över föregående vecka gått ned något för att faktiskt handlas ned till nya låga nivåer idag. Detta öppnar upp en möjlighet för ytterligare nedgång i elpriset. Utsläppsrätter har mer eller mindre handlat sidledes, samtidigt som den hydrologiska balansen har ökat något litet. Vattenmagasinen är nu mer välfyllda än vad de har varit sedan 2012. Den hydrologiska balansen, det vill säga mängden snö, markvatten, grundvatten och vatten i vattenmagasinen, prognosticeras sjunka högst marginellt framöver.
I fredags meddelade Vattenfall att man på grund av ”.…den höga effektskatten /…/ beslutat om att begränsa investeringarna för Ringhals 1 och 2. Investeringsbeslut, som fått vänta medan diskussionen med E.ON pågått, kommer inte att tas upp på nytt.” I praktiken innebär detta att de två äldsta reaktorerna kommer att underhållas i begränsad utsträckning och därför måste stängas senast år 2020, vilket alltså är minst fem år tidigare än vad som har varit planerat.
Det här är sannolikt det första steget mot något slags jämvikt i den nordiska energimarkaden, vilken har sett elpriserna sjunka under en längre tid. I och med omställningen mot så kallade gröna alternativ är det kärnkraften som uppenbarligen får en mindre betydande roll. Förvisso ger detta ett fundamentalt stöd för priset, men i den kortare delen av kurvan är dock effekten marginell.
Elpriset reagerade också i begränsad utsträckning på denna nyhet genom att handlas upp några eurocent och trycket blev istället på nedsidan i och med helgens mycket kraftiga nederbörd. Priset öppnade också lägre på måndagen.
Sammantaget ser vi i det korta perspektivet ett fortsatt nedåttryck på elpriset, men frågan kvarstår: Hur långt ned kan det gå?
TREND
- Sidledes prisrörelse under veckan som gick
- Fundamentala faktorer i stort sidledes, medan ökande hydrologisk balans med välfyllda vattenmagasin
- Vi tror att risken i elpriset är på nedsidan, men bedömer det som svårt att sätta en målnivå. Aktiva investerare hittar dock alltid möjligheter i volatiliteten!
AKTUELLA REKOMMENDATIONER
[box]SEB Veckobrev Veckans råvarukommentar är producerat av SEB:s Commodities Sales desk och publiceras i samarbete och med tillstånd på Råvarumarknaden.se[/box]
KÄLLOR
Bloomberg, Reuters, SEB
VILLKOR
För varje enskilt certifikat/mini future finns Slutliga Villkor som anger de fullständiga villkoren. Slutliga Villkor finns tillgängligt på kurssidan för respektive certifikat/mini future på www.seb.se, Börs & finans, fliken Strukturerade placeringar.
RISKER
En sammanfattning av de risker som är förknippade med Börshandlade certifikat generellt finns i Produktbroschyren för respektive certifikat eller mini future som är tillgängligt på seb.se/cert respektive seb.se/mini. För en fullständig bild av riskerna behöver du ta del av SEB:s offentliggjorda Grundprospekt för Certifikat- och Warrantprogram som är publicerat på www.seb.se/cert respektive seb.se/mini.
DISCLAIMER
Detta marknadsföringsmaterial, framtaget av SEB:s Commodities Sales desk, har upprättats enbart i informationssyfte.
Även om innehållet är baserat på källor som SEB bedömt som tillförlitliga ansvarar SEB inte för fel eller brister i informationen. Den utgör inte oberoende, objektiv investeringsanalys och skyddas därför inte av de bestämmelser som SEB har infört för att förebygga potentiella intressekonflikter. Yttranden från SEB:s Commodities Sales desk kan vara oförenliga med tidigare publicerat material från SEB, då den senare hänvisas uppmanas du att läsa den fullständiga rapporten innan någon åtgärd vidtas.
Dokumentationen utgör inte någon investeringsrådgivning och tillhandahålls till dig utan hänsyn till dina investeringsmål. Du uppmanas att självständigt bedöma och komplettera uppgifterna i denna dokumentation och att basera dina investeringsbeslut på material som bedöms erforderligt. Alla framåtblickande uttalanden, åsikter och förväntningar är föremål för risker, osäkerheter och andra faktorer och kan orsaka att det faktiska resultatet avviker väsentligt från det förväntade. Historisk avkastning är ingen garanti för framtida resultat. Detta dokument utgör inte ett erbjudande att teckna några värdepapper eller andra finansiella instrument. SEB svarar inte för förlust eller skada – direkt eller indirekt, eller av vad slag det vara må – som kan uppkomma till följd av användandet av detta material eller dess innehåll.
Observera att det kan förekomma att SEB, dess ledamöter, dess anställda eller dess moder- och/eller dotterbolag vid olika tillfällen innehar, har innehaft eller kommer att inneha aktier, positioner, rådgivningsuppdrag i samband med corporate finance-transaktioner, investment- eller merchantbanking-uppdrag och/eller lån i de bolag/finansiella instrument som nämns i materialet.
Materialet är avsett för mottagaren, all spridning, distribuering mångfaldigande eller annan användning av detta meddelande får inte ske utan SEB:s medgivande. Materialet riktar sig inte till personer vars medverkan kräver ytterligare prospekt, registrerings- eller andra åtgärder än vad som följer av svensk rätt. Det åligger var och en att iaktta sådana restriktioner. Materialet får inte distribueras i eller till land där distribution kräver ovan nämnda åtgärder eller strider mot reglering i sådant land. Materialet riktar sig således inte till fysiska eller juridiska personer hemmahörande i USA eller i något annat land där publicering eller tillhandahållande av materialet är förbjudet eller strider mot tillämpliga bestämmelser i landet.
Oaktat detta får SEB tillåta omfördelning av materialet till utvald tredje part i enlighet med gällande avtal. Materialet får inte spridas till fysiska eller juridiska personer som är medborgare eller har hemvist i ett land där sådan spridning är otillåten enligt tillämplig lag eller annan bestämmelse.
Skandinaviska Enskilda Banken AB (publ) är ett publikt aktiebolag och står under tillsyn av Finansinspektionen samt de lokala finansiella tillsynsmyndigheter i varje jurisdiktionen där SEB har filial eller dotterbolag.

The latest weekly report from the US DOE showed a substantial drawdown across key petroleum categories, adding more upside potential to the fundamental picture.

Commercial crude inventories (excl. SPR) fell by 5.8 million barrels, bringing total inventories down to 415.1 million barrels. Now sitting 11% below the five-year seasonal norm and placed in the lowest 2015-2022 range (see picture below).
Product inventories also tightened further last week. Gasoline inventories declined by 2.1 million barrels, with reductions seen in both finished gasoline and blending components. Current gasoline levels are about 3% below the five-year average for this time of year.
Among products, the most notable move came in diesel, where inventories dropped by almost 4.1 million barrels, deepening the deficit to around 20% below seasonal norms – continuing to underscore the persistent supply tightness in diesel markets.
The only area of inventory growth was in propane/propylene, which posted a significant 5.1-million-barrel build and now stands 9% above the five-year average.
Total commercial petroleum inventories (crude plus refined products) declined by 4.2 million barrels on the week, reinforcing the overall tightening of US crude and products.


A classic case of “buy the rumor, sell the news” played out in oil markets, as Brent crude has dropped sharply – down nearly USD 10 per barrel since yesterday evening – following Iran’s retaliatory strike on a U.S. air base in Qatar. The immediate reaction was: “That was it?” The strike followed a carefully calibrated, non-escalatory playbook, avoiding direct threats to energy infrastructure or disruption of shipping through the Strait of Hormuz – thus calming worst-case fears.
After Monday morning’s sharp spike to USD 81.4 per barrel, triggered by the U.S. bombing of Iranian nuclear facilities, oil prices drifted sideways in anticipation of a potential Iranian response. That response came with advance warning and caused limited physical damage. Early this morning, both the U.S. President and Iranian state media announced a ceasefire, effectively placing a lid on the immediate conflict risk – at least for now.
As a result, Brent crude has now fallen by a total of USD 12 from Monday’s peak, currently trading around USD 69 per barrel.
Looking beyond geopolitics, the market will now shift its focus to the upcoming OPEC+ meeting in early July. Saudi Arabia’s decision to increase output earlier this year – despite falling prices – has drawn renewed attention considering recent developments. Some suggest this was a response to U.S. pressure to offset potential Iranian supply losses.
However, consensus is that the move was driven more by internal OPEC+ dynamics. After years of curbing production to support prices, Riyadh had grown frustrated with quota-busting by several members (notably Kazakhstan). With Saudi Arabia cutting up to 2 million barrels per day – roughly 2% of global supply – returns were diminishing, and the risk of losing market share was rising. The production increase is widely seen as an effort to reassert leadership and restore discipline within the group.
That said, the FT recently stated that, the Saudis remain wary of past missteps. In 2018, Riyadh ramped up output at Trump’s request ahead of Iran sanctions, only to see prices collapse when the U.S. granted broad waivers – triggering oversupply. Officials have reportedly made it clear they don’t intend to repeat that mistake.
The recent visit by President Trump to Saudi Arabia, which included agreements on AI, defense, and nuclear cooperation, suggests a broader strategic alignment. This has fueled speculation about a quiet “pump-for-politics” deal behind recent production moves.
Looking ahead, oil prices have now retraced the entire rally sparked by the June 13 Israel–Iran escalation. This retreat provides more political and policy space for both the U.S. and Saudi Arabia. Specifically, it makes it easier for Riyadh to scale back its three recent production hikes of 411,000 barrels each, potentially returning to more moderate increases of 137,000 barrels for August and September.
In short: with no major loss of Iranian supply to the market, OPEC+ – led by Saudi Arabia – no longer needs to compensate for a disruption that hasn’t materialized, especially not to please the U.S. at the cost of its own market strategy. As the Saudis themselves have signaled, they are unlikely to repeat previous mistakes.
Conclusion: With Brent now in the high USD 60s, buying oil looks fundamentally justified. The geopolitical premium has deflated, but tensions between Israel and Iran remain unresolved – and the risk of missteps and renewed escalation still lingers. In fact, even this morning, reports have emerged of renewed missile fire despite the declared “truce.” The path forward may be calmer – but it is far from stable.
Analys
A muted price reaction. Market looks relaxed, but it is still on edge waiting for what Iran will do
Brent crossed the 80-line this morning but quickly fell back assigning limited probability for Iran choosing to close the Strait of Hormuz. Brent traded in a range of USD 70.56 – 79.04/b last week as the market fluctuated between ”Iran wants a deal” and ”US is about to attack Iran”. At the end of the week though, Donald Trump managed to convince markets (and probably also Iran) that he would make a decision within two weeks. I.e. no imminent attack. Previously when when he has talked about ”making a decision within two weeks” he has often ended up doing nothing in the end. The oil market relaxed as a result and the week ended at USD 77.01/b which is just USD 6/b above the year to date average of USD 71/b.

Brent jumped to USD 81.4/b this morning, the highest since mid-January, but then quickly fell back to a current price of USD 78.2/b which is only up 1.5% versus the close on Friday. As such the market is pricing a fairly low probability that Iran will actually close the Strait of Hormuz. Probably because it will hurt Iranian oil exports as well as the global oil market.
It was however all smoke and mirrors. Deception. The US attacked Iran on Saturday. The attack involved 125 warplanes, submarines and surface warships and 14 bunker buster bombs were dropped on Iranian nuclear sites including Fordow, Natanz and Isfahan. In response the Iranian Parliament voted in support of closing the Strait of Hormuz where some 17 mb of crude and products is transported to the global market every day plus significant volumes of LNG. This is however merely an advise to the Supreme leader Ayatollah Ali Khamenei and the Supreme National Security Council which sits with the final and actual decision.
No supply of oil is lost yet. It is about the risk of Iran closing the Strait of Hormuz or not. So far not a single drop of oil supply has been lost to the global market. The price at the moment is all about the assessed risk of loss of supply. Will Iran choose to choke of the Strait of Hormuz or not? That is the big question. It would be painful for US consumers, for Donald Trump’s voter base, for the global economy but also for Iran and its population which relies on oil exports and income from selling oil out of that Strait as well. As such it is not a no-brainer choice for Iran to close the Strait for oil exports. And looking at the il price this morning it is clear that the oil market doesn’t assign a very high probability of it happening. It is however probably well within the capability of Iran to close the Strait off with rockets, mines, air-drones and possibly sea-drones. Just look at how Ukraine has been able to control and damage the Russian Black Sea fleet.
What to do about the highly enriched uranium which has gone missing? While the US and Israel can celebrate their destruction of Iranian nuclear facilities they are also scratching their heads over what to do with the lost Iranian nuclear material. Iran had 408 kg of highly enriched uranium (IAEA). Almost weapons grade. Enough for some 10 nuclear warheads. It seems to have been transported out of Fordow before the attack this weekend.
The market is still on edge. USD 80-something/b seems sensible while we wait. The oil market reaction to this weekend’s events is very muted so far. The market is still on edge awaiting what Iran will do. Because Iran will do something. But what and when? An oil price of 80-something seems like a sensible level until something do happen.


Samtal om flera delar av råvarumarknaden
Tightening fundamentals – bullish inventories from DOE

Jonas Lindvall är tillbaka med ett nytt oljebolag, Perthro, som ska börsnoteras

Oljan, guldet och marknadens oroande tystnad

Domstolen ger klartecken till Lappland Guldprospektering

Stor uppsida i Lappland Guldprospekterings aktie enligt analys

Brookfield ska bygga ett AI-datacenter på hela 750 MW i Strängnäs

Sommaren inleds med sol och varierande elpriser
Silverpriset släpar efter guldets utveckling, har mer uppsida
Brent needs to fall to USD 58/b to make cheating unprofitable for Kazakhstan
-
 Nyheter3 veckor sedan
Stor uppsida i Lappland Guldprospekterings aktie enligt analys
-
 Nyheter4 veckor sedan
Brookfield ska bygga ett AI-datacenter på hela 750 MW i Strängnäs
-
 Nyheter4 veckor sedan
Sommaren inleds med sol och varierande elpriser
-
 Nyheter3 veckor sedan
Silverpriset släpar efter guldets utveckling, har mer uppsida
-
Analys4 veckor sedan
Brent needs to fall to USD 58/b to make cheating unprofitable for Kazakhstan
-

 Nyheter4 veckor sedan
Tradingfirman XTX Markets bygger datacenter i finska Kajana för 1 miljard euro
-

 Nyheter2 veckor sedan
Uppgången i oljepriset planade ut under helgen
-

 Nyheter2 veckor sedan
Låga elpriser i sommar – men mellersta Sverige får en ökning