

Analys
SEB Råvarubrev 1 september 2015

Koppar droppar – vi kortar för fulla muggar
 MARKNADEN I KORTHET
Veckan som gick präglades av trevande uppgångar på marknaderna efter den senaste tidens finansiella turbulens. Sett över veckan stängde flertalet både europeiska och amerikanska breda aktieindex på plus, medan Shanghaibörsen gick ned nästan 8 procent. Överlag är känslan i marknaderna att de söker något slags riktning. Den senaste tidens nedgångar och negativa sentiment har nog ingen missat och känslan sitter i. Mot slutet av veckan och speciellt i fredags sågs dock relativt kraftiga uppgångar, vilka till stor utsträckning berodde på att man täckte korta positioner då man inte ville ha exponering över helgen. Den här veckan har vi en del USA-data där konsensusestimaten överlag är positiva, till skillnad från de något sämre än förväntade siffrorna som vi såg under förra veckan. Signalerna från några av FED:s ledamöter under samma period var något motstridiga och sannolikheten som marknaden prisar in för en höjning av räntan i september sjönk. Vi tror dock fortsatt på en höjning av räntan, vilket sannolikt kommer att stärka US-dollarn. Det i sin tur har direkt påverkan på råvarupriserna, så håll koll på USA-data framöver!
Oljan var under början av förra veckan nere och nosade på nivåer strax över 42 US-dollar per fat; mycket som ett resultat av stora finansiella flöden. Sentimentet vände mot slutet av veckan och priset rörde sig nästan 21 procent mellan lägsta och högsta nivån. Som ett resultat av detta började investerare kliva av de stora korta positionerna som har ackumulerats under sommaren och effekten uppåt på priset blev därmed än större. Innevarande vecka har öppnat mycket starkt, men förra veckans nivå 42 US-dollar per fat finns där som en för marknaden sannolikt ganska lockande nivå och vi lär nog se försök att nå den igen. Läs mer i stycket om olja!
Basmetaller hade en volatil föregående vecka och rekylerade liksom oljan uppåt i de senare dagarnas handel. Det var egentligen föga förvånande med tanke på den tidigare utvecklingen och att marknaden hade ackumulerat stora korta positioner, vilka när rekylen kom drev på uppgången genom att investerare klev av dem. Igår måndag var London Metal Exchange (LME) stängd och då sentimentet var negativt genom nedgångar i metallpriser i Kina på måndagen så öppnade basmetaller idag tisdag lägre och fortsatte nedåt, samtidigt som sentimentet globalt på börserna var negativt. Vi tror fortsatt att risken är på nedsidan och utnyttjar senaste tidens uppgång genom att ta en kort position i koppar – läs mer i det avsnittet!
Jordbruksprodukter hade även de en volatil resa under förra veckan, men talande för att marknaderna söker en riktning just nu är att nedgången fredag till fredag för många jordbruksprodukter motsvarades av US-dollarns förstärkning. Fortsatt ger el Niño upphov till frågetecken, men än så länge ser vi fortsatt tryck nedåt, inte minst på grund av det allmänna sentimentet, och vi ligger kvar i våra rekommendationer.
TRENDER I SAMMANDRAG
- Generell turbulens på råvarumarknaderna. En i flera avseenden teknisk rekyl uppåt i slutet av förra veckan
- Fortsatt tryck nedåt i priset för Brentolja pga. potentiellt ökande amerikansk liksom OPEC-produktion
- Basmetaller rekylerade uppåt förra veckan – skapar potential för ytterligare fall
- Jordbruksprodukter nedåt med marknaderna generellt – el Niño fortfarande osäkerhetsfaktor
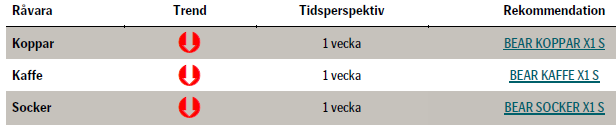
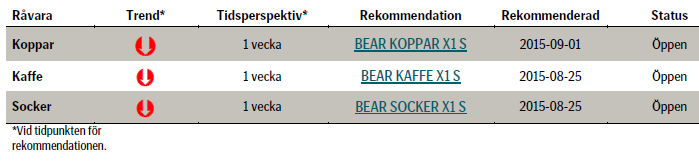
VECKANS REKOMMENDATIONER
En placering i certifikat och warranter är förknippat med risker. Du kan förlora hela ditt investerade kapital. Läs mer om riskerna i SEB:s offentliggjorda Grundprospekt för certifikat- och warrantprogram på seb.se/cert eller seb.se/mini.
OLJA
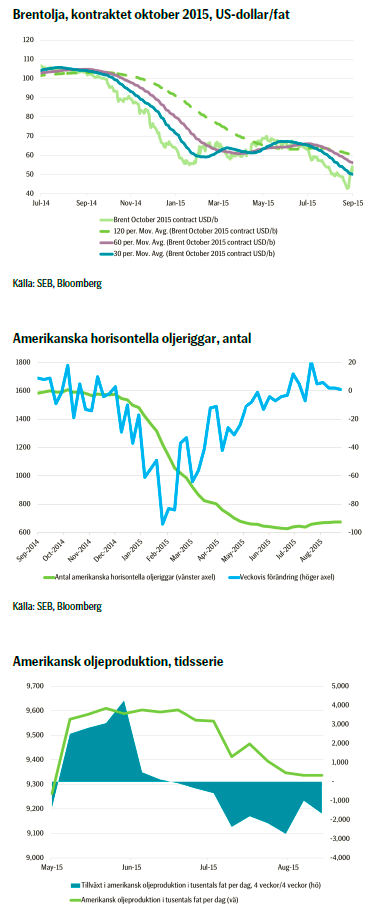 Under förra veckan bröt oljan nedanför januaris lägsta nivå och handlade på 42,23 US-dollar per fat. Det var onekligen att bryta ny mark och marknaden tryckte på för att nå de nya, lägre nivåerna. En viss nervositet fanns dock uppenbarligen, varför priset rekylerade tillbaka mot nivåer kring 50 US-dollar per fat. Huvudsakligen berodde rekylen på ett ändrat sentiment i aktiemarknaden, som i sin tur till stor del kan tillskrivas den kinesiska regeringens ansträngningar att förbättra förutsättningarna på de kinesiska börserna; sannolikt för att bättra på stämningen inför andra världskriget-paraden senare i veckan. Kinesiska marknader är stängda torsdag-fredag på grund av detta, vilket kan ha en avkylande effekt efter den senaste tidens turbulens, så vida inte sentimentet försämras ytterligare under tiden och återöppnandet blir som att dra ur proppen ur badkaret.
Oljan öppnade dock under början av denna vecka mycket kraftigt uppåt, baserat på uttalanden från OPEC, vilka var utan egentlig substans, men också genom att US Energy Information Administration, EIA, släppte data på lägre produktion. Sedan förra veckans lägsta notering har priset i skrivande stund rört sig uppåt cirka 25 procent – ett tecken på hur riktigt nervös och kortsiktig marknaden just nu är. Det skall dock påpekas att åter testa nivåer kring 42 US-dollar per fat sannolikt inte är psykologiskt lika dramatiskt som tidigare och vi kan mycket väl se så låga nivåer snart igen, även om utvecklingen under förra veckan drevs på av finansiella flöden.
Ingenting fundamentalt har egentligen förändrats sedan förra veckan: Amerikanska riggar har ökat med en i antal och över de senaste sex veckorna har de totalt ökat i antal med 37 stycken. Vad betyder det? Om vi tänker oss att dessa 37 nya riggar borrar två källor per månad och dessa källor i sin tur producerar genomsnittliga 500 fat per dag, så summerar den nya produktionen till cirka 250 000 fat per dag efter ett år – vilket i sanning är mycket olja och definitivt signifikant för prisbilden.
Inte minst på grund av detta är korta positioner enorma i omfattning, vilket förvisso säger en hel del om marknadens förväntningar, men också skapar en risk för en rekyl – som vi såg under förra veckan – i och med att investerare kan vilja täcka sina korta positioner, så kallad short covering, och på så vis driva upp priset.
Sammantaget ser vi potential för en rörelse ned mot förra veckans lägstanivåer och precis som att det minskade antalet oljeriggar i januari banade väg för ett högre pris har nu det högre antalet exakt motsatt effekt. OPEC gör heller ingenting, förutom att fortsätta att öka produktionen, samtidigt som marknaderna är negativa vad gäller Kinas utveckling. Risken i oljepriset är på nedsidan, med reservation för rekyler uppåt som resultat av en vilja att täcka korta positioner. Det är onekligen en intressant marknad just nu…
Bjarne Schieldrop
Chefsanalytiker råvaror
SEB
TREND
- Förra veckan noterades nya lägstanivåer för Brentoljan
- Priset över sitt 30 dagar glidande medelvärde för första gången sedan slutet av juni – skall ned och testa under denna nivå för att se om trenden verkligen är bruten
- Korta positioner i Brentolja mycket stora
- Vi tror att oljepriset kommer att trenda ned mot lägre nivåer, med risk för rekyler på grund av täckning av korta positioner
KAFFE
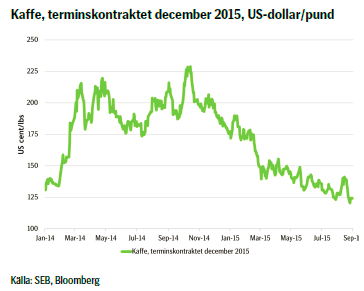 Sedan förra veckans uppdatering då vi initierade vår rekommendation har kaffepriset – för vår rekommendation otrevligt nog – rört sig uppåt. Rörelsen beror delvis på regionala faktorer – regn i Brasilien har fördröjt skörden, den brasilianska realen har stärkts mot US-dollarn och man drar därför ned på exporten och skörden är till cirka 85 procent bärgad, jämfört med ungefär 94 procent vid samma tid för ett år sedan och 90 procent av ett femårssnitt – men också på grund av mer tekniska faktorer: Exempelvis har de flesta råvaror, liksom flera börser, visat gröna siffror i något slags allmän rekyl uppåt efter den senaste tidens massiva ”risk-av”, det vill säga försäljning. US-dollarindex har stärkts samtidigt som kaffepriset har gått upp, vilket är omvänt mot vad som normalt och oftast ses.
Vidare har effekten varit teknisk, då investerare som har legat i korta positioner har täckt dem i och med förra veckans prisrörelse. Sådana effekter spär generellt på och accelererar utvecklingen, vilket i det här fallet också har drivit priset högre.
Tekniskt ser vi ett fortsatt tryck på nedsidan där priset fortsätter att röra sig i sin trendkanal nedåt, men bör testa att bryta ned genom den mot lägre nivåer. Priset handlades tydligt uppåt under augusti, men uppenbarligen vann säljarna det försöket, vilket ger en signal om vad marknaden tror är rätt riktning.
Sammantaget tror vi fortfarande på ett lägre kaffepris, även om volatiliteten, som vi konstaterade förra veckan, lär kvarstå. Därför ligger vi kvar i vår position med ett certifikat med en gångers hävstång och väntar in den vad vi bedömer som troliga, vidare nedgången. Rekommendationen är förvisso över en vecka, men en intresserad investerare kan sannolikt anlägga ett längre tidsperspektiv.
TREND
- Kaffepriset rekylerade uppåt under förra veckan baserat på både fundamentala liksom tekniska faktorer
- Täckning av kort risk spädde på utvecklingen
- Vi tror att kaffepriset kommer att fortsätta att trenda nedåt och ligger kvar i vår rekommendation
REKOMMENDATION
- BEAR KAFFE X1 S
SOCKER
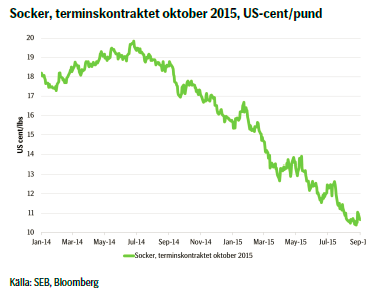 Sockerpriset har precis som kaffet fått stöd av den allmänna rörelsen mot högre nivåer i dyningarna efter den senaste tidens stora nedgångar relaterade till oro över Kinas tillväxt. Globala lager är dock som konstaterat mycket stora och även om den brasilianska realen har stärkts en del vilket har hämmat exporten från landet, kvarstår vyn att den över tid kommer att depreciera mot US-dollarn, det vill säga falla i värde. Detta kommer, allt annat lika, sannolikt att sätta press nedåt på priset.
Filipinerna, vilket är en stor exportör av socker, har dock i år endast skördat tillräckligt mycket för att täcka det inhemska behovet. Även detta har gett stöd åt priset.
Tekniskt ser vi att rörelsen nedåt börjar avta. Vid 11,60 US-cent per pund ser vi ett motstånd och vid 10,46 är nästa stöd, vilket också var den lägsta nivån som sågs efter tisdagen förra veckan. Med andra ord – vid den nivån är en signal att sälja och under den att sälja ytterligare då priset tekniskt har brutit igenom sitt stöd.
Fortfarande tror vi på att sockerpriset kommer att fortsätta på sin trend nedåt så fort de senaste dagarnas rekyl är klar. Därför fortsätter vi att ligga kvar i vår korta position. Det skall dock påpekas att trycket nedåt inte är lika tydligt längre som det tidigare har varit. Om vi skulle få se en rekyl uppåt i oljepriset på grund av att investerare täcker sina korta positioner, så kan det få genomslag i sockerpriset på grund av sockermarknadens exponering mot etanolindustrin. Då vi ligger i en kort position i socker bevakar vi därför hur oljepriset utvecklas, samtidigt som vi noga följer sockerprisets rörelse mot 10,46 US-cent per pund.
TREND
- Fortsatt global överproduktion av socker
- Volatil utveckling under veckan som varit men risken kvar på nedsidan
- Nästa stöd nedåt vid 10,46 US-cent per pund
- Vi ligger kvar i vår korta position i socker och bevakar stödnivån
REKOMMENDATION
- BEAR SOCKER X1 S
KOPPAR
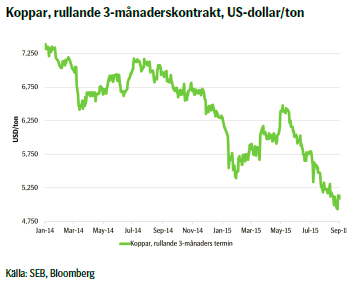 Marknaden för koppar har under flera år haft en bearish ton och den senaste tiden har det negativa sentimentet ytterligare spätts på av oro för den kinesiska efterfrågan.
Kort respektive lång positionering har under några månader varit tämligen konstant, samtidigt som forwardkurvan, som fortfarande är i backwardation, har blivit flackare; kanske på grund av något ökade lager. Mot bakgrund av det och med tanke på marknadens positionering och att konsensusestimatet för prognosen, som är mer eller mindre sidledes, känns det som om marknaden söker en riktning. Vi tror dock att den fortsatt är negativ och tar en kort position i koppar. De senaste dagarnas tickande uppåt i pris är som vi ser det ett bra tillfälle att gå kort, då vi tror på en rörelse nedåt i priset mot lägre nivåer. Tidsperspektivet är till en början en till två veckor. Vi bevakar marknaden noggrant och skulle produktionen störas eller marknaden börja kliva av sina korta positioner gör även vi det, då det finns risk för en volatil rörelse uppåt.
Någonting som alltid kan skapa volatilitet är att nästan en tredjedel av den globala produktionen av metallen sker i Chile och blir ibland störd av exempelvis kraftig nederbörd. Detta kan signifikant flytta marknaden, någonting som man måste vara medveten om när det gäller koppar.
TREND
- Negativ ton i marknaden
- Marknaden söker riktning med uppenbar risk på nedsidan
- Senaste tidens rörelse uppåt i pris bra tillfälle att gå kort
REKOMMENDATION
- BEAR KOPPAR X1 S – men bevaka en eventuell uppgång
EL
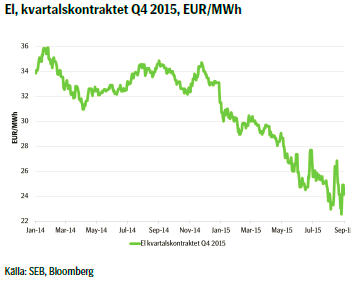 Priset på nordisk el rörde sig relativt kraftigt under förra veckan, där uppgången i kolpriset säkerligen hade en påverkan, då det rörde sig uppåt i pris mot bakgrund av lättnad-rallyt i marknaderna mot slutet av förra veckan. Detta ger direkt genomslag i elpriset. Oljeprisets rörelse påverkade sannolikt i mindre utsträckning, men bidrog definitivt till rörelsen uppåt. Utsläppsrätter, som har direkt påverkan på elpriset, rörde sig mer eller mindre sidledes över veckan men är i fortsatt trend uppåt i pris.
Den hydrologiska balansen, det vill säga hur mycket vatten som är tillgängligt i magasinen och potentiellt kan generera elektricitet; räknat i terrawattimmar, ligger på ett överskott kring 12 TWh jämfört med normalnivån. Det är mycket, men inte uppseendeväckande mycket och den kan lätt förändras över en tvåveckorsperiod beroende på vädret.
I det kortare perspektivet tror vi att elpriset kommer att fortsätta att röra sig sidledes och vi ser ingen avgörande faktor, förutom en kraftig omställning i vädret, som skulle kunna ändra dynamiken radikalt. En intresserad och aktiv investerare kan hur som helst fortsatt tjäna pengar på marknadens rörelser.
TREND
- Högre kolpris fick förra veckan genomslag i högre elpris
- Hydrologiska balansen i överskott
- Vi tror att elpriset kommer att fortsätta att röra sig huvudsakligen sidledes med möjligheter
AKTUELLA REKOMMENDATIONER
[box]SEB Veckobrev Veckans råvarukommentar är producerat av SEB:s Commodities Sales desk och publiceras i samarbete och med tillstånd på Råvarumarknaden.se[/box]
KÄLLOR
Bloomberg, Reuters, SEB
VILLKOR
För varje enskilt certifikat/mini future finns Slutliga Villkor som anger de fullständiga villkoren. Slutliga Villkor finns tillgängligt på kurssidan för respektive certifikat/mini future på www.seb.se, Börs & finans, fliken Strukturerade placeringar.
RISKER
En sammanfattning av de risker som är förknippade med Börshandlade certifikat generellt finns i Produktbroschyren för respektive certifikat eller mini future som är tillgängligt på seb.se/cert respektive seb.se/mini. För en fullständig bild av riskerna behöver du ta del av SEB:s offentliggjorda Grundprospekt för Certifikat- och Warrantprogram som är publicerat på www.seb.se/cert respektive seb.se/mini.
DISCLAIMER
Detta marknadsföringsmaterial, framtaget av SEB:s Commodities Sales desk, har upprättats enbart i informationssyfte.
Även om innehållet är baserat på källor som SEB bedömt som tillförlitliga ansvarar SEB inte för fel eller brister i informationen. Den utgör inte oberoende, objektiv investeringsanalys och skyddas därför inte av de bestämmelser som SEB har infört för att förebygga potentiella intressekonflikter. Yttranden från SEB:s Commodities Sales desk kan vara oförenliga med tidigare publicerat material från SEB, då den senare hänvisas uppmanas du att läsa den fullständiga rapporten innan någon åtgärd vidtas.
Dokumentationen utgör inte någon investeringsrådgivning och tillhandahålls till dig utan hänsyn till dina investeringsmål. Du uppmanas att självständigt bedöma och komplettera uppgifterna i denna dokumentation och att basera dina investeringsbeslut på material som bedöms erforderligt. Alla framåtblickande uttalanden, åsikter och förväntningar är föremål för risker, osäkerheter och andra faktorer och kan orsaka att det faktiska resultatet avviker väsentligt från det förväntade. Historisk avkastning är ingen garanti för framtida resultat. Detta dokument utgör inte ett erbjudande att teckna några värdepapper eller andra finansiella instrument. SEB svarar inte för förlust eller skada – direkt eller indirekt, eller av vad slag det vara må – som kan uppkomma till följd av användandet av detta material eller dess innehåll.
Observera att det kan förekomma att SEB, dess ledamöter, dess anställda eller dess moder- och/eller dotterbolag vid olika tillfällen innehar, har innehaft eller kommer att inneha aktier, positioner, rådgivningsuppdrag i samband med corporate finance-transaktioner, investment- eller merchantbanking-uppdrag och/eller lån i de bolag/finansiella instrument som nämns i materialet.
Materialet är avsett för mottagaren, all spridning, distribuering mångfaldigande eller annan användning av detta meddelande får inte ske utan SEB:s medgivande. Materialet riktar sig inte till personer vars medverkan kräver ytterligare prospekt, registrerings- eller andra åtgärder än vad som följer av svensk rätt. Det åligger var och en att iaktta sådana restriktioner. Materialet får inte distribueras i eller till land där distribution kräver ovan nämnda åtgärder eller strider mot reglering i sådant land. Materialet riktar sig således inte till fysiska eller juridiska personer hemmahörande i USA eller i något annat land där publicering eller tillhandahållande av materialet är förbjudet eller strider mot tillämpliga bestämmelser i landet.
Oaktat detta får SEB tillåta omfördelning av materialet till utvald tredje part i enlighet med gällande avtal. Materialet får inte spridas till fysiska eller juridiska personer som är medborgare eller har hemvist i ett land där sådan spridning är otillåten enligt tillämplig lag eller annan bestämmelse.
Skandinaviska Enskilda Banken AB (publ) är ett publikt aktiebolag och står under tillsyn av Finansinspektionen samt de lokala finansiella tillsynsmyndigheter i varje jurisdiktionen där SEB har filial eller dotterbolag.

The latest weekly report from the US DOE showed a substantial drawdown across key petroleum categories, adding more upside potential to the fundamental picture.

Commercial crude inventories (excl. SPR) fell by 5.8 million barrels, bringing total inventories down to 415.1 million barrels. Now sitting 11% below the five-year seasonal norm and placed in the lowest 2015-2022 range (see picture below).
Product inventories also tightened further last week. Gasoline inventories declined by 2.1 million barrels, with reductions seen in both finished gasoline and blending components. Current gasoline levels are about 3% below the five-year average for this time of year.
Among products, the most notable move came in diesel, where inventories dropped by almost 4.1 million barrels, deepening the deficit to around 20% below seasonal norms – continuing to underscore the persistent supply tightness in diesel markets.
The only area of inventory growth was in propane/propylene, which posted a significant 5.1-million-barrel build and now stands 9% above the five-year average.
Total commercial petroleum inventories (crude plus refined products) declined by 4.2 million barrels on the week, reinforcing the overall tightening of US crude and products.


A classic case of “buy the rumor, sell the news” played out in oil markets, as Brent crude has dropped sharply – down nearly USD 10 per barrel since yesterday evening – following Iran’s retaliatory strike on a U.S. air base in Qatar. The immediate reaction was: “That was it?” The strike followed a carefully calibrated, non-escalatory playbook, avoiding direct threats to energy infrastructure or disruption of shipping through the Strait of Hormuz – thus calming worst-case fears.
After Monday morning’s sharp spike to USD 81.4 per barrel, triggered by the U.S. bombing of Iranian nuclear facilities, oil prices drifted sideways in anticipation of a potential Iranian response. That response came with advance warning and caused limited physical damage. Early this morning, both the U.S. President and Iranian state media announced a ceasefire, effectively placing a lid on the immediate conflict risk – at least for now.
As a result, Brent crude has now fallen by a total of USD 12 from Monday’s peak, currently trading around USD 69 per barrel.
Looking beyond geopolitics, the market will now shift its focus to the upcoming OPEC+ meeting in early July. Saudi Arabia’s decision to increase output earlier this year – despite falling prices – has drawn renewed attention considering recent developments. Some suggest this was a response to U.S. pressure to offset potential Iranian supply losses.
However, consensus is that the move was driven more by internal OPEC+ dynamics. After years of curbing production to support prices, Riyadh had grown frustrated with quota-busting by several members (notably Kazakhstan). With Saudi Arabia cutting up to 2 million barrels per day – roughly 2% of global supply – returns were diminishing, and the risk of losing market share was rising. The production increase is widely seen as an effort to reassert leadership and restore discipline within the group.
That said, the FT recently stated that, the Saudis remain wary of past missteps. In 2018, Riyadh ramped up output at Trump’s request ahead of Iran sanctions, only to see prices collapse when the U.S. granted broad waivers – triggering oversupply. Officials have reportedly made it clear they don’t intend to repeat that mistake.
The recent visit by President Trump to Saudi Arabia, which included agreements on AI, defense, and nuclear cooperation, suggests a broader strategic alignment. This has fueled speculation about a quiet “pump-for-politics” deal behind recent production moves.
Looking ahead, oil prices have now retraced the entire rally sparked by the June 13 Israel–Iran escalation. This retreat provides more political and policy space for both the U.S. and Saudi Arabia. Specifically, it makes it easier for Riyadh to scale back its three recent production hikes of 411,000 barrels each, potentially returning to more moderate increases of 137,000 barrels for August and September.
In short: with no major loss of Iranian supply to the market, OPEC+ – led by Saudi Arabia – no longer needs to compensate for a disruption that hasn’t materialized, especially not to please the U.S. at the cost of its own market strategy. As the Saudis themselves have signaled, they are unlikely to repeat previous mistakes.
Conclusion: With Brent now in the high USD 60s, buying oil looks fundamentally justified. The geopolitical premium has deflated, but tensions between Israel and Iran remain unresolved – and the risk of missteps and renewed escalation still lingers. In fact, even this morning, reports have emerged of renewed missile fire despite the declared “truce.” The path forward may be calmer – but it is far from stable.
Analys
A muted price reaction. Market looks relaxed, but it is still on edge waiting for what Iran will do
Brent crossed the 80-line this morning but quickly fell back assigning limited probability for Iran choosing to close the Strait of Hormuz. Brent traded in a range of USD 70.56 – 79.04/b last week as the market fluctuated between ”Iran wants a deal” and ”US is about to attack Iran”. At the end of the week though, Donald Trump managed to convince markets (and probably also Iran) that he would make a decision within two weeks. I.e. no imminent attack. Previously when when he has talked about ”making a decision within two weeks” he has often ended up doing nothing in the end. The oil market relaxed as a result and the week ended at USD 77.01/b which is just USD 6/b above the year to date average of USD 71/b.

Brent jumped to USD 81.4/b this morning, the highest since mid-January, but then quickly fell back to a current price of USD 78.2/b which is only up 1.5% versus the close on Friday. As such the market is pricing a fairly low probability that Iran will actually close the Strait of Hormuz. Probably because it will hurt Iranian oil exports as well as the global oil market.
It was however all smoke and mirrors. Deception. The US attacked Iran on Saturday. The attack involved 125 warplanes, submarines and surface warships and 14 bunker buster bombs were dropped on Iranian nuclear sites including Fordow, Natanz and Isfahan. In response the Iranian Parliament voted in support of closing the Strait of Hormuz where some 17 mb of crude and products is transported to the global market every day plus significant volumes of LNG. This is however merely an advise to the Supreme leader Ayatollah Ali Khamenei and the Supreme National Security Council which sits with the final and actual decision.
No supply of oil is lost yet. It is about the risk of Iran closing the Strait of Hormuz or not. So far not a single drop of oil supply has been lost to the global market. The price at the moment is all about the assessed risk of loss of supply. Will Iran choose to choke of the Strait of Hormuz or not? That is the big question. It would be painful for US consumers, for Donald Trump’s voter base, for the global economy but also for Iran and its population which relies on oil exports and income from selling oil out of that Strait as well. As such it is not a no-brainer choice for Iran to close the Strait for oil exports. And looking at the il price this morning it is clear that the oil market doesn’t assign a very high probability of it happening. It is however probably well within the capability of Iran to close the Strait off with rockets, mines, air-drones and possibly sea-drones. Just look at how Ukraine has been able to control and damage the Russian Black Sea fleet.
What to do about the highly enriched uranium which has gone missing? While the US and Israel can celebrate their destruction of Iranian nuclear facilities they are also scratching their heads over what to do with the lost Iranian nuclear material. Iran had 408 kg of highly enriched uranium (IAEA). Almost weapons grade. Enough for some 10 nuclear warheads. It seems to have been transported out of Fordow before the attack this weekend.
The market is still on edge. USD 80-something/b seems sensible while we wait. The oil market reaction to this weekend’s events is very muted so far. The market is still on edge awaiting what Iran will do. Because Iran will do something. But what and when? An oil price of 80-something seems like a sensible level until something do happen.


Tightening fundamentals – bullish inventories from DOE

Jonas Lindvall är tillbaka med ett nytt oljebolag, Perthro, som ska börsnoteras

Oljan, guldet och marknadens oroande tystnad

Domstolen ger klartecken till Lappland Guldprospektering
Bombs to ”ceasefire” in hours – Brent below $70

Stor uppsida i Lappland Guldprospekterings aktie enligt analys

Brookfield ska bygga ett AI-datacenter på hela 750 MW i Strängnäs

Sommaren inleds med sol och varierande elpriser

OPEC+ ökar oljeproduktionen trots fallande priser

Silverpriset släpar efter guldets utveckling, har mer uppsida
-
 Nyheter3 veckor sedan
Stor uppsida i Lappland Guldprospekterings aktie enligt analys
-
 Nyheter4 veckor sedan
Brookfield ska bygga ett AI-datacenter på hela 750 MW i Strängnäs
-
 Nyheter4 veckor sedan
Sommaren inleds med sol och varierande elpriser
-
 Nyheter4 veckor sedan
OPEC+ ökar oljeproduktionen trots fallande priser
-
 Nyheter3 veckor sedan
Silverpriset släpar efter guldets utveckling, har mer uppsida
-
Analys4 veckor sedan
Brent needs to fall to USD 58/b to make cheating unprofitable for Kazakhstan
-

 Nyheter4 veckor sedan
Tradingfirman XTX Markets bygger datacenter i finska Kajana för 1 miljard euro
-

 Nyheter2 veckor sedan
Uppgången i oljepriset planade ut under helgen