

Analys
SEB – Jordbruksprodukter, vecka 9 2012

 Inledning
Den senaste veckan har prisförändringarna varit små. Ett par rörelser sticker ut och det är en prisuppgång på sojamjöl på uppemot 6% och en prisuppgång på Chicagovete med 3%. Intressant är att Chicagovetet stigit och Matifvetet fallit, när man räknar om båda till samma valuta. Av största vikt just nu är utsikterna för vädret under vår och sommar på norra halvklotet och storleken för skördebortfallet i Sydamerika. Vi går igenom detta i tur och ordning i det här brevet.
Vi måste också nämna Benny från FEDs mycket stramare finanspolitik. Den amerikanska centralbanken FED:s chef Ben Bernanke gav ett tal till Representanthuset idag, som hade stor påverkan på marknaden. Silverpriset föll som mest med 10% efteråt. Huvudbudskapet var att den amerikanska ekonomin tuffar på i oförändrad takt om 2.5% tillväxt på årsbasis. Han kommenterade finanspolitik och oljepris, men det var hans kommentarer om penningpolitiken som fick marknaden att skaka till. Han plockade inte upp stafettpinnen från ECB – som just nu fullkomligen sprutar ut friska pengar i euroland, 4300 miljarder kronor idag. Benny gav ingen indikation alls som skulle kunna tyda på ett nytt amerikanskt stimulanspaket, ett ”QE3” skulle kunna vara aktuellt. Detta fick guldpriset på fall och silverpriset tog i vanlig ordning ut svängen ännu mer. Basmetaller tyngdes också, däremot gick jordbruksprodukterna opåverkade ur dagen.
Väder
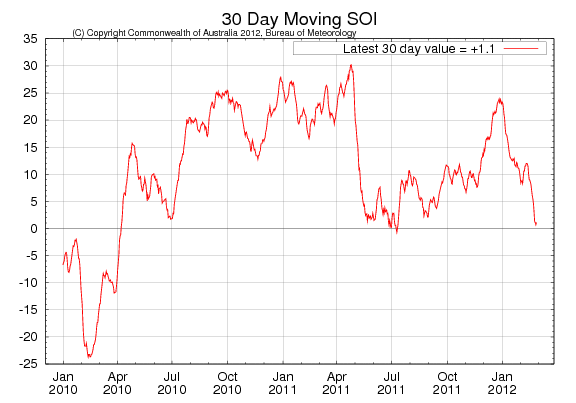
De senaste två veckorna har Southern Oscillation Index (“SOI”) fallit kraftigt och indikerar nu normala ENSO-förhållanden – alltså inget La Niña längre. Den senaste indexnoteringen, från den 26 februari ligger på +0.7. Ett värde > +8 innebär La Niña.
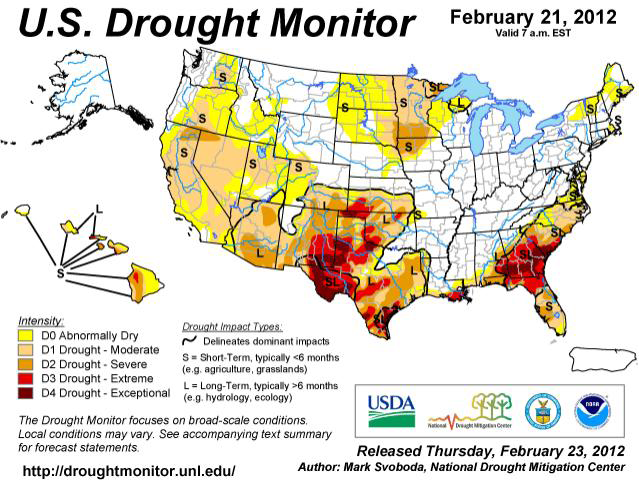
USA är som bekant torkdrabbat på grund av La Niña. Nedan ser vi ”US Drought Monitor”. Om det är någon gröda som råkat värst ut, så är det bomull. Det är rött både i det som kallas för ”Prairie Gateway” (västra Texas och uppåt) och ”Southern Seaboard” (norr om Florida).
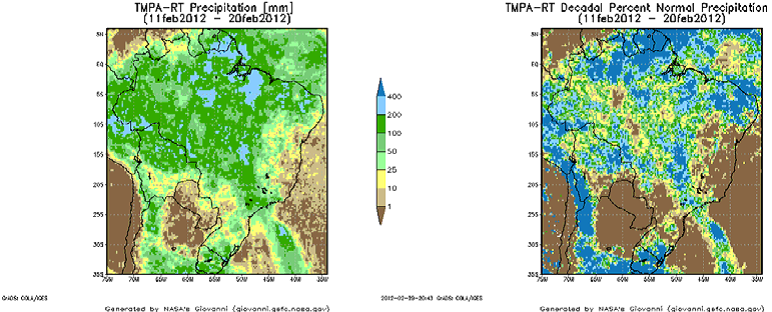
Sydamerikas väderleksprognos visar idag nära normal nederbörd i norra Argentina, Paraguay och södra Brasilien. Södra Argentina och centrala och norra Brasilien är torrare. I Sao Paulo är det smällhett och det har inte regnat på länge. Karnevalen slutade i lördags. Nedan ser vi två satellitbilder på nederbörden över södra Brasilien och norra Argentina för tiodagarsperioden 11 februari och 20 februari. Till vänster ser vi nederbörden och till höger avvikelse från normal nederbörd.
Södra Europa är mycket torrt, medan norra Europa som bekant är fuktigt. Storbritannien deklarerade tidigare i veckan ett område i södra landsänden som ”torkdrabbat”.
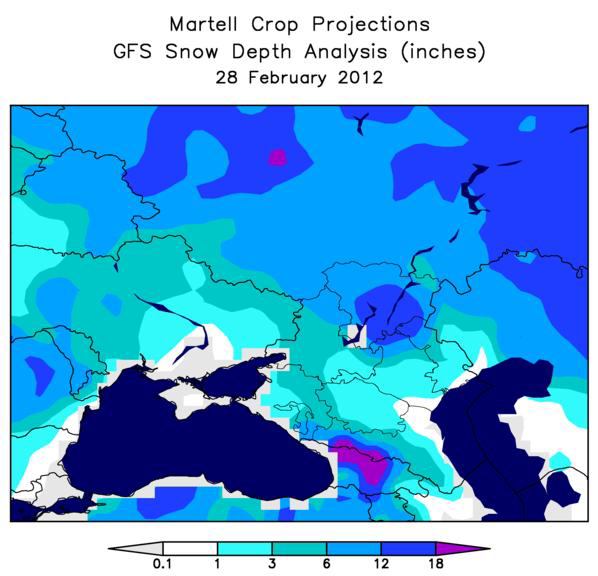
Från Ryssland och Ukraina har det kommit motstridiga uppgifter. Martell, som gör väderleksprognoser för lantbruket, skrev den 28 februari att snötäcket över huvuddelen av vinterveteområdena har varit tillräckliga och att vetet bör ha klarat sig bra trots extrem kyla. Nedan ser vi en bild på snödjupet (i tum).
Nederbörden har enligt Martell varit god, som vi ser i nedanstående bild.
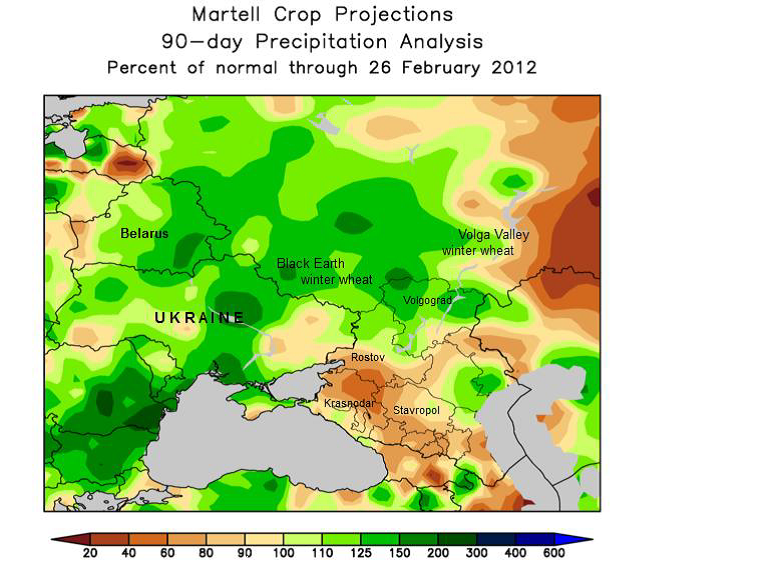
Det ryska jordbruksdepartementet väntar sig nu högre spannmålsexport för 2011/12 och siktar nu på 27 – 28 mt, mot tidigare 25 mt. Detta baserar sig sannolikt på en mer optimistisk bild av snötäcke och nederbörd. Detta är ett helt annat budskap än den oro för ett exportstopp per idag, 1 mars, som tidigare skrämde spannmålsmarknaden i världen.
Vädersituationen är alltså betydligt ljusare idag än den var för bara några veckor sedan, men mycket kan hända fram till skörd, förstås.
Vete
Vi börjar med att titta på hur terminspriskurvorna har förändrats de senaste 7 arbetsdagarna, där vi kan konstatera att den irrationella backwardation som finns i det europeiska kvarnvetet på Matif har minskat. Korta terminskontrakt har sjunkit mer än de med längre löptid. Sannolikt är det bönder i EU som börjat sälja från sina lager. Samtidigt har contangot i Chicagovetet minskat för där har korta terminskontrakt stigit mer än de med längre löptid. Vi förväntar oss att säljtrycket från europeiska bönder kommer att fortsätta och att backwardation kommer att fortsätta minska.
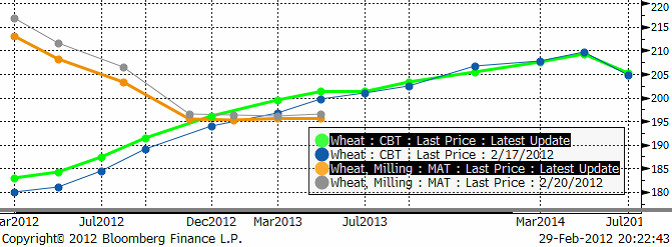
Prisnivån för t ex novemberleverans på Matif har inte förändrats så mycket. Nedan ser vi kursdiagrammet för detta:
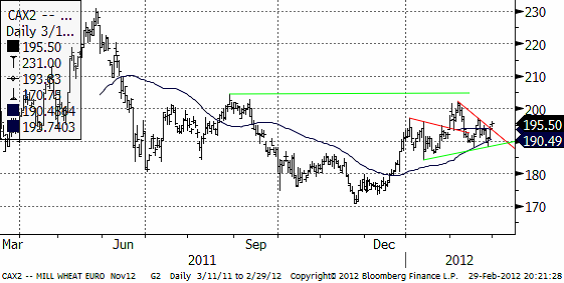
En kort teknisk kommentar till diagrammet ovan: Å ena sidan har uppgången från december förlorat momentum och man skulle kunna tolka kursrörelserna hittills i år som en vändningsformation innan en förestående nedgång. Å andra sidan är det mycket kortsiktiga motståndet (röd linje) bruten på uppsidan. Skulle vi få en uppgång torde 200 euro återigen vara ett ställe där många gärna vill sälja, ett naturligt motstånd. Det är en lite svårläst marknad, men vi fortsätter att vilja sälja novemberkontraktet utifrån ett tekniskt perspektiv.
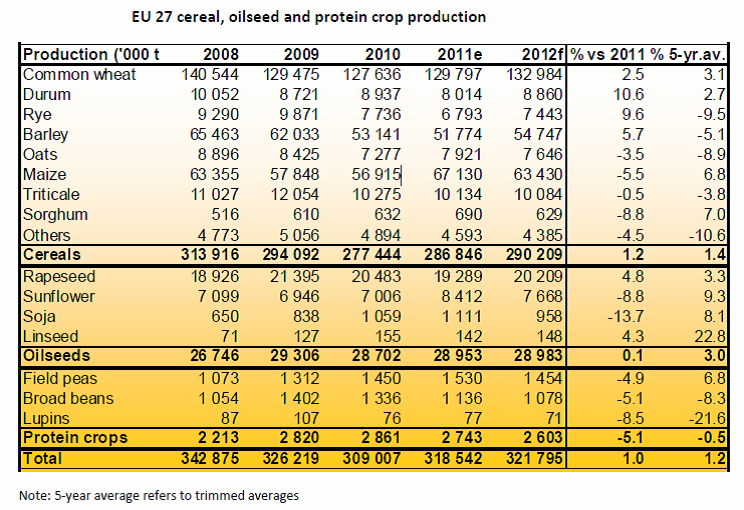
 IGC:s (International Grains Council) uppskattning av den globala veteproduktionen under 2011/12 har justerats upp med ytterligare 5 mt, jämfört med januari-rapporten, till rekordhöga 695 mt (ca 2 mt högre än USDA:s senaste prognos) vilket delvis återspeglar högre estimat för Kazakstan, Indien och Australien. Prognosen för globala utgående lager för vete 2011/12 justeras upp med 7 miljoner ton till 211 mt, en ökning med 8% jämfört med 196 mt 2011.
Inför det kommande skördeåret 2012/13 förväntas den globala vete arealen öka med 1.5% och medan grödorna har utvecklats relativt väl på norra halvklotet, finns en fortsatt oro över hur torkan kommer att påverka delar av Ukraina och USA. Den genomsnittliga avkastningen kommer troligtvis inte att matcha föregående års höga siffror och den globala produktionen beräknas därför minska med 15 mt till 680 mt.
Från höga lager av vete och en ökning i produktionen av majs och korn i år (vilket sannolikt kommer att minska användningen av fodervete) förväntas endast en blygsam nedgång i utgående lager för 2012/13 jämfört med de förväntade rekordnivåerna den här säsongen.
Europeiska kommissionen skriver i sin prognos att höstsådden under 2011 inför årets skörd har ökat i de flesta länderna, med undantag för Sverige och Danmark där dåliga väderförhållanden påverkade sådden.
Oro finns också att den köldperiod som drabbade Europa i slutet av januari kan komma att påverka grödorna i delar av Väst och Östeuropa. En annan väderrelaterad oro är bristen på nederbörd i vissa delar av Portugal och Spanien, som vi nämnt ovan.
Kommissionen uppskattar att årets veteskörd kommer att uppgå till strax under 133 mt, vilket är en ökning med ca 3.2 mt jämfört med 2011 och bygger på en förväntad avkastning om 5.7 ton per hektar, vilket skulle vara högre än genomsnittet och det bästa resultatet på fyra år, trots en eventuell påverkan av köldknäppen tidigare den här månaden. En ökad sådd areal om 133 000 hektar borde också göra sitt till och den totala arealen för vete förväntas uppgå till 23.3 m hektar, vilket är mer än de estimerade 23.0 m hektar från den franska analysfirman Strategie Grains för två veckor sedan.
Ökad produktion och minskad konsumtion kommer att öka Europas utgående lager av vete i slutet av 2012/13 till 15.1 mt, enligt kommissionen. Användandet av vete som foderingrediens och efterfrågan på vete från etanolanläggningar förväntas minska.
Från Kina har kommit prognoser på en 46 mt lägre spannmålsskörd jämfört med förra årets rekord på 571 mt. Det har också talats om att använda vete som foder där. Kina är ett observandum, men annars bör det bli en press nedåt på vetepriset i världen framöver.
Maltkorn
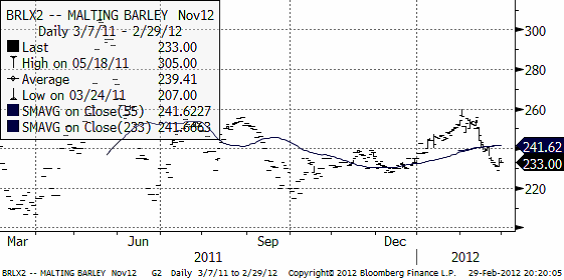
Novemberkontraktet på maltkorn har handlats ner 1.25 euro sedan förra veckans brev. Vi finner inga specifika nyheter.
Potatis
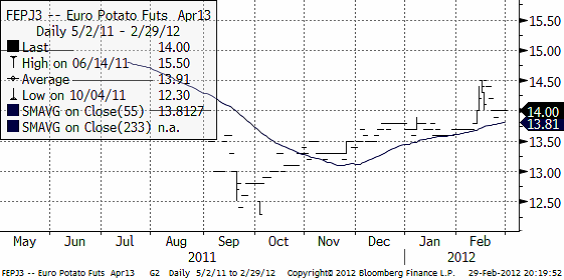
Priset på industripotatis för leverans nästa år är oförändrat. För leverans i år har priset handlats ner ungefär 5%, dvs mer av samma sak som präglat marknadsföringsåret hela tiden.
Majs
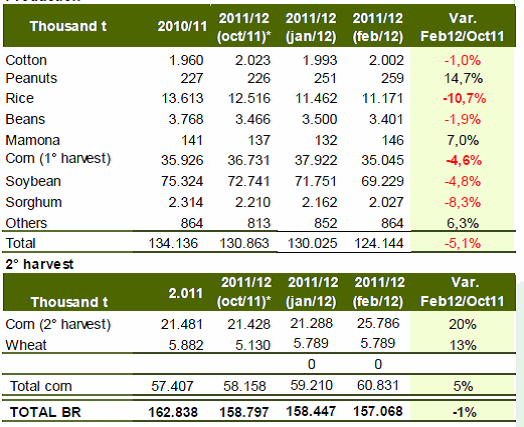
Brasilien är nu i full fart med Safrinha, den andra skörden, som enligt Conabs senaste prognos väntas bli 25.8 mt istället för 21.3 mt, som man trodde i januariprognosen. Det kompenserar mer än väl bortfallet av den första skörden, som skadades av torka.
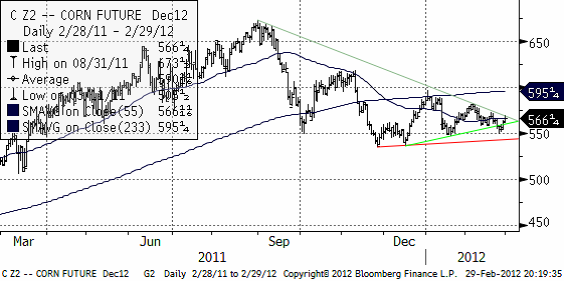
Nedan ser vi decemberkontraktet på majs på CBOT, där priserna bildat en klassisk ”triangelformation”. Vi skrev om detta redan förra veckan, men något utbrott har ännu inte inträffat – bortsett från ett falskt utbrott på nedsidan. Ett falskt utbrott brukar följas av en ordentlig rörelse åt andra hållet. Det återstår att se, men ett brott uppåt måste tas på allvar. Vi får ha en neutral rekommendation för tillfället.
Sojabönor
Det kortaste terminskontraket på CBOT stängde över 13 dollar för första gången på fem månader igår. Privata analysfirmor fortsätter att prognosticera Sydamerikas skörd 14 mt lägre än förra året. Novemberterminen närmar sig också 13 dollar, som vi ser i diagrammet nedan. Motståndet från toppen i oktober är passerad, men priset har kommit upp i det intervall som priset låg i för ett år sedan och som hade sin topp på 14 dollar. 13 dollar är ändå sannolikt en naturlig nivå där det troligtvis finns säljare som väntar.
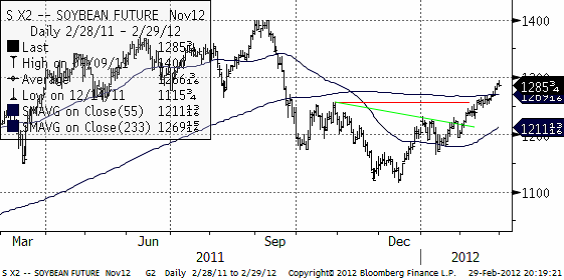
Vi skulle vilja sälja november på den här nivån vid 13 dollar per bushel.
Raps
Novemberkontraktet föll kraftigt efter det förra veckobrevet, men återhämtade sig med ännu större kraft. Priset ligger nu bara 1.75 euro från 440. Det är en nivå där vi absolut skulle vilja sälja.
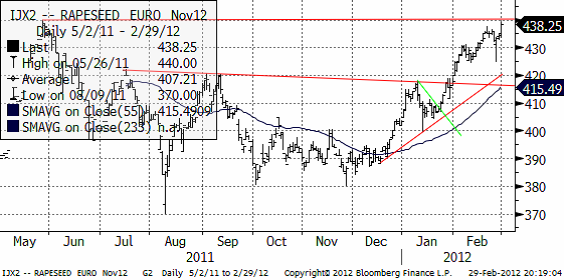
Trots att sådden av kanadensisk canola inte startar förrän i mitten av april har prognoser över arealen redan börjat komma med variationer mellan 7.85 m hektar till 8.49 m hektar. Om dessa siffror stämmer skulle det vara klart över 2011 års areal på 7.54 m hektar. Prognoser från Wild Oats Grainworld konferensen i Winnipeg uppskattar att canola kan komma att bli årets stora vinnare då estimat visar att för första gången någonsin kommer sådd areal för canola att överstiga sådd areal för vete (exkl durum) Skörden av canola blev större än skörden av vete förra året men det berodde på det stora bortfallet av vete på grund av de omfattande översvämningarna, särskilt i södra Manitoba. I år blir det absolut inte några översvämningar.
Den Europeiska kommissionen uppskattar EU-27’s produktion av raps till 20,2 mt för 2012, en ökning från det estimerade 19,1 mt under 2011. Trots en ökad produktion i år förväntas utgående lager bli låga, runt 1 mt, vilket understryker behovet för Europa att fortsätta importera raps.
Prognoserna för både Kanada och Europa är dock väldigt preliminära i detta tidiga skede och beror i mångt och mycket på förhållandena vid vårsådden samt väder under växtperioden.
Efter två bra säsonger för australiensisk canola tror AOF att även detta år kommer att bli bra. Produktionen för 2011 beräknas till 3 mt, men skulle kunna uppgå till så mycket som 3.3 mt. Den slutliga siffran kommer dock inte att presenteras förrän nästa månad. När det gäller canola behöver lantbrukaren bestämma sig runt april om det är den grödan som ska sås och vid den tiden förra året var priset på oljeväxter attraktiva i jämförelse med priset på vete vilket ledde till att en större areal än vanligt såddes med canola, 1.8 m hektar jämfört med 1.6 m hektar året innan.
Mjölk
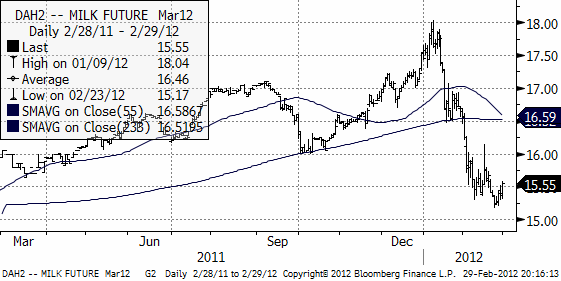
För en vecka sedan låg priset på 15.37. Det blev en liten sväng nedåt, men sedan vände priset upp till 15.55 senast. Liksom vi skrev för en vecka sedan, tyder det mesta på att prisfallet är över. Det bör vara möjligt för marknaden att hämta tillbaka lite av fallet. Vid 16 ser vi att folk i oktober i alla fall, tyckte att 16 var en viktig nivå. På uppsidan kan vi nog därför gissa att en del kommer att reagera med säljordrar.
Gris
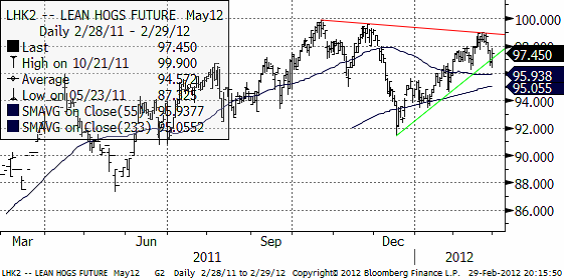
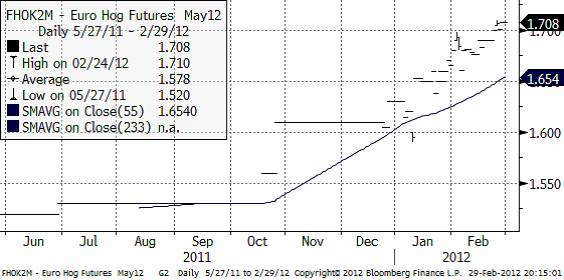
Majkontraktet orkade inte igenom motståndet (röd linje) utan föll av. Priset har nu också brutit den uppåtgående stödlinjen (grön) och det signalerar ett kortsiktigt trendbrott nedåt. Vi är negativa till priset på Lean Hogs. Priset i Europa har för majleverans stigit från 1.69 till 1.708 euro per kilo den senaste veckan.
Valutor
EURSEK
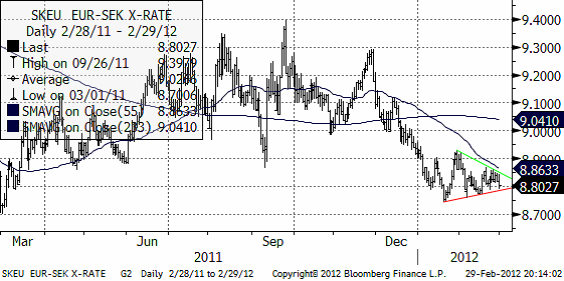
Läget är oförändrat från förra veckan: En ”triangelformation” har bildats sedan mitten av januari. Man bör invänta riktningen på utbrottet från den för att fatta beslut om att köpa eller sälja eursek. 8.70 har tidigare varit ett starkt ”golv” för växelkursen.
EURUSD
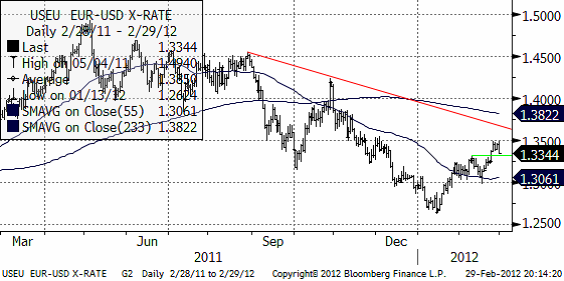
Euron steg mot dollarn, men efter ECB:s pengatryckeri och Ben Bernankes återhållsamhet föll euron idag, dock inte signifikativt ur ett tekniskt perspektiv.
USDSEK
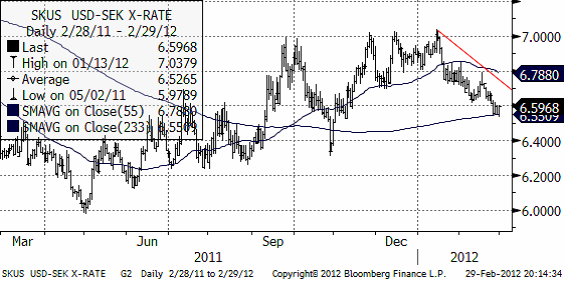
Dollarn ligger för närvarande i sjunkande trend, men är nere på en nivå där det tidigare funnits stöd.
[box]SEB Veckobrev Jordbruksprodukter är producerat av SEB Merchant Banking och publiceras i samarbete och med tillstånd på Råvarumarknaden.se[/box]
Disclaimer
The information in this document has been compiled by SEB Merchant Banking, a division within Skandinaviska Enskilda Banken AB (publ) (“SEB”).
Opinions contained in this report represent the bank’s present opinion only and are subject to change without notice. All information contained in this report has been compiled in good faith from sources believed to be reliable. However, no representation or warranty, expressed or implied, is made with respect to the completeness or accuracy of its contents and the information is not to be relied upon as authoritative. Anyone considering taking actions based upon the content of this document is urged to base his or her investment decisions upon such investigations as he or she deems necessary. This document is being provided as information only, and no specific actions are being solicited as a result of it; to the extent permitted by law, no liability whatsoever is accepted for any direct or consequential loss arising from use of this document or its contents.
About SEB
SEB is a public company incorporated in Stockholm, Sweden, with limited liability. It is a participant at major Nordic and other European Regulated Markets and Multilateral Trading Facilities (as well as some non-European equivalent markets) for trading in financial instruments, such as markets operated by NASDAQ OMX, NYSE Euronext, London Stock Exchange, Deutsche Börse, Swiss Exchanges, Turquoise and Chi-X. SEB is authorized and regulated by Finansinspektionen in Sweden; it is authorized and subject to limited regulation by the Financial Services Authority for the conduct of designated investment business in the UK, and is subject to the provisions of relevant regulators in all other jurisdictions where SEB conducts operations. SEB Merchant Banking. All rights reserved.

Market is starting to take US/Iran headlines with a pinch of salt. Brent crude rose $2.8/b yesterday to an official close of $112.1/b. But after that it traded as low as $108.05/b before ending late night at around $109.7/b. Through the day it traded in a range of $106.87 – 112.72/b amid a flurry of news or rumors from Iran and the US. ”US temporary sanctions during negotiations” (falls alarm). ”We will bomb Iran” (not anyhow),… etc. While the market is still fluctuating to this kind of news flow, it is starting to take such headlines with a pinch of salt.

We’ll see. Maybe, maybe not. The Brent M1 contract is trading at $110.2/b this morning which very close to the average ticks through yesterday of $110.4/b.
Trump with bearish, verbal intervention whenever Brent trades above $110/b it seems. What seems to be a pattern is that Trump states something like ”very good negotiations going on with Iran”, ”New leaders in Iran are great,..”, ”Great progress in negotiations,…”, ”Deal in sight,..” etc whenever the Brent M1 contract trades above $110/b. An effort to cool the market. These hot air verbal interventions from Trump used to have a heavy bearish impact on prices, but they now seems to have less and less effect unless they are backed by reality.
As far as we can see there has been no real progress in the negotiations between the US and Iran with both sides still standing by their previous demands.
Iran is getting stronger while the cease fire lasts making a return to war for Trump yet harder. Iran is naturally in constant preparation for a return to war given Trump’s steady threats of bombing Iran again. Iran is naturally doing what ever is possible to prepare for a return to war. And every day the cease fire lasts it is better prepared. This naturally makes it more and more difficult and dangerous for the US to return to warring activity versus Iran as the consequences for energy infrastructure in the Persian Gulf will be more and more severe the longer the cease fire lasts. Israel seems to see it this way as well. That the war is not won and that current frozen state of a cease fire gives Iran opportunity to rebuild military and politically.
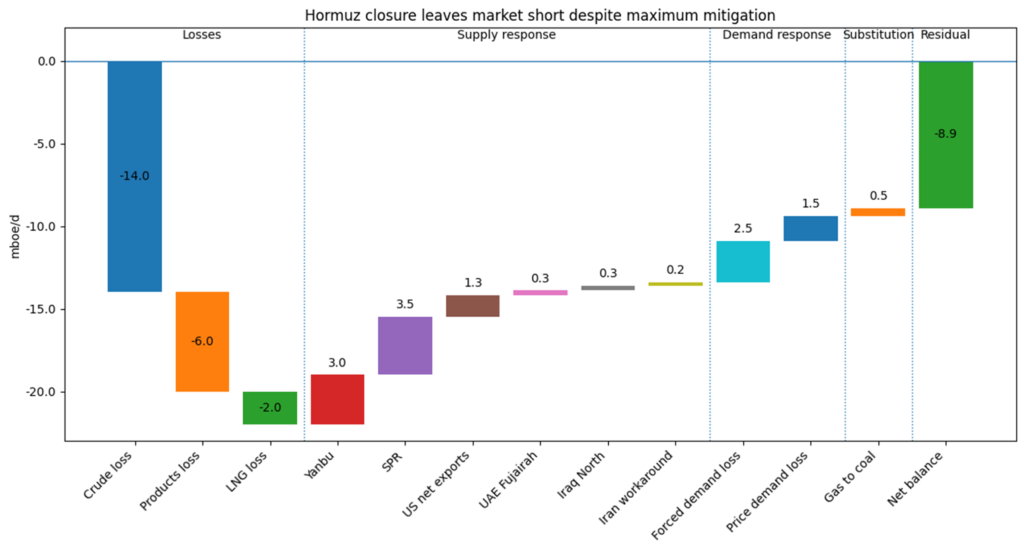
Global inventories are drawing down day by day. How much? In the meantime the Strait of Hormuz stays closed. There is varying measures and estimates of how much global inventories are drawing down. Our rough estimate, back of the envelope, is that global inventories are drawing down by at least some 10 mb/d or about 300 mb/d in a balance between loss of supply versus demand destruction. Other estimates we see are a monthly draw of 250-270 mb/d. The IEA only ’measured’ a draw in global observable stocks of 117 mb in April with oil on water rising 53 mb while on shore stocks fell 170 mb. But global stocks are hard to measure with large invisible, unmeasured stocks. As such a back of the envelope approach may be better.
Oil products is what the world is consuming. Oil product prices likely to rise while product stocks fall. Strategic Petroleum Reserves (SPR) are predominantly crude oil. Discharging oil from OECD SPR stocks, a sharp reduction in Chinese crude imports and a reduction in global refinery throughput of 6-7 mb/d has helped to keep crude oil markets satisfactorily supplied. But global inventories are drawing down none the less. And oil products is really what the world is consuming. So if global refinery throughput stays subdued, then demand will eventually have to match the supply of oil products. The likely path forward this summer is a steady draw down in jet fuel, diesel and gasoline. Higher prices for these. Then, if possible, higher refinery throughput and higher usage of crude in response to very profitable refinery margins. And lastly sharper draw in crude stocks and higher prices for these. But some 6 mb/d of oil products used to be exported through the Strait of Hormuz. And it may not be so easy to ramp up refinery activity across the world to compensate. Especially as Ukraine continues to damage Russian refineries as well as Russian crude production and export facilities.
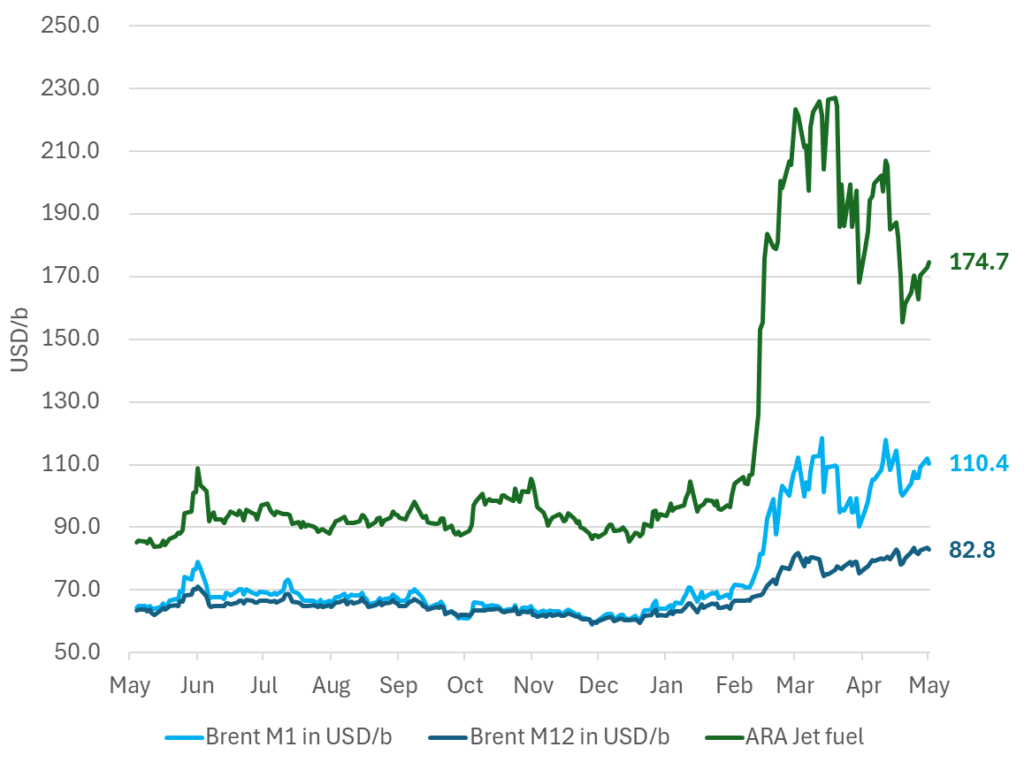
Watch oil product stocks and prices as well as Brent calendar 2027. What to watch for this summer is thus oil product inventories falling and oil product premiums to crude rising. Another measure to watch is the Brent crude 2027 contract as it rises steadily day by day as the Strait of Hormuz stays closed and global oil inventories decline. The latter is close to the highest level since the start of the war and keeps rising.
The Brent M1 contract and the Brent 2027 prices and current price of jet fuel in Europe (ARA). All in USD/b
Our back of the envelope calculation of the global shortage created by the closure of the Strait of Hormuz. Note that 3.5 mb/d of discharge from SPR is also a draw. Note also that ’Forced demand loss’ of 2.5 mb/d is probably temporary and will fall back towards zero as logistics are sorted out leaving ’Price demand loss’ to do the job of balancing the market. Thus a shortfall of at least 9 mb/d created by the closure. More if SPR discharge is included and more if Forced demand loss recedes.
Brent is climbing higher. Front-month is at USD 106.3/bl this morning, close to a weekly high and a USD 9/bl jump from Mondays open. This is the move we flagged as a risk earlier in the week: the market shifting from ”a deal is around the corner” to ”this is going to take longer than we thought”.

Analyst Commodities, SEB
During April, rest-of-year Brent remained remarkably stable around USD 90/bl. A stability which rested on one single assumption: the SoH reopens around 1 May. That assumption is now slowly falling apart.
As we highlighted yesterday: every week of delay beyond 1 May adds (theoretically) ish USD 5/bl to the rest-of-year average, as global inventories draw 100 million barrels per week. i.e., a mid-May reopening implies rest-of-year Brent closer to USD 100/bl, and anything pushing into June or July takes us meaningfully higher.
What’s changed in the last 48 hours:
#1: The US military has formally warned that clearing suspected sea mines from SoH could take up to six months. That is a completely different timescale from what the financial market is pricing. Even a political deal tomorrow does not immediately reopen the strait.
#2: Trump has shifted his tone from urgency to ”strategic patience”. In yesterday’s press conference: ”Don’t rush me… I want a great deal.” The market is reading this as a president no longer feeling pressured by timelines, with the naval blockade running in the background.
#3: So far, the military activity is escalating, not de-escalating. Axios reports Iran is laying more mines in SoH. The US 3rd carrier strike group (USS George H.W. Bush) is arriving with two countermine vessels. Trump yesterday ordered the US Navy to destroy any Iranian boats caught laying mines. While CNN reports that the Pentagon is actively drawing up plans to strike Iranian SoH capabilities and individual Iranian military leaders if the ceasefire collapses. i.e., NOT a attitude consistent with an imminent deal!
Spot crude and product prices eased off the early-April highs on a combination of system rerouting and deal optimism. Both now weakening. Goldman estimates April Gulf output is reduced by 14.5 mbl/d, or 57% of pre-war supply, a number that keeps getting worse the longer this drags on.
Demand-side adaptation is ongoing: S. Korea has cut its Middle East crude dependence from 69% to 56% by pulling more from the Americas and Africa, and Japan is kicking off a second round of SPR releases from 1 May. But SPRs are finite.
Ref. to the negotiations, we should not bet on speed. The current Iranian leadership is dominated by genuine hardliners willing to absorb economic pain and run the clock to extract concessions. That is not a setup for a rapid resolution. US/Israeli media briefings keep framing the delay as ”internal Iranian divisions”, the reality is more complicated and points toward weeks and months, not days.
Our point is that the complexity is large, and higher prices have only just started (given a scenario where the negotiations drag out in time). The market spent April leaning on the USD 90/bl rest-of-year assumption; that case is diminishing by the hour. If ”early May reopening” is replaced by ”June, July or later” over the next week or two, both crude and products have meaningful room to reprice higher from here. There is a high risk being short energy and betting on any immediate political resolution(!).
Down on Friday. Up on Monday. The Brent June crude oil contract traded down 5.1% last week to a close of $90.38/b. It reached a high of $103.87/b last Monday and a low of $86.09/b on Friday as Iran announced that the Strait of Hormuz was fully open for transit. That quickly changed over the weekend as the US upheld its blockade of Iranian oil exports while Iran naturally responded by closing the SoH again. The US blew a hole in the engine room of the Iranian ship TOUSKA and took custody of the ship on Sunday. Brent crude is up 5.6% this morning to $95.4/b.
The cease-fire is expiring tomorrow. The US has said it will send a delegation for a second round of negotiations in Islamabad in Pakistan. But Iran has for now rejected a second round of talks as it views US demands as unrealistic and excessive while the US is also blocking the Strait of Hormuz.
While Brent is up 5% this morning, the financial market is still very optimistic that progress will be made. That talks will continue and that the SoH will fully open by the start of May which is consistent with a rest-of-year average Brent crude oil price of around $90/b with the market now trading that balance at around $88/b.
Financial optimism vs. physical deterioration. We have a divergence where the financial market is trading negotiations, improvements and resolution while at the same time the physical market is deteriorating day by day. Physical oil flows remain constrained by disrupted flows, longer voyage times and elevated freight and insurance costs.
Financial markets are betting that a US/Iranian resolution will save us in time from violent shortages down the road. But every day that the SoH remains closed is bringing us closer to a potentially very painful point of shortages and much higher prices.
The US blockade is also a weapon of leverage against its European and Asian allies. When Iran closed the SoH it held the world economy as a hostage against the US. The US blockade of the SoH is of course blocking Iranian oil exports. But it is also an action of disruption directed towards Europe and Asia. The US has called for the rest of the world to engaged in the war with Iran: ”If you want oil from the Persian Gulf, then go and get it”. A risk is that the US plays brinkmanship with the global oil market directed towards its European and Asian allies and maybe even towards China to force them to engage and take part. Maybe unthinkable. But unthinkable has become the norm with Trump in the White House.




Sommarväder skapar prisrally på elbörsen
Oil product price pain is set to rise as the Strait of Hormuz stays closed into summer

Solkraften pressar elpriserna dagtid

Michel Gubel ger sin syn på oljemarknaden