Analys
SEB – Jordbruksprodukter, vecka 49
 Idag träffas EU-ledarna och besked väntas imorgon. Troligtvis blir det mer av pompa och mindre av en lösning, även om de alltså kommer att påstå det. Den politiska debatten är inriktad på sparande i statsbudgetarna i problemländerna. Problemet är dock ett klassiskt fall av för dålig konkurrenskraft för Spanien, Italien, Grekland, Portugal, delvis Frankrike, pga att lönerna och kostnaderna är för höga i förhållande eurons växelkurs för dessa länder i förhållande till andra länder.
Dessa länder borde antingen göra en ”intern devalvering”, som Estland gjorde, eller en devalvering som Sverige tvingades till 1992. Att fortsätta att ha kvar en fast växelkurs (euron) dödar ekonomin i dessa länder, som gör det än mer akut att devalvera (dvs lämna euron eller sänka lönerna). Hade Bengt Dennis fått hållas med 500% ränta i Sverige hade det inte funnits ett enda företag kvar 1992- 1993. Och konkursade företag återuppstår inte. Alltså, eftersom politikerna inte insett vad som är problemet och försöker ”spara” sig ur detta – alltså slå ut ekonomin ännu fortare, skyndar man bara på den totala kollapsen.
Till slut kommer inget alternativ återstå förutom att trycka pengar och inflatera bort skulderna, men än så länge kommer det bara att blir värre. Missförstå mig inte, inflation är ingen bra lösning, något av en katastrof för ekonomisk hälsa, men skulder måste betalas och det enklaste sättet är att trycka upp pengarna för det.
USDA:s WASDE-rapport imorgon är inte komplett och brukar inte ge någon effekt alls på marknaden.
Globalt väder
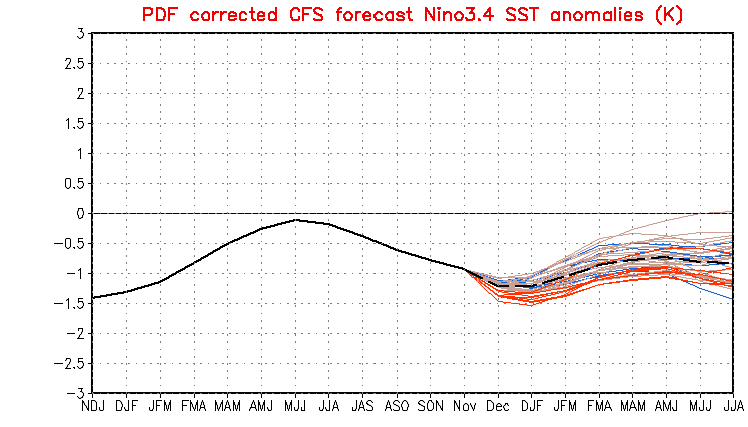
Nedan ser vi ensembleprognosen för La Niña från den 5 december och framåt. Ensembleprognosen är den streckade svarta linjen och den antyder att La Niña ska fortsätta att stärkas under våren 2012 och att den hänger kvar under sommaren.
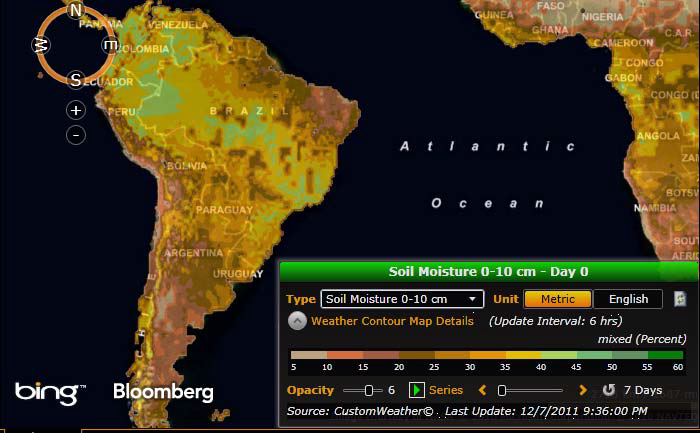
Nedan ser vi markfuktigheten på 0 – 10 cm djup. Vi ser att det är torrt i Argentina och i södra Brasilien.
Vete
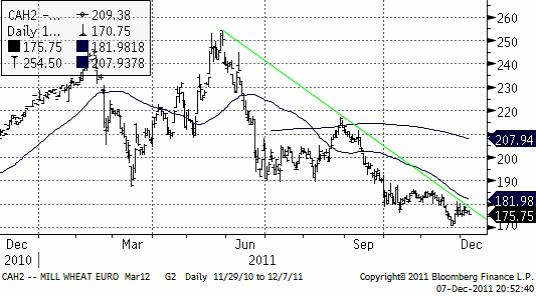
Terminspriset på Matif-vete (mars) har handlats i spannet 174.75 eur – 179.00 eur sedan förra veckan. Viss fundamenta har angett riktning för priset men marknaden påverkas också i nuläget av den oro som råder över den ekonomiska krisen i Europa. Aktiviteten har dock varit låg i avvaktan på fredagens WASDE rapport och utgången av EU-toppmötet.
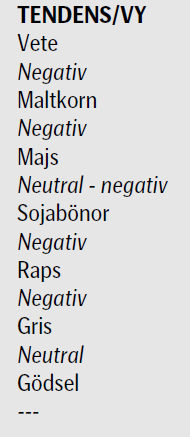 Det ukrainska jordbruksministeriet gick i fredags ut och meddelande att för nästa års veteskörd, 2012/13, så kommer produktionen endast att uppgå till 8.5 MT till skillnad mot 22.2 MT för 2011/12.
Man ska dock ta dessa uppgifter med en nypa salt då det fortfarande är tidigt att sia om nästa års skörd men OM de skulle stämma så skulle det vara vara ett stort bortfall för landet och det fick också terminspriserna att stiga ordentligt.
Sedan tog den ekonomiska oron över igen och terminspriserna föll tillbaka under måndag kväll efter att ratinginstitutet Standard & Poors beslutat att sätta 15 av de 17 euroländerna under bevakning med negativa utsikter.
Svartahavs-ländernas dominans på exportmarknaden av vete till Egypten bröts i tisdags då Argentina klev in på scenen och tog hem försäljningen av 180 000 ton (den första för den här säsongen).
Ryssland gick dock inte helt lottlösa i denna budgivning men bidrar med en ”mindre” del denna gång, 60 000 ton. Priserna på det europeiska vetet är fortfarande inte konkurrenskraftiga nog mot länderna ovan och Frankrike räknar med ett bortfall i sin export till Egypten på ca 90 % för 2011/12.
USA var inte med denna gång heller.
Vintertid brukar betyda logistikproblem för FSU-länderna. Kazakhstan hyrde in 5000 godsvagnar från Ryssland i ett försök att underlätta logistiken av sin rekordskörd, men har istället fått problem med åtkomsten till exporthamnar eftersom dessa ligger hos Ryssland och Ukraina som själva har fullt upp med att få ut sitt spannmål på marknaden. I väntan på att grannarna ska bli klara med sin export används godsvagnarna istället till lagring av spannmål.
Australien håller som bäst på att skörda det som som enligt ABARES förväntas bli en rekordsköd.
Även om regnet har ställt till det en del vad gäller kvalitén så finns det gott om köpare i Asien som ser fram emot att ersätta dyr majs med billigare vete från ”down under” till lägre kostnader och i försök att stävja de stigande matpriserna.
Även kanadensiska StatCan rapporterar om ökad veteproduktion för året med en uppgång på 9% eller 2.1 MT från 2010 och där framförallt durumvetet står för en stor del av ökningen.
Alexander Solovyev, vice jordbruksminister i Ryssland sade igår att den ryska exporten under marknadsföringsåret kan nå minst 25 mt. USDA väntar sig 19 mt enligt den senaste WASDErapporten.
Detta var alltså negativa nyheter för priset.
Solovyev menade också att exporten kan fördubblas de kommande 15 – 20 åren pga högre skörd per hektar och ökad areal. Allt tyder på att vetepriset ska ner.
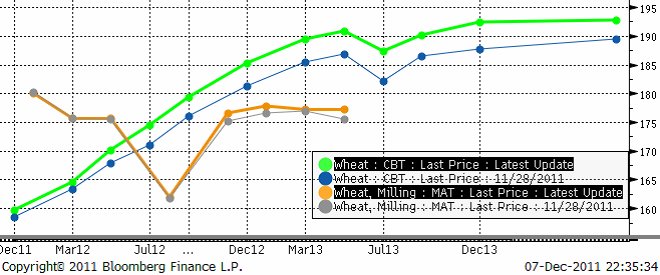
Nedan ser vi terminskurvan för Chicagovete och Matif nu och för en vecka sedan. De ”feta” kurvorna är de aktuella. De ”smala” är förra veckans. Matif är nästan inte förändrat alls, medan priserna gått upp i Chicago – för längre löptider. Bakom ligger oro för kommande skörd pga La Niña kanske och förmodligen också för att räntorna (som man kan låna till) är högre.
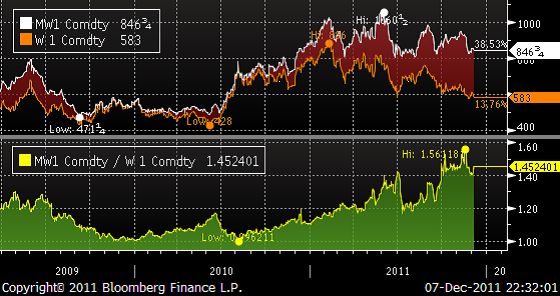
Högproteinvete har blivit allt mer av en bristvara. Det vete som handlas på terminsbörser är det amerikanska vårvetet ”Red Spring” på Minneapolis Grain Exchange. Priset på det har dragit iväg i förhållande till ”kak-vetet” som handlas på Chicago Board of Trade. Nedan ser vi att spotkontraktet på MGX handlas 45% högre än CBOT:s.
Allt talar för att Matif-vete faller ner i första hand till 150 – 160 – euro-nivån.
Maltkorn
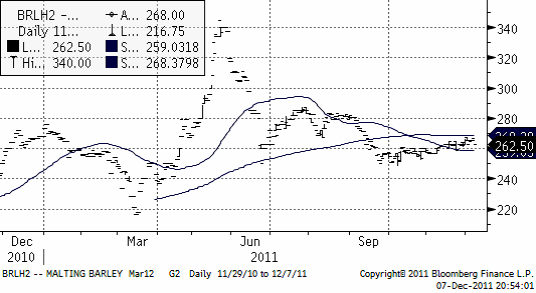
Maltkornsmarknaden följer vetet och det finns inga speciella nyheter att rapportera. Tekniskt ligger priset under glidande medelvärden. Den tekniska trenden är alltså nedåtriktad.
Potatis
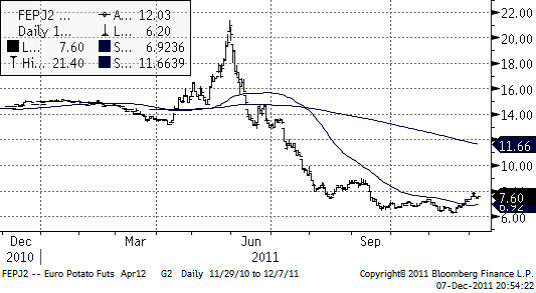
Priset på potatis av årets skörd fortsatte stiga i veckan, ännu en vecka. Rapporten kom från Jordbruksverket tidigare i veckan om en betydligt högre skörd av matpotatis i Sverige, men informationen nådde alltså marknaden redan på försommaren, när priserna började falla.
Nedan ser vi kursdiagrammet på europeisk potatis, som handlas på Eurex; terminen avser leverans april nästa år.
Majs
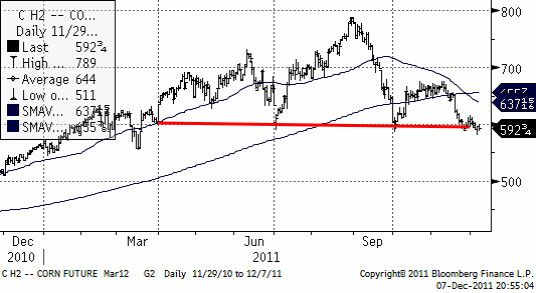
Majspriset har hållit sig kvar vid stödet på 600 cent för mars-kontraktet. Väderleksrapporten för Argentina och södra Brasilien för de närmaste två veckorna innehåller väldigt lite regn och det gör, tillsammans med en oro för La Niña som verkar stärkas, att majsmarknaden fått stöd.
Kopplingen till etanol och oron kring Irans kärnvapenprogram och dess potentiellt explosiva effekt på oljepriset gör majshandlare oroliga att sälja, fast mycket annat tyder på att priset borde vara lägre.
Nedan ser vi marskontraktet på CBOT, där priset ligger på den nivå vid 600 cent där marknaden funnit stöd flera gånger. Den svagare dollarn gav ytterligare stöd för majspriset idag. Priset föll dock av ändå och stängde lågt.
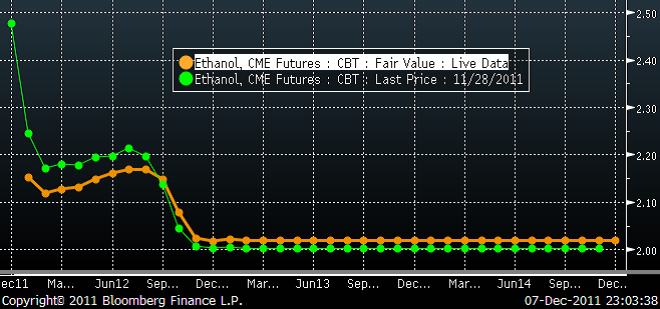
Etanolmarginalen för amerikanska brännerier har säckat ihop och det beror på att etanolpriset handlas betydligt lägre för leverans nästa år jämfört med i år. Skatterabatten för att blanda etanol i bränsle försvinner, som bekant. Nedan ser vi terminspriserna framåt i tiden, där den nedre, lite kraftigare linjen är terminskurvan från onsdagskvällen (igår), medan den smalare är terminskurvan för 7 dagar sedan (den första av de terminerna har hunnit förfalla till idag).
Etanolefterfrågan har hållit majspriset uppe och nu ”borde” majspriset kunna falla under 600 cent / bu. WASDE imorgon fredag innehåller ingen statistik på produktion och marknadspåverkan blir därför väldigt liten. Decemberrapporterna brukar inte påverka marknaden.
Sojabönor
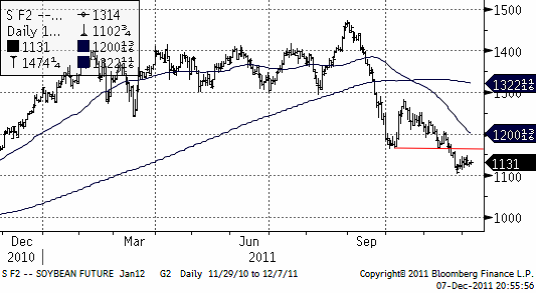
Priset på sojabönor befinner sig i en sjunkande trend. Priset har rekylerat upp lite den senaste veckan och det torde vara ett bra säljtillfälle.
Vi är negativa ur tekniskt perspektiv de närmaste tre månaderna.
Raps
Priset på raps har gått upp något sedan förra veckan och funnit stöd både från energimarknaden (råolja WTI som påverkas av det spända läget I Mellanöstern) och den vegetabiliska oljemarknaden (palmolja).
StatCan rapporterar att produktionen av raps (canola) slog nytt rekord under 2011 enligt deras sista prognos för året. Prognosen är 14.2 mt, en höjning sedan senast från 12.9 mt. Förra årets skörd var 12.8 mt.
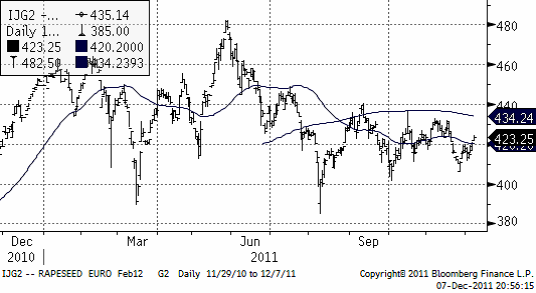
ABARES i Australien höjde prognosen för rapsskörden med 200 kt. Nedan ser vi priset på februariterminen på Matif.
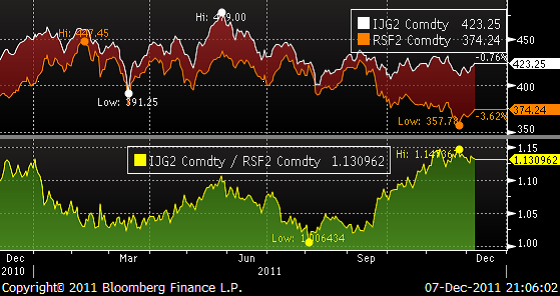
Matifraps är ovanligt dyrt i förhållande till canola i Kanada, som vi ser i nedanstående diagram. Ett premium på 13% är ovanligt högt.
Vi har en negativ vy på Matif raps.
Mjölk
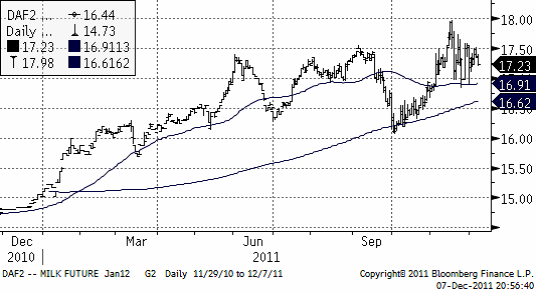
Nedan ser vi priset på januarikontraktet på flytande mjölk (kontakt avräknat mot USDA:s prisindex). Priset har varit väldigt rörligt den senaste tiden. Trenden är uppåtriktad, men hög prisosäkerhet som vi ser nu, uppstår ibland i slutet av trender.
Gris
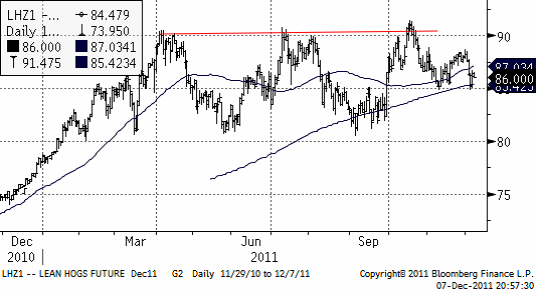
Tekniskt vilar priset på lean hogs på de glidande medelvärdena. Att priset ligger över gör att trenden är uppåtriktad. Det har inte kommit några nämnvärda nyheter sedan förra veckan. Tekniskt är bilden väldigt otydlig.
Valutor
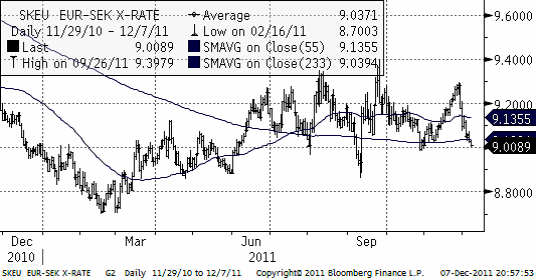
EURSEK har handlats ner till den psykologiskt viktiga nivån 9 kr. Spänningen är stor inför fredagens EU-toppmöte.
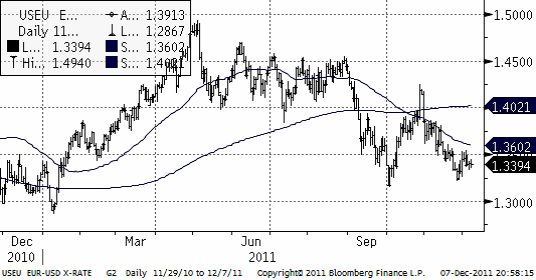
EURUSD är i en tydlig negativ trend.
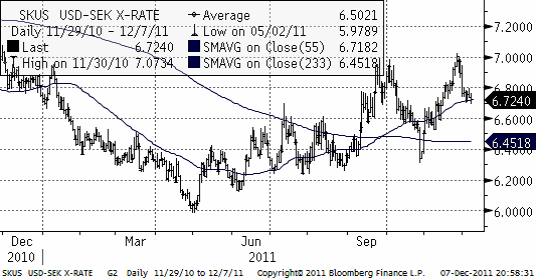
USDSEK har en stigande trend. Just nu vilar priset på 55-dagars glidande medelvärde, och det ger stöd (många tittar på den tekniska indikatorn).
Gödsel
Kväve
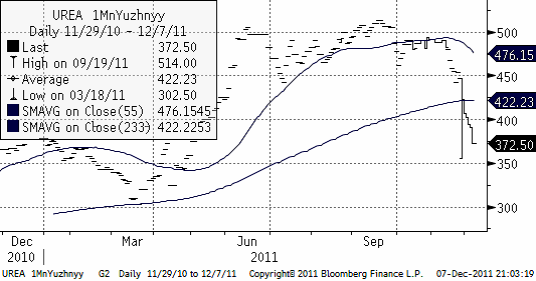
Nedan ser vi 1 månads terminspris på Urea fob Uyzhnyy. Priset har fallit kraftigt under hösten.
[box]SEB Veckobrev Jordbruksprodukter är producerat av SEB Merchant Banking och publiceras i samarbete och med tillstånd på Råvarumarknaden.se[/box]
Disclaimer
The information in this document has been compiled by SEB Merchant Banking, a division within Skandinaviska Enskilda Banken AB (publ) (“SEB”).
Opinions contained in this report represent the bank’s present opinion only and are subject to change without notice. All information contained in this report has been compiled in good faith from sources believed to be reliable. However, no representation or warranty, expressed or implied, is made with respect to the completeness or accuracy of its contents and the information is not to be relied upon as authoritative. Anyone considering taking actions based upon the content of this document is urged to base his or her investment decisions upon such investigations as he or she deems necessary. This document is being provided as information only, and no specific actions are being solicited as a result of it; to the extent permitted by law, no liability whatsoever is accepted for any direct or consequential loss arising from use of this document or its contents.
About SEB
SEB is a public company incorporated in Stockholm, Sweden, with limited liability. It is a participant at major Nordic and other European Regulated Markets and Multilateral Trading Facilities (as well as some non-European equivalent markets) for trading in financial instruments, such as markets operated by NASDAQ OMX, NYSE Euronext, London Stock Exchange, Deutsche Börse, Swiss Exchanges, Turquoise and Chi-X. SEB is authorized and regulated by Finansinspektionen in Sweden; it is authorized and subject to limited regulation by the Financial Services Authority for the conduct of designated investment business in the UK, and is subject to the provisions of relevant regulators in all other jurisdictions where SEB conducts operations. SEB Merchant Banking. All rights reserved.
Analys
Crude oil soon coming to a port near you

Rebounding along with most markets. But concerns over solidity of Gaza peace may also contribute. Brent crude fell 0.8% yesterday to $61.91/b and its lowest close since May this year. This morning it is bouncing up 0.9% to $62.5/b along with a softer USD amid positive sentiment with both equities and industrial metals moving higher. Concerns that the peace in Gaza may be less solid than what one might hope for also yields some support to Brent. Bets on tech stocks are rebounding, defying fears of trade war. Money moving back into markets. Gold continues upwards its strong trend and a softer dollar helps it higher today as well.

US crude & products probably rose 5.6 mb last week (API) versus a normal seasonal decline of 2.4 mb. The US API last night partial and thus indicative data for US oil inventories. Their data indicates that US crude stocks rose 7.4 mb last week, gasoline stocks rose 3.0 mb while Distillate stocks fell 4.8 mb. Altogether an increase in commercial crude and product stocks of 5.6 mb. Commercial US crude and product stocks normally decline by 2.4 mb this time of year. So seasonally adjusted the US inventories rose 8 mb last week according to the indicative numbers by the API. That is a lot. Also, the counter seasonal trend of rising stocks versus normally declining stocks this time of year looks on a solid pace of continuation. If the API is correct then total US crude and product stocks would stand 41 mb higher than one year ago and 6 mb higher than the 2015-19 average. And if we combine this with our knowledge of a sharp increase in production and exports by OPEC(+) and a large increase in oil at sea, then the current trend in US oil inventories looks set to continue. So higher stocks and lower crude oil prices until OPEC(+) switch to cuts. Actual US oil inventory data today at 18:00 CET.
US commercial crude and product stocks rising to 1293 mb in week 41 if last nights indicative numbers from API are correct.

Crude oil soon coming to a port near you. OPEC has lifted production sharply higher this autumn. At the same time demand for oil in the Middle-East has fallen as we have moved out of summer heat and crude oil burn for power for air-conditioning. The Middle-East oil producers have thus been able to lift exports higher on both accounts. Crude oil and condensates on water has shot up by 177 mb since mid-August. This oil is now on its way to ports around the world. And when they arrive, it will likely help to lift stocks onshore higher. That is probably when we will lose the last bit of front-end backwardation the the crude oil curves. That will help to drive the front-month Brent crude oil price down to the $60/b line and revisit the high $50ies/b. Then the eyes will be all back on OPEC+ when they meet in early November and then again in early December.
Crude oil and condensates at sea have moved straight up by 177 mb since mid-August as OPEC(+) has produced more, consumed less and exported more.

Analys
The Mid-East anchor dragging crude oil lower

When it starts to move lower it moves rather quickly. Gaza, China, IEA. Brent crude is down 2.1% today to $62/b after having traded as high as $66.58/b last Thursday and above $70/b in late September. The sell-off follows the truce/peace in Gaze, a flareup in US-China trade and yet another bearish oil outlook from the IEA.

A lasting peace in Gaze could drive crude oil at sea to onshore stocks. A lasting peace in Gaza would probably calm down the Houthis and thus allow more normal shipments of crude oil to sail through the Suez Canal, the Red Sea and out through the Bab-el-Mandeb Strait. Crude oil at sea has risen from 48 mb in April to now 91 mb versus a pre-Covid normal of about 50-60 mb. The rise to 91 mb is probably the result of crude sailing around Africa to be shot to pieces by the Houthis. If sailings were to normalize through the Suez Canal, then it could free up some 40 mb in transit at sea moving onshore into stocks.
The US-China trade conflict is of course bearish for demand if it continues.
Bearish IEA yet again. Getting closer to 2026. Credibility rises. We expect OPEC to cut end of 2025. The bearish monthly report from the IEA is what it is, but the closer we get to 2026, the more likely the IEA is of being ball-park right in its outlook. In its monthly report today the IEA estimates that the need for crude oil from OPEC in 2026 will be 25.4 mb/d versus production by the group in September of 29.1 mb/d. The group thus needs to do some serious cutting at the end of 2025 if it wants to keep the market balanced and avoid inventories from skyrocketing. Given that IEA is correct that is. We do however expect OPEC to implement cuts to avoid a large increase in inventories in Q1-26. The group will probably revert to cuts either at its early December meeting when they discuss production for January or in early January when they discuss production for February. The oil price will likely head yet lower until the group reverts to cuts.
Dubai: The Mid-East anchor dragging crude oil lower. Surplus emerging in Mid-East pricing. Crude oil prices held surprisingly strong all through the summer. A sign and a key source of that strength came from the strength in the front-end backwardation of the Dubai crude oil curve. It held out strong from mid-June and all until late September with an average 1-3mth time-spread premium of $1.8/b from mid-June to end of September. The 1-3mth time-spreads for Brent and WTI however were in steady deterioration from late June while their flat prices probably were held up by the strength coming from the Persian Gulf. Then in late September the strength in the Dubai curve suddenly collapsed. Since the start of October it has been weaker than both the Brent and the WTI curves. The Dubai 1-3mth time-spread now only stands at $0.25/b. The Middle East is now exporting more as it is producing more and also consuming less following elevated summer crude burn for power (Aircon) etc.
The only bear-element missing is a sudden and solid rise in OECD stocks. The only thing that is missing for the bear-case everyone have been waiting for is a solid, visible rise in OECD stocks in general and US oil stocks specifically. So watch out for US API indications tomorrow and official US oil inventories on Thursday.
No sign of any kind of fire-sale of oil from Saudi Arabia yet. To what we can see, Saudi Arabia is not at all struggling to sell its oil. It only lowered its Official Selling Prices (OSPs) to Asia marginally for November. A surplus market + Saudi determination to sell its oil to the market would normally lead to a sharp lowering of Saudi OSPs to Asia. Not yet at least and not for November.
The 5yr contract close to fixed at $68/b. Of importance with respect to how far down oil can/will go. When the oil market moves into a surplus then the spot price starts to trade in a large discount to the 5yr contract. Typically $10-15/b below the 5yr contract on average in bear-years (2009, 2015, 2016, 2020). But the 5yr contract is usually pulled lower as well thus making this approach a moving target. But the 5yr contract price has now been rock solidly been pegged to $68/b since 2022. And in the 2022 bull-year (Brent spot average $99/b), the 5yr contract only went to $72/b on average. If we assume that the same goes for the downside and that 2026 is a bear-year then the 5yr goes to $64/b while the spot is trading at a $10-15/b discount to that. That would imply an average spot price next year of $49-54/b. But that is if OPEC doesn’t revert to cuts and instead keeps production flowing. We think OPEC(+) will trim/cut production as needed into 2026 to prevent a huge build-up in global oil stocks and a crash in prices. But for now we are still heading lower. Into the $50ies/b.
Analys
More weakness and lower price levels ahead, but the world won’t drown in oil in 2026

Some rebound but not much. Brent crude rebounded 1.5% yesterday to $65.47/b. This morning it is inching 0.2% up to $65.6/b. The lowest close last week was on Thursday at $64.11/b.

The curve structure is almost as week as it was before the weekend. The rebound we now have gotten post the message from OPEC+ over the weekend is to a large degree a rebound along the curve rather than much strengthening at the front-end of the curve. That part of the curve structure is almost as weak as it was last Thursday.
We are still on a weakening path. The message from OPEC+ over the weekend was we are still on a weakening path with rising supply from the group. It is just not as rapidly weakening as was feared ahead of the weekend when a quota hike of 500 kb/d/mth for November was discussed.
The Brent curve is on its way to full contango with Brent dipping into the $50ies/b. Thus the ongoing weakening we have had in the crude curve since the start of the year, and especially since early June, will continue until the Brent crude oil forward curve is in full contango along with visibly rising US and OECD oil inventories. The front-month Brent contract will then flip down towards the $60/b-line and below into the $50ies/b.
At what point will OPEC+ turn to cuts? The big question then becomes: When will OPEC+ turn around to make some cuts? At what (price) point will they choose to stabilize the market? Because for sure they will. Higher oil inventories, some more shedding of drilling rigs in US shale and Brent into the 50ies somewhere is probably where the group will step in.
There is nothing we have seen from the group so far which indicates that they will close their eyes, let the world drown in oil and the oil price crash to $40/b or below.
The message from OPEC+ is also about balance and stability. The world won’t drown in oil in 2026. The message from the group as far as we manage to interpret it is twofold: 1) Taking back market share which requires a lower price for non-OPEC+ to back off a bit, and 2) Oil market stability and balance. It is not just about 1. Thus fretting about how we are all going to drown in oil in 2026 is totally off the mark by just focusing on point 1.
When to buy cal 2026? Before Christmas when Brent hits $55/b and before OPEC+ holds its last meeting of the year which is likely to be in early December.
Brent crude oil prices have rebounded a bit along the forward curve. Not much strengthening in the structure of the curve. The front-end backwardation is not much stronger today than on its weakest level so far this year which was on Thursday last week.

The front-end backwardation fell to its weakest level so far this year on Thursday last week. A slight pickup yesterday and today, but still very close to the weakest year to date. More oil from OPEC+ in the coming months and softer demand and rising inventories. We are heading for yet softer levels.

-

 Nyheter3 veckor sedan
OPEC+ missar produktionsmål, stöder oljepriserna
-

 Nyheter3 veckor sedan
Ett samtal om guld, olja, fjärrvärme och förnybar energi
-

 Nyheter2 veckor sedan
Guld nära 4000 USD och silver 50 USD, därför kan de fortsätta stiga
-

 Analys3 veckor sedan
Are Ukraine’s attacks on Russian energy infrastructure working?
-

 Nyheter1 vecka sedan
Goldman Sachs höjer prognosen för guld, tror priset når 4900 USD
-

 Nyheter2 veckor sedan
Blykalla och amerikanska Oklo inleder ett samarbete
-

 Nyheter3 veckor sedan
Guldpriset uppe på nya höjder, nu 3750 USD
-

 Nyheter2 veckor sedan
Ett samtal om guld, olja, koppar och stål


