Analys
SEB – Jordbruksprodukter, vecka 48
 Att centralbankerna i 6 länder – USA (FED), Europa (ECB), Kanada, England, Japan och Schweiz bestämde sig för att sänka räntan för dollarlån till europeiska banker fick marknaderna – inklusive råvarumarknaden – att ta ett glädjeskutt. Beslutet var förvånande eftersom det inte just nu är en allmän brist på likviditet. Likviditetsbrist väntade marknaden skulle kunna ske först om ett år. Det gör att man tolkar beslutet som en ”signal” till marknaden att man vill släppa på pengar. Man kan tolka det som en viljeyttring att slå på sedelpressarna. Samtidigt har också misstanken kommit upp att det finns något som inte är känt. Vi känner ju till att Riksbanken t ex dolde hur illa det stod till för
 Swedbank år 2008. Världen lärde sig läxan från Lehman-konkursen. Man vill inte att det ska hända igen. Vi vet att franska banker ligger risigt till. Kommentatorer har frågat sig om det kanske var en fransk storbank som via detta drag räddats från ett akut konkurshot. I så fall är ”signalen” inte så positiv, utan ganska illavarslande.
Den 9 december ska besked lämnas från eurozonens politiker. Möjligen håller man på att övertyga Tyskland om att slå på ECB:s sedelpressar av euro, när man nu gjort det med dollar. Råvaror kommer då att vara en förträfflig placering.
Efter att priserna på jordbruksprodukter initialt stigit, föll priserna tillbaka. Kanske var det den här ”konspirationsteorin” som påverkat. Men fundamenta för spannmål och sojabönor är också svaga och detta är antagligen det huvudsakliga skälet till att priserna stängde lågt i onsdags.
På onsdagen sänkte Kina kassakraven på landets banker – man lättar alltså på bromspedalen, som man haft intryckt i ett års tid. Landet söker säkerligen eftersträva stabilitet under 2012 års ledningsbyte. Det är den första sänkningen sedan 2008. Den här sänkningen tycks vara oberoende av de 6 stora centralbankerna. Under onsdagen rapporterades också att matpriserna i Kina stigit något den senaste månaden, lett av grönsaker.
Vete
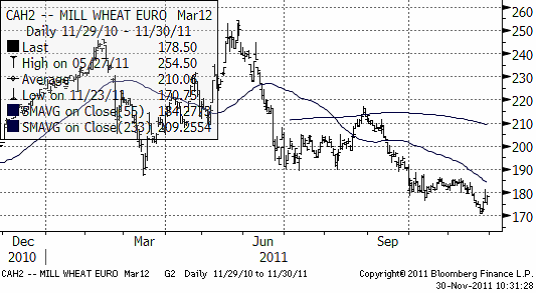
Terminspriset på Matif-vete (mars) ligger på 178.5 euro. Den rekyl vi haft upp till 180-euro-nivån är ett säljtillfälle. Det är vanligt att man ser den här typen av rekyler upp mot utbrottsnivån och oftast är det den andra chansen för dem som missade att sälja vid utbrottet. Allt tyder på att vetepriset ska ner.
Argentina och även Brasilien är väldigt aggressiva på exportmarknaderna just nu. Det beror på att de vill bli av med den gamla skörden och skapa utrymme för den nya. Lite märkligt är det ändå – att Brasilien, som intar tredjeplatsen bland köparländerna, nu tycks vara en av de länder som sätter marginalpriset på vete i världen. Jordbruksverket kom idag med en rapport om just Argentinas och Brasiliens växande roll som ”brödkorg” för världen.
Annars fortsätter ryskt och ukrainskt vete att välla ut över Mellanöstern och Nordafrika. Troligtvis avtar flödet när vintern sätter in och försvårar logistiken. Häromdagen rapporterade Black Earth Farming om den usla logistiken som gör att de får tippa vete på asfalt under bar himmel. Regn förvandlar fint maltkorn och kvarnvete till foder, som bäst, enligt BEF.
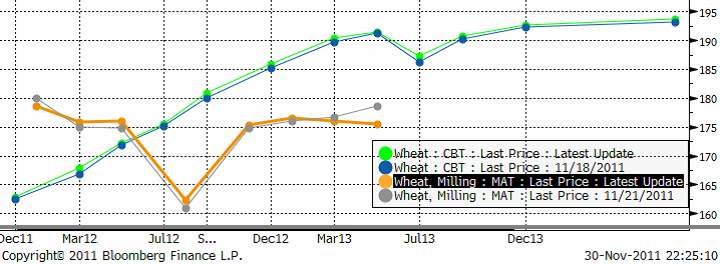
Nedan ser vi terminskurvan för Chicagovete och Matif nu och för en vecka sedan. De ”feta” kurvorna är de aktuella. De ”smala” är förra veckans.
Allt talar för att Matif-vete faller ner i första hand till 150 – 160 – euro-nivån. På köparsidan hittar vi antagligen etanolfabrikanter.
Maltkorn
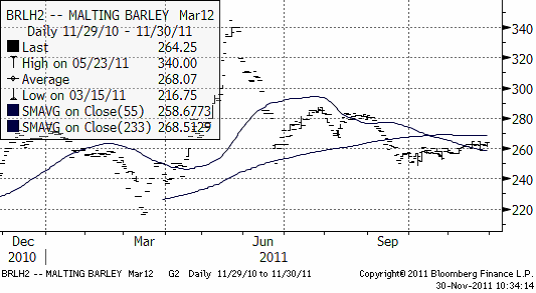
Maltkornsmarknaden följer vetet och det finns inga speciella nyheter att rapportera. Tekniskt ligger priset under glidande medelvärden. Den tekniska trenden är alltså nedåtriktad.
Potatis
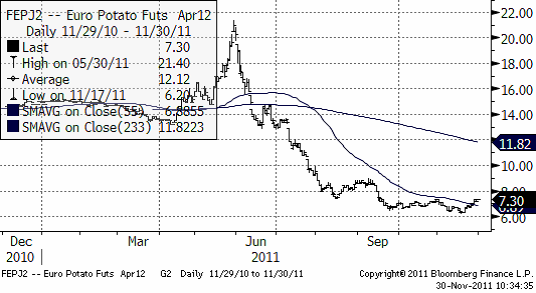
Priset på potatis av årets skörd fortsatte stiga i veckan.
Nedan ser vi kursdiagrammet på europeisk potatis, som handlas på Eurex; terminen avser leverans april nästa år.
Majs
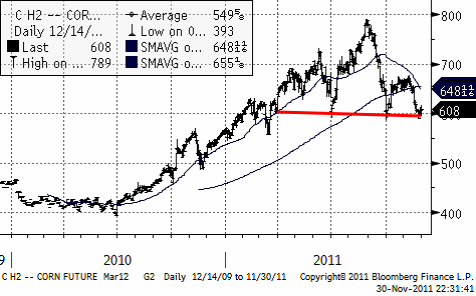
Majspriset har fallit till en teknisk stödnivå och marknaden präglas av oro för global efterfrågan. Det har varit torrt i Argentina och södra Brasilien och majsen är i en fas där den är känslig för torka. Glädjande nog väntas regn under nästa vecka. Den prognosen tynger naturligtvis marknaden.
Kina väntas importera majs.
Nedan ser vi marskontraktet på CBOT, där priset ligger på den nivå vid 600 cent där marknaden funnit stöd flera gånger. Den svagare dollarn gav ytterligare stöd för majspriset idag. Priset föll dock av ändå och stängde lågt.
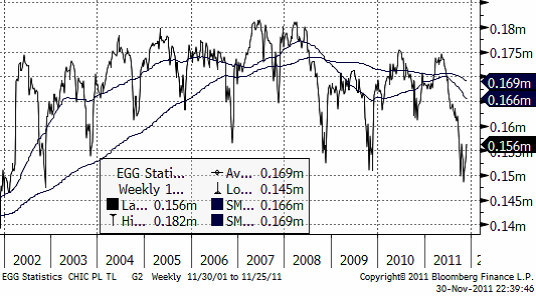
USDA rapporterar att antalet kycklingar satta på uppfödning till broiler låg på den lägsta nivån sedan 2002. Det finns en säsongsvariation, som gör att det är lågt just nu, men 2011 ligger lågt som helhet, i nivå med krisåret 2009. Detta gör naturligtvis att efterfrågan på majs och även sojamjöl i USA är lågt.
Oljepriset tog ett skutt uppåt på centralbankernas utspel, men föll tillbaka under onsdagskvällen till en lägre prisnivå än i tisdags. Då måste vi också ta hänsyn till att dollarn försvagats. I kronor (eller euro) har oljepriset alltså fallit. I Europa har priset på etanol fallit 35 euro per ton sedan förra veckan.
Sojabönor
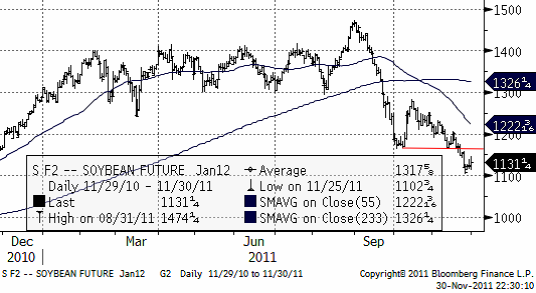
Priset på sojabönor befinner sig i en sjunkande trend. Det är en ”bear market”. Denna förstärktes för ett par dagar sedan när det tekniska stödet på 1167 bröts. Priset kan mycket väl gå ner mot 10 dollar.
Brasilianska säljare lär komma in allt mer och sälja ner priset. Vi är negativa ur tekniskt perspektiv de närmaste tre månaderna.
Raps
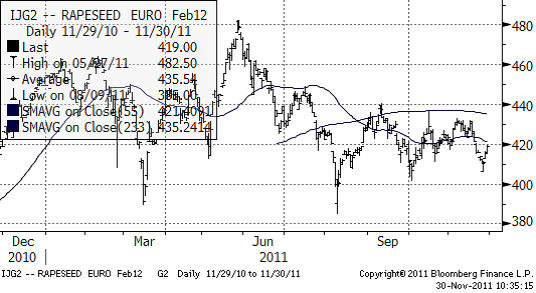
Rapspriset rör sig sidledes. Tekniskt ligger priset under 55-dagars glidande medelvärde och det gör att vi om något har en negativ vy. Även om bilden är otydlig är det fortfarande 400 euro som är prisobjektivet vi tror på.
Mjölk
Enligt önskemål tar vi upp bevakningen av mjölkmarknaden. Terminshandel finns främst på Chicago Mercantile Exchange, CME.
Det finns terminskontrakt sedan den 18 oktober 2010 på Matif i Paris, avseende torrmjölkspulver. Kontrakten avser 24 ton och det är leverans om man har en öppen position när kontrakten förfaller.
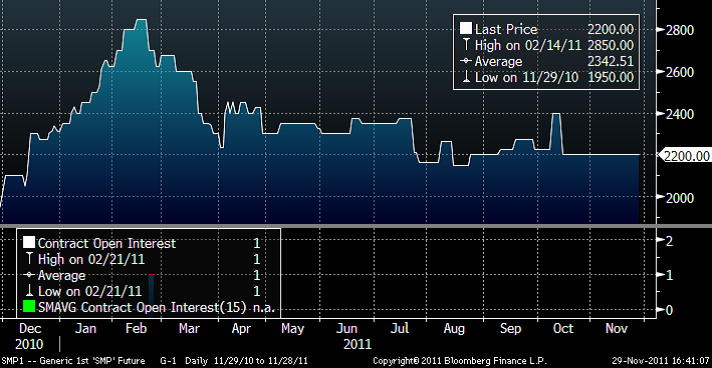
Priset är som vi ser nedan, 2200 euro per ton just nu. Vi ser också att intresset för de här terminskontrakten varit obefintligt (bokstavligt talat). 1 kontrakt har handlats sedan starten. Möjligen saknar marknaden motiv till handel eftersom det finns för få tänkbara deltagare. Antalet mejerier är för litet.
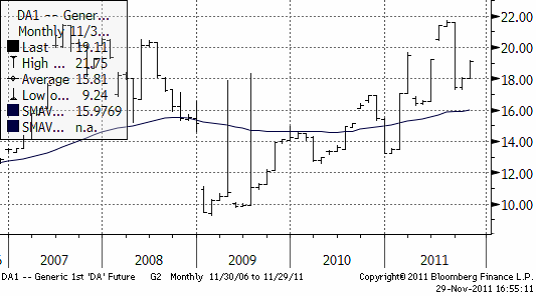
På CME handlas skummjölkspulver, men det mest handlade terminskontraktet avser USDA Class III priset för flytande mjölk. Den här typen av mjölk används för att tillverka ost. Kontraktet beräknas som USDA:s pris för Class III mjölk multiplicerat med 2,000. Priset anges i dollar per hundravikt (cwt) men avser 200,000 pund. Ett kontrakt är alltså värt 27,400 dollar när priset är 18.70 dollar / cwt. Naturligtvis är kontrakten kontant avräknade mot USDA:s pris; ingen leverans av flytande mjölk! Nedan ser vi priset på spotkontraktet över tiden. Notera att det uppstår hopp i prisnivån när ett nytt terminskontrakt blir det nya kortaste kontraktet och att det finns säsongsvariation i priset.
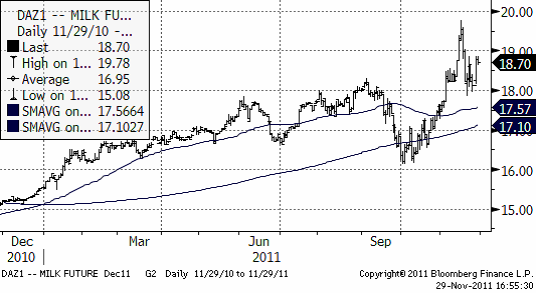
I diagrammet nedan ser vi decemberkontraktet 2011. Det avser priset nu i december och har därför ingen säsongsvariation som stör. Trenden är uppåtriktad och priset har stigit stadigt hittills i år, helt opåverkat av skuldkris.
Gris
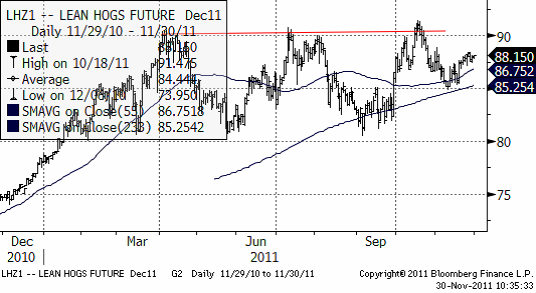
Tekniskt vilar priset på lean hogs på de glidande medelvärdena. Att priset ligger över gör att trenden är uppåtriktad. Det har inte kommit några nämnvärda nyheter sedan förra veckan.
Valutor
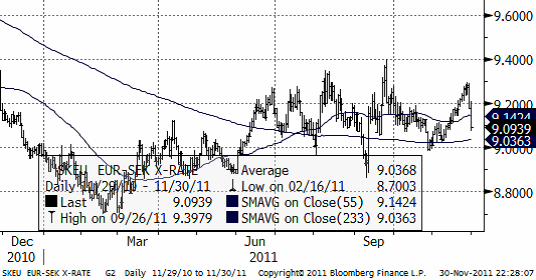
EURSEK handlas i ett brett intervall, utan trend vare sig uppåt eller nedåt.
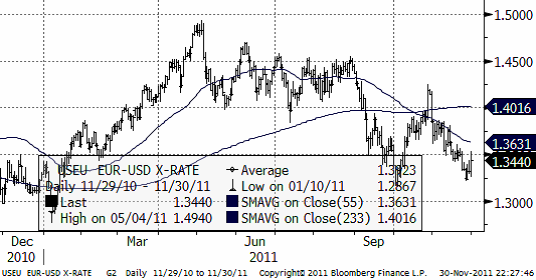
EURUSD har äntligen brutit nedåt och nu lär det gå fort. I första hand är nästa stöd 1.3145 dollar. I andra hand är det botten nere vid 1.2 dollar.
Den massiva korta valutapositionen mot Euro anses uppgå till 3 gånger den spekulativa långa positionen. Det gör att positiva nyheter om euron får större effekt på växelkursen än (ytterligare) negativa.
Inför årets slut brukar hedgefonder och liknande vilja minska sina risker. Det behöver inte bli så, men det kan bli så att euron då stärks när alla sålda positioner köps tillbaka.
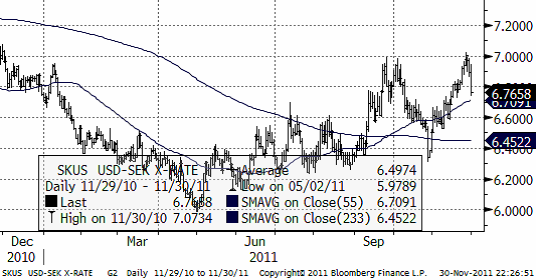
USDSEK föll kraftigt som en reaktion på de sex centralbankernas samlade aktion att pumpa in dollar i ekonomin.
Gödsel
Kalium
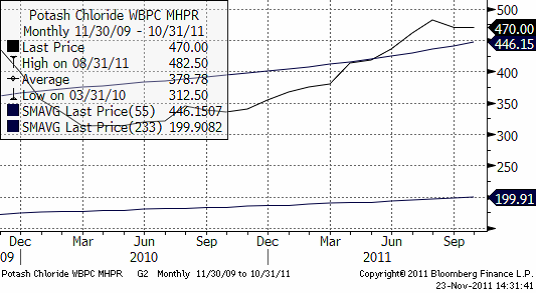
Priset på kalium ligger kvar på samma nivå som för ett par veckor sedan.
Kväve
Nedan ser vi prisutvecklingen på Urea FOB Yuzhny i dollar per ton. Det har inte varit någon förändring.
Fosfor
Nedan ser vi prisutvecklingen på Diammoniumfosfat FOB Baltic i dollar per ton. Det har inte varit någon förändring från förra veckan.
[box]SEB Veckobrev Jordbruksprodukter är producerat av SEB Merchant Banking och publiceras i samarbete och med tillstånd på Råvarumarknaden.se[/box]
Disclaimer
The information in this document has been compiled by SEB Merchant Banking, a division within Skandinaviska Enskilda Banken AB (publ) (“SEB”).
Opinions contained in this report represent the bank’s present opinion only and are subject to change without notice. All information contained in this report has been compiled in good faith from sources believed to be reliable. However, no representation or warranty, expressed or implied, is made with respect to the completeness or accuracy of its contents and the information is not to be relied upon as authoritative. Anyone considering taking actions based upon the content of this document is urged to base his or her investment decisions upon such investigations as he or she deems necessary. This document is being provided as information only, and no specific actions are being solicited as a result of it; to the extent permitted by law, no liability whatsoever is accepted for any direct or consequential loss arising from use of this document or its contents.
About SEB
SEB is a public company incorporated in Stockholm, Sweden, with limited liability. It is a participant at major Nordic and other European Regulated Markets and Multilateral Trading Facilities (as well as some non-European equivalent markets) for trading in financial instruments, such as markets operated by NASDAQ OMX, NYSE Euronext, London Stock Exchange, Deutsche Börse, Swiss Exchanges, Turquoise and Chi-X. SEB is authorized and regulated by Finansinspektionen in Sweden; it is authorized and subject to limited regulation by the Financial Services Authority for the conduct of designated investment business in the UK, and is subject to the provisions of relevant regulators in all other jurisdictions where SEB conducts operations. SEB Merchant Banking. All rights reserved.
Analys
Crude oil soon coming to a port near you

Rebounding along with most markets. But concerns over solidity of Gaza peace may also contribute. Brent crude fell 0.8% yesterday to $61.91/b and its lowest close since May this year. This morning it is bouncing up 0.9% to $62.5/b along with a softer USD amid positive sentiment with both equities and industrial metals moving higher. Concerns that the peace in Gaza may be less solid than what one might hope for also yields some support to Brent. Bets on tech stocks are rebounding, defying fears of trade war. Money moving back into markets. Gold continues upwards its strong trend and a softer dollar helps it higher today as well.

US crude & products probably rose 5.6 mb last week (API) versus a normal seasonal decline of 2.4 mb. The US API last night partial and thus indicative data for US oil inventories. Their data indicates that US crude stocks rose 7.4 mb last week, gasoline stocks rose 3.0 mb while Distillate stocks fell 4.8 mb. Altogether an increase in commercial crude and product stocks of 5.6 mb. Commercial US crude and product stocks normally decline by 2.4 mb this time of year. So seasonally adjusted the US inventories rose 8 mb last week according to the indicative numbers by the API. That is a lot. Also, the counter seasonal trend of rising stocks versus normally declining stocks this time of year looks on a solid pace of continuation. If the API is correct then total US crude and product stocks would stand 41 mb higher than one year ago and 6 mb higher than the 2015-19 average. And if we combine this with our knowledge of a sharp increase in production and exports by OPEC(+) and a large increase in oil at sea, then the current trend in US oil inventories looks set to continue. So higher stocks and lower crude oil prices until OPEC(+) switch to cuts. Actual US oil inventory data today at 18:00 CET.
US commercial crude and product stocks rising to 1293 mb in week 41 if last nights indicative numbers from API are correct.

Crude oil soon coming to a port near you. OPEC has lifted production sharply higher this autumn. At the same time demand for oil in the Middle-East has fallen as we have moved out of summer heat and crude oil burn for power for air-conditioning. The Middle-East oil producers have thus been able to lift exports higher on both accounts. Crude oil and condensates on water has shot up by 177 mb since mid-August. This oil is now on its way to ports around the world. And when they arrive, it will likely help to lift stocks onshore higher. That is probably when we will lose the last bit of front-end backwardation the the crude oil curves. That will help to drive the front-month Brent crude oil price down to the $60/b line and revisit the high $50ies/b. Then the eyes will be all back on OPEC+ when they meet in early November and then again in early December.
Crude oil and condensates at sea have moved straight up by 177 mb since mid-August as OPEC(+) has produced more, consumed less and exported more.

Analys
The Mid-East anchor dragging crude oil lower

When it starts to move lower it moves rather quickly. Gaza, China, IEA. Brent crude is down 2.1% today to $62/b after having traded as high as $66.58/b last Thursday and above $70/b in late September. The sell-off follows the truce/peace in Gaze, a flareup in US-China trade and yet another bearish oil outlook from the IEA.

A lasting peace in Gaze could drive crude oil at sea to onshore stocks. A lasting peace in Gaza would probably calm down the Houthis and thus allow more normal shipments of crude oil to sail through the Suez Canal, the Red Sea and out through the Bab-el-Mandeb Strait. Crude oil at sea has risen from 48 mb in April to now 91 mb versus a pre-Covid normal of about 50-60 mb. The rise to 91 mb is probably the result of crude sailing around Africa to be shot to pieces by the Houthis. If sailings were to normalize through the Suez Canal, then it could free up some 40 mb in transit at sea moving onshore into stocks.
The US-China trade conflict is of course bearish for demand if it continues.
Bearish IEA yet again. Getting closer to 2026. Credibility rises. We expect OPEC to cut end of 2025. The bearish monthly report from the IEA is what it is, but the closer we get to 2026, the more likely the IEA is of being ball-park right in its outlook. In its monthly report today the IEA estimates that the need for crude oil from OPEC in 2026 will be 25.4 mb/d versus production by the group in September of 29.1 mb/d. The group thus needs to do some serious cutting at the end of 2025 if it wants to keep the market balanced and avoid inventories from skyrocketing. Given that IEA is correct that is. We do however expect OPEC to implement cuts to avoid a large increase in inventories in Q1-26. The group will probably revert to cuts either at its early December meeting when they discuss production for January or in early January when they discuss production for February. The oil price will likely head yet lower until the group reverts to cuts.
Dubai: The Mid-East anchor dragging crude oil lower. Surplus emerging in Mid-East pricing. Crude oil prices held surprisingly strong all through the summer. A sign and a key source of that strength came from the strength in the front-end backwardation of the Dubai crude oil curve. It held out strong from mid-June and all until late September with an average 1-3mth time-spread premium of $1.8/b from mid-June to end of September. The 1-3mth time-spreads for Brent and WTI however were in steady deterioration from late June while their flat prices probably were held up by the strength coming from the Persian Gulf. Then in late September the strength in the Dubai curve suddenly collapsed. Since the start of October it has been weaker than both the Brent and the WTI curves. The Dubai 1-3mth time-spread now only stands at $0.25/b. The Middle East is now exporting more as it is producing more and also consuming less following elevated summer crude burn for power (Aircon) etc.
The only bear-element missing is a sudden and solid rise in OECD stocks. The only thing that is missing for the bear-case everyone have been waiting for is a solid, visible rise in OECD stocks in general and US oil stocks specifically. So watch out for US API indications tomorrow and official US oil inventories on Thursday.
No sign of any kind of fire-sale of oil from Saudi Arabia yet. To what we can see, Saudi Arabia is not at all struggling to sell its oil. It only lowered its Official Selling Prices (OSPs) to Asia marginally for November. A surplus market + Saudi determination to sell its oil to the market would normally lead to a sharp lowering of Saudi OSPs to Asia. Not yet at least and not for November.
The 5yr contract close to fixed at $68/b. Of importance with respect to how far down oil can/will go. When the oil market moves into a surplus then the spot price starts to trade in a large discount to the 5yr contract. Typically $10-15/b below the 5yr contract on average in bear-years (2009, 2015, 2016, 2020). But the 5yr contract is usually pulled lower as well thus making this approach a moving target. But the 5yr contract price has now been rock solidly been pegged to $68/b since 2022. And in the 2022 bull-year (Brent spot average $99/b), the 5yr contract only went to $72/b on average. If we assume that the same goes for the downside and that 2026 is a bear-year then the 5yr goes to $64/b while the spot is trading at a $10-15/b discount to that. That would imply an average spot price next year of $49-54/b. But that is if OPEC doesn’t revert to cuts and instead keeps production flowing. We think OPEC(+) will trim/cut production as needed into 2026 to prevent a huge build-up in global oil stocks and a crash in prices. But for now we are still heading lower. Into the $50ies/b.
Analys
More weakness and lower price levels ahead, but the world won’t drown in oil in 2026

Some rebound but not much. Brent crude rebounded 1.5% yesterday to $65.47/b. This morning it is inching 0.2% up to $65.6/b. The lowest close last week was on Thursday at $64.11/b.

The curve structure is almost as week as it was before the weekend. The rebound we now have gotten post the message from OPEC+ over the weekend is to a large degree a rebound along the curve rather than much strengthening at the front-end of the curve. That part of the curve structure is almost as weak as it was last Thursday.
We are still on a weakening path. The message from OPEC+ over the weekend was we are still on a weakening path with rising supply from the group. It is just not as rapidly weakening as was feared ahead of the weekend when a quota hike of 500 kb/d/mth for November was discussed.
The Brent curve is on its way to full contango with Brent dipping into the $50ies/b. Thus the ongoing weakening we have had in the crude curve since the start of the year, and especially since early June, will continue until the Brent crude oil forward curve is in full contango along with visibly rising US and OECD oil inventories. The front-month Brent contract will then flip down towards the $60/b-line and below into the $50ies/b.
At what point will OPEC+ turn to cuts? The big question then becomes: When will OPEC+ turn around to make some cuts? At what (price) point will they choose to stabilize the market? Because for sure they will. Higher oil inventories, some more shedding of drilling rigs in US shale and Brent into the 50ies somewhere is probably where the group will step in.
There is nothing we have seen from the group so far which indicates that they will close their eyes, let the world drown in oil and the oil price crash to $40/b or below.
The message from OPEC+ is also about balance and stability. The world won’t drown in oil in 2026. The message from the group as far as we manage to interpret it is twofold: 1) Taking back market share which requires a lower price for non-OPEC+ to back off a bit, and 2) Oil market stability and balance. It is not just about 1. Thus fretting about how we are all going to drown in oil in 2026 is totally off the mark by just focusing on point 1.
When to buy cal 2026? Before Christmas when Brent hits $55/b and before OPEC+ holds its last meeting of the year which is likely to be in early December.
Brent crude oil prices have rebounded a bit along the forward curve. Not much strengthening in the structure of the curve. The front-end backwardation is not much stronger today than on its weakest level so far this year which was on Thursday last week.

The front-end backwardation fell to its weakest level so far this year on Thursday last week. A slight pickup yesterday and today, but still very close to the weakest year to date. More oil from OPEC+ in the coming months and softer demand and rising inventories. We are heading for yet softer levels.

-

 Nyheter3 veckor sedan
OPEC+ missar produktionsmål, stöder oljepriserna
-

 Nyheter4 veckor sedan
Ett samtal om guld, olja, fjärrvärme och förnybar energi
-

 Nyheter2 veckor sedan
Goldman Sachs höjer prognosen för guld, tror priset når 4900 USD
-

 Nyheter2 veckor sedan
Guld nära 4000 USD och silver 50 USD, därför kan de fortsätta stiga
-

 Nyheter3 veckor sedan
Blykalla och amerikanska Oklo inleder ett samarbete
-

 Analys4 veckor sedan
Are Ukraine’s attacks on Russian energy infrastructure working?
-

 Nyheter4 veckor sedan
Guldpriset uppe på nya höjder, nu 3750 USD
-

 Nyheter3 veckor sedan
Ett samtal om guld, olja, koppar och stål


