

Analys
SEB – Jordbruksprodukter, vecka 24 2012
 Kullagertillverkaren SKF:s vinstvarning under onsdagen är ett tecken i tiden på att efterfrågan på sällanköpsvaror har bromsat in. Vi får signaler om att konsumenterna är i samma sinnesstämning som sommaren 2008 – dvs man avhåller sig från större investeringar. Kinas ekonomi bromsar. Indiens bromsar. Europa är i kaos och Greklands nyval äger rum i helgen, den 17 juni, vilket knappast kommer att lösa några problem.
EU kommer att införa positionslimiter för europeiska aktörer i råvaruterminsmarknaden i Mifid 2, som träder i kraft år 2015. Eftersom alla slutkunder handlar råvaruterminer OTC med banken, dvs med banken som motpart, och banken sedan handlar på börsen, kan detta  leda till att kunderna inte kan handla. Intresset hos EU att lyssna på dem som påpekar detta för dem är lika med noll. EU:s syfte med dessa positionslimiter är att undvika möjligheten till manipulation av priser, men det finns inga vetenskapliga bevis för att man åstadkommer detta. Det är också så klart helt obegripligt hur de tror att man kan skydda marknaden mot manipulation utan att reglera den fysiska varumarknaden.
Det verkar också som om det kommer att införas en omsättningsskatt på terminsaffärer inom EU, vilket ökar transaktionskostnaden för att prissäkra jordbruksprodukter. Sverige och Storbritannien har hittills varit ovilliga att gå med på detta, som naturligtvis gör det dyrare att prissäkra bort prisrisk för jordbrukssektorn.
USDA har släppt juni månads upplaga av sina WASDE-estimat för produktion, konsumtion och därmed utgående lager. Det var inga större överraskningar. Möjligen var överraskningen att man inte justerade hektarskördens storlek alls i USA, som ju haft lite mer torka än man räknat med.
FAO har också uppdaterat sina prognoser och de är klart negativa för framtida prisutveckling.
Odlingsväder
Southern Oscillation Index, ett mått på intensiteten i graden av La Niña eller El Niño, sjunkit lägre. Aktuell notering är -8.5. Ett värde lägre än -8 innebär El Niño. El Niño är bra för globalt odlingsväder.

Nedan ser vi ensembleprognosen för ENSO med basdatum den 1 juni. Som vi nämnt ovan, ser vi att ingen av modellerna ens hamnar nära nollstrecket, än mindre en återgång till La Niña. Istället är den här uppdaterade körningen tydligare än i maj, att El Niño kan uppstå redan i juli.

El Niño betyder ökad nederbörd i Sydamerika och i Nordamerika och mindre i Australien och i Sydostasien.
Global spannmålsproduktion
Den totala spannmålsproduktionen i världen 2012 beräknas nu uppgå till rekordhöga 2 419 mt efter att FN:s livsmedels- och jordbruksorganisation (FAO) höjer sin prognos för produktionen med 48,5 miljoner, vilket är 3,2 procent upp jämfört med 2011. Ökningen beror främst på en förväntad rekordskörd av majs i USA.
Utifrån de senaste estimaten skulle den globala spannmålsproduktion överstiga den förväntade användningen för 2012/13, som har justerats upp med 19 mt sedan förra månaden, och leda till en rejäl påfyllnad av världens spannmålslager med 36 mt, eller 7 procent, jämfört med 2011/12.

Vete
Matifvetet med novemberleverans föll tillbaka efter WASDE-rapporten. Tekniskt ligger priset på en nivå där det finns stöd. 206 euro är alltså en viktig nivå, liksom förstås 200 euro på en lägre nivå. Vi har en negativ grundsyn på prisutvecklingen och är hellre säljare än köpare. Detta av två anledningar: att efterfrågan i den globala ekonomin bromsar in och att ENSO förutspås gå in i El Niño, som är gynnsamt för produktionen.

Nedan ser vi Chicagovetet med leverans i december. Priset ligger i den nedre delen av det prisintervall som vetet handlats till sedan december förra året. Det lär locka fram en del köpare, men det kan också innebära en ny fara för att priset bryter ner under intervallet. Men vi måste komma ihåg att decembervete i Chicago nu är mycket billigare än vetet på Matif.

Nedan ser vi hur terminspriserna på Matif och Chicago förändrats den senaste veckan. Matif är oförändrad. Chicago har fallit över alla terminslöptider. Vi är hellre säljare av Matif än av Chicago, i synnerhet vad gäller december 2012, där Chicago ligger på lite drygt 190 euro per ton. Möjligen kan man våga sig på att köpa Chicago december och sälja Matif november i förhoppning om att priserna ska konvergera.

Crop condition för höstvetet i USA, som rapporterades i måndags kväll klockan 22, ligger på 53% good / excellent, vilket är 1% högre än förra veckan.

I WASDE-rapporten justerades produktionen ner med 5 mt för 2012/13.

Nedan ser vi utgående lager, som justeras ner med drygt 2 mt. Global konsumtion minskas med nästan lika mycket som produktionen. Med ett något lägre pris, verkar det kanske lite märkligt att efterfrågan ska minska jämfört med förra månaden. Det är ju inte utbudet, utan priset som normalt ransonerar efterfrågan.

Nedan ser vi ett diagram på utgående lager, uttryckt som antal dagars konsumtion. Vi ser att globala utgående lager är på en relativt låg nivå, och alltså inte väntas stiga 2012/13. Det innebär att potentialen för radikalt lägre priser är begränsad. Det innebär också att priserna kommer att vara svängiga då konsumenter är lite extra oroliga.

FAO:s prognos för den globala produktionen av vete 2012/13 visar en nedjustering från förra säsongen till 680 mt, vilket dock är 5 mt högre än tidigare prognos och fortfarande en bra bit över genomsnittet de senaste fem åren.

Vetearealen och produktionen i Kina 2012/13 förväntas bli oförändrad. I provinserna Henan, Hebei, Anhui, Shandong och Jiangsu, som är de stora producenterna av höstvete, börjar skörden i juni (vissa sydliga provinser har redan startat). Även om torka har rapporterats i Hebei-provinsen, är det dock fortfarande för tidigt att säga om detta kommer att påverka produktionen.
Importen av vete 2011/12 estimeras till 3 mt då importerat vete, särskilt från Australien, är relativt konkurrenskraftigt, jämfört med det inhemska vetet, till både foder och mjöl i de kustnära provinserna.
Importen av vete under 2012/13 förväntas vara fortsatt stark i spåren av fortsatt konkurrenskraftiga priser.

Prognoserna för Rysslands spannmålsskörd 2012 varierar från ett lägsta om 88 mt från vissa branschanalytiker till så högt som 93-94 mt av det ryska jordbruksministeriet. FAS estimerar produktionen till 88 mt, en nedgång från 94 mt förra året, som en följd av dåliga förhållanden för övervintring i de viktiga södra produktionsområdena samt torrt och varmt vårväder i Volga området och i de centrala delarna. I många delar var höstgrödorna i mycket gott skick i mars och början av april, men sedan dess har förväntningarna på avkastning sänkts på grund av en drastisk och oväntad minsknings av markfuktighet. Många lantbrukare har klagat över att det praktiskt taget inte blev någon vår, då den kalla vintern plötsligt byttes ut mot sommarvärme och torka, vilket resulterade i att de varma temperaturerna snabbt smälte snön som snarare avdunstade istället för att tillföra jorden behövlig fukt.
I mitten av maj uppskattades Rysslands höstgrödor att vara i sämre skick än under 2011, men fortfarande i närheten av det femåriga genomsnittet.
USDA estimerar Rysslands vete produktion 2012/13 till 53 mt, en minskning med 3 mt jämfört med förra månaden och ned 3.2 mt från förra året, och som beror på det varma och torra vädret i den europeiska delen av Ryssland. Ihållande torka och varma temperaturer under april och större delen av maj hämmade grödornas utveckling i Rysslands södra distrikt, som står för ca hälften av landets produktion av höstvete. Arealen beräknas uppgå till 25.5 miljoner hektar, oförändrad från förra månaden, och avkastningen estimeras till 2.08 ton per hektar, en minskning med 8 procent från förra året och 6 procent under det femåriga genomsnittet.
Fru Martell är dock lite mera skeptisk och säger att den exceptionella vårvärmen i Ukraina och Ryssland kan ha orsakat mer skador och ett större bortfall än vad som anges av USDA i senaste WASDE-rapporten.

USDA uppskattar produktionen av vete i EU-27 till 131 mt, en minskning med 1 mt från förra månaden och ned 6.4 mt jämfört med förra året. Arealen estimeras till 24.6 miljoner hektar, en minskning med 0.3 miljoner från förra månaden och avkastningen beräknas till 5.32 ton per hektar, jämfört med förra månadens 5.30 t/ha och förra årets 5.36 t/ha.
Ogynnsamma förhållanden har präglat Centraleuropa under stora delar av växtsäsongen med torka under hösten, köldknäppar under vintern och återigen torka under tidig vår. Torftig utveckling i kombination med utvintring har lett till bortfall av höstgrödor, som kommer att ersättas med vårgrödor, vilket resulterar i lägre avkastning.
De redan låga prognoserna för tyska och polska grödor justeras ned ytterligare i denna månads rapport och reflekterar den senaste tidens väderrelaterade skador. Produktionen i Tyskland justeras ned 0.7 mt till 21.8 mt medan produktionen i Polen beräknas till 8.1 mt jämfört med 9.3 mt förra året. För Frankrike, Europas största vete producent, justeras prognosen upp med 0.5 mt från förra månaden till 37 mt som en följd av gynnsamma (blöta) väderförhållanden.
Maltkorn
Novemberkontraktet på maltkorn har fortsatt att handlas sidledes, något svagt. 220 euro tycks vara ett psykologiskt stöd för marknaden.

Potatis
Potatispriset för leverans nästa år, som i slutet av maj var uppe på 17 euro per deciton och sedan såldes ner till 14, har återigen vänt uppåt. Trenden är alltjämt uppåtriktad och vi fortsätter att ha en positiv syn på potatispriset för ny skörd.

Majs
Priset på decembermajs fortsätter i sin negativa trend, som marknaden haft sedan september förra året. Vi tror att majspriset kommer att bryta 500 cent och fortsätta ner. 500 cent är en psykologiskt viktig nivå, inte minst för att det är en så jämn siffra. Jämna siffror brukar attrahera köpordrar av folk som inte tänker längre än så.

Nedan ser vi WASDE-rapporten för majsproduktionen. Vi ser att produktionsestimatet för 2012/13 höjs med 4 mt. Det kanske märkligaste är att man inte justerat hektarskörden i USA, som varit torkdrabbat hittills. För vårens skörd, 2011/12, justerades Brasilien upp till 69 mt.

Nedan ser vi USDAs estimat för utgående majslager. Dessa väntas öka 2012/13, med drygt 3 mt. Detta innebar att marknaden tog rapporten negativt.

Lagren av majs har länge varit låga, men nu väntas alltså högre utgående lager, som ser i nedanstående diagram. Diagrammet visar utgående lager i termer av dagar av konsumtion sedan 1961. Efterfrågan från Kina och andra tillväxtländer och efterfrågan på råvara till etanoltillverkning har hållit lagren pressade. När det gäller etanol är ökningen i efterfrågan med största sannolikhet över. I USA har man nått upp till 10% inblandning och högre går inte att gå utan skador på motorerna. Naturgas har blivit ett extremt billigt bränsle i USA och kommer troligtvis att ta marknadsandelar både på bensinens och därmed också etanolens bekostnad.

Sådden i USA var klar för en månad sedan. USDA har slutat publicera siffror på sådden.
Majsproduktionen i Kina 2012/13 beräknas vara relativt oförändrad från förra året. På grund av lägre vinstmarginaler för sojabönor och bomull i nordost och nordkinesiska slätten, förväntas lantbrukarna att öka majsarealen med 2 procent.
Importen av majs 2011/12 estimeras till 5.5 mt, även om ytterligare inköp av staten kan bli möjliga om priserna på importerad majs håller sig konkurrenskraftiga. Importen under 2012/13 beräknas uppgå till 7 mt på förväntningar om att en stark inhemsk efterfrågan från industri och djuruppfödning kommer att hålla de inhemska majspriserna relativt sett högre än priserna på importerad majs. Flera källor inom industrin säger att de höga majspriserna under säsongen 2011/12 delvis beror på dålig kvalitet i provinserna Hebei, Henan och Shandong, vilket därmed har begränsat utbudet. Förhöjda toxinhalter gör majsen oanvändbar och i mars 2012 uppskattade CNGOIC att ca 5 mt majs innehöll gifter som aflatoxin.
Även om Rysslands veteproduktion fick se en nedjustering av USDA så ser det betydligt bättre ut för landets majsproduktion. USDA justerar upp sin prognos för 2012/13 till 7.8 mt, en ökning med 0.8 mt från förra månaden och upp 1.1 mt från förra året. Den beräknade produktionen slår därmed det tidigare rekordet på 6.7 mt som sattes 2008/09 och som matchades 2011/12. En ökning i areal med 23 procent på årsbasis är den bidragande orsaken och beror på en kombination av högre inhemsk konsumtion av majs som foder, ökad bearbetning av förädlade produkter som gluten och majssirap, och bortfall av höstraps och korn i södra Ryssland som kommer att ersättas.
Sojabönor
Lägre ekonomisk tillväxt runtom i världen tynger sojabönorna. Vi ser ett lite längre prisdiagram på novemberkontraktet nedan. Så länge det inte blir någon störning av höstens sådd i Sydamerika bör priset kunna hålla sig under 1400 cent. Vi tycker att man ska vara såld sojabönor nu, med stop-loss på drygt 1400 cent. Det finns goda möjligheter till lägre priser framöver.

Nedan ser vi WASDE-rapportens produktionsestimat. Det är inga större förändringar för innevarande år, dock en liten uppjustering av Brasiliens skörd och en lika stor nedjustering av Argentinas. För 2012/13 justerades endast Kinas produktion nedåt.

Utgående lager ser vi nedan. Det är otroligt låga utgående lagerestimat för USA. Globalt är dock lagren på en hyggligt bra nivå.

Nedan ser vi nuvarande utgående lager i historiens perspektiv. Lager som räcker i 59 dagar är en relativt hög nivå, trots allt.

Sådden är till 97% klar i USA, dvs den är klar. Det är rekordtidigt.

Raps
Priset på novemberterminen befinner sig fortfarande i rekyl efter vårens kraftiga prisuppgång. Det är större brist på raps än på sojabönor och rapsen är mindre beroende av Kinas efterfrågan.

USDA publicerar även globala estimat på utgående lager för rapsfrö. USDA:s senaste prognos för den globala produktionen av raps är oförändrad från förra månaden på 60.43 mt. Estimatet för produktionen i EU-27 har justerats ned med 0.10 mt (Polen / Ungern) medan produktionen i Ryssland har justerats upp med samma mängd.
första prognosen från Frankrikes jordbruksministerium för 2012 års skörd visar på en 10-procentig minskning för höstrapsen som en följd av den extrema kylan tidigare i år.
Till skillnad från sojabönor är efterfrågan större än produktionen, vilket får till följd att utgående lager minskar. Så har det varit i flera år och det förklarar också styrkan i marknaden för rapsfrö.
Priset måste upp för att stimulera mer produktion, eller ransonera konsumtionen. Globala lager som innan skörd räcker för 12 dagars konsumtion är en mycket låg nivå.

Låga lager innebär att marknaden är oroligare än annars. Prisrörligheten kommer att vara hög.
Gris
Decemberkontraktet har fallit tillbaka 1 cent sedan förra veckan i avvaktande handel.

Nedan ser vi augustikontraktet på hogs på Eurex. Det är 78 kontrakt öppen balans, dvs det är totalt 78 köpta och sålda kontrakt som clearas av Eurex. Jämfört med för ett år sedan är öppen balans högre och stabilare. Marknaden har av allt att döma fått ett visst förtroende i branschen. Det är naturligtvis långt att gå innan likviditeten är så hög som på CME, men så här långt ser det bra ut.

Mjölk
Mjölkpriset har fortsatt att rekylera uppåt för decemberleverans. 16 cent passerades snabbt, liksom 16.50. Det är en lite väl snabb omvärdering och den euforiska uppgången borde vända till motsatsen inom kort.

[box]SEB Veckobrev Jordbruksprodukter är producerat av SEB Merchant Banking och publiceras i samarbete och med tillstånd på Råvarumarknaden.se[/box]
Disclaimer
The information in this document has been compiled by SEB Merchant Banking, a division within Skandinaviska Enskilda Banken AB (publ) (“SEB”).
Opinions contained in this report represent the bank’s present opinion only and are subject to change without notice. All information contained in this report has been compiled in good faith from sources believed to be reliable. However, no representation or warranty, expressed or implied, is made with respect to the completeness or accuracy of its contents and the information is not to be relied upon as authoritative. Anyone considering taking actions based upon the content of this document is urged to base his or her investment decisions upon such investigations as he or she deems necessary. This document is being provided as information only, and no specific actions are being solicited as a result of it; to the extent permitted by law, no liability whatsoever is accepted for any direct or consequential loss arising from use of this document or its contents.
About SEB
SEB is a public company incorporated in Stockholm, Sweden, with limited liability. It is a participant at major Nordic and other European Regulated Markets and Multilateral Trading Facilities (as well as some non-European equivalent markets) for trading in financial instruments, such as markets operated by NASDAQ OMX, NYSE Euronext, London Stock Exchange, Deutsche Börse, Swiss Exchanges, Turquoise and Chi-X. SEB is authorized and regulated by Finansinspektionen in Sweden; it is authorized and subject to limited regulation by the Financial Services Authority for the conduct of designated investment business in the UK, and is subject to the provisions of relevant regulators in all other jurisdictions where SEB conducts operations. SEB Merchant Banking. All rights reserved.

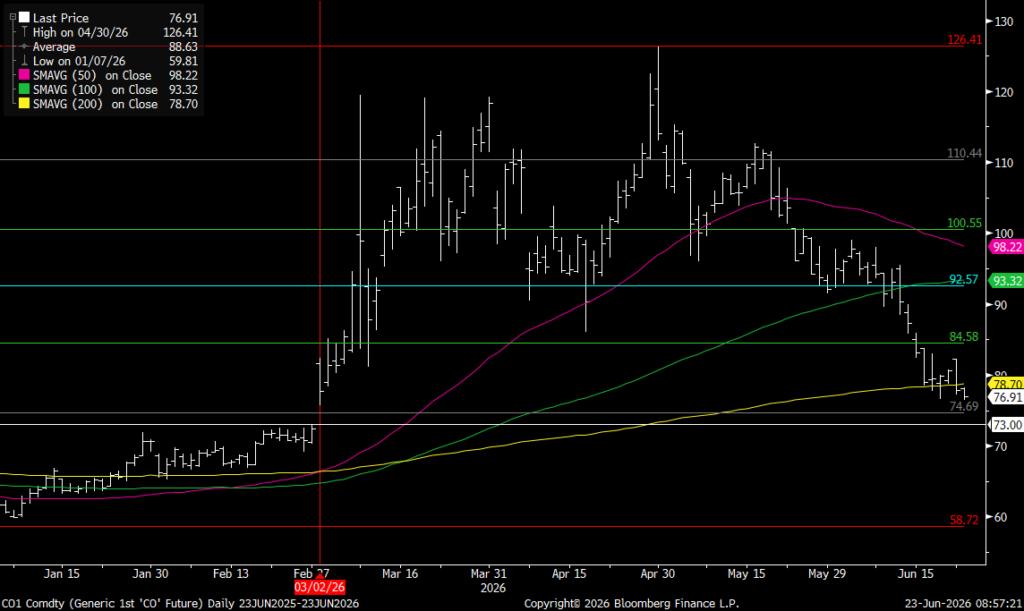
Brent M1 moving below the 200 dma of $78.7/b. Brent crude continued its move lower yesterday with a decline of 3.3% to $77.9/b. This morning it is adding another drop of 1.4% to $76.8/b. Israel bombing Lebanon during the weekend was a violence of the MoU and Iran was quick to declare the SoH closed again. But the willingness to move forward by both the US and Iran obviously trumped the bombing in Lebanon making the event more of a hiccup on the road of further negotiations.

The US has now waived sanctions against Iranian oil exports for two months allowing Iran to sell its oil all over the world, though sanctions instated in Europe will take more time to unwind. Oil from Iran, Russia as well as Venezuela can for the time being be sold across the world without any sharp discount due to sanctions. Chinese Tea-pot refineries will suffer as they previously could buy rebated crude while selling products at market prices.
Crude oil is no flowing out of the SoH with latest number close to 7 mb/d on a three day moving average. That is still well below the 14 mb/d of crude and 6 mb/d of products normally flowing out of the SoH. Latest estimate is that there is around 80 mb of crude on water inside the Persian Gulf and maybe another 80 mb of oil products on water as well. If crude is exiting the SoH at a rate of around 7 mb/d, then the 80 mb of crude would be depleted within 10-15 days and there after the flow would rely on new crude tankers entering, loading and then exiting the SoH to continue further flows. Given the uncertainties surrounding the status of the SoH with Iran stating that it was closed again as recent as this weekend, there is likely an asymmetry here where ships and oil stranded in the SoH for months are much more eager to exit than new ships are eager to enter.
For now Brent crude keeps falling like a rock with the front-end Brent contract now only trading at a premium of $7.6/b above the five year contract. Quickly heading towards parity. The Brent M1 contract has now broken below its 200 dma of $78.7/b and is closing in on the Fibo-level at $74.7/b. Below that there is not much more supporting levels to be found before $73/b which would close the gap from February 3.
Brent crude M1 technical levels
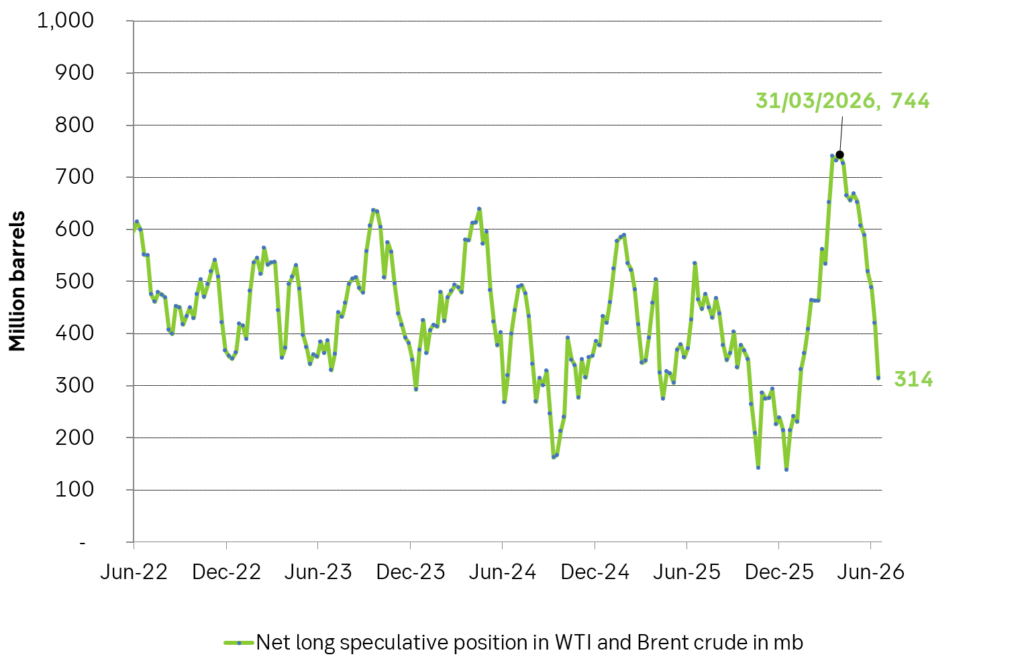
Net long speculative positions are also falling like a rock and as of Tuesday last week the net long positioning in Brent and WTI together summed to 314 million barrels and falling fast.
Will there be a rebound? A possible combination could be an exhaustion of the oil blob caught within the SoH within 1-2 weeks if exits continue at current rate while new ships entering are much more cautious, more Israeli bombardments in Lebanon as Netanyahu fights for re-election, a temporary closure of the SoH again while speculative short positions take cover buying back and covering their positions.
US and Israeli stands versus Iran could harden beyond elections so 2027 surplus is far from given. But Iran and the US are all in all moving towards a set of solutions with both clearly eager to reopen the SoH and keep it open. And that is what the market is pricing along with sharply falling prices. The ongoing discussions will likely take months and last beyond both the upcoming Israeli election (before 27 oct) and the US midterm elections on 3 Nov. Beyond those dates the stance by both Israel and the US may harden again versus Iran. But Iran knows that and is most likely preparing for such a hardening turn. Thus a surplus of oil and global oil stock rebuilding in 2027 (as now is mostly projected) is far from given.
Selling down on a ”deal”. Brent crude fell 6.2% last week with accelerated weakness towards the end of the week. Close of the week at $87.33/b and low of the week (and on Friday) of $85.8/b. Brent is falling another 4% this morning to $83.7/b on confirmation by Iran that a MoU text has been reached and that it will be signed on Friday this week.
So what is this ”deal” worth? Talk on the desk here this morning is that it is much like ”putting lipstick on a pig” where Trump has to sell this at home as a victory where ”the SoH has reopened”, the nuclear issue will be ironed out over the coming 60 days (or maybe 600 days?) and US consumers are getting a lower gasoline price and maybe US republicans survives the midterm elections.
The importance for Iran is that it emerges as the defacto winner of this war in the eyes of the non-US public world. That Iran now onwards is the ”ruler of the SoH” (combo of geography and new weapons systems like drones) or more softer: ”the guarantor of safe passage through the SoH”.
Iran doesn’t need nuclear weapons any more. Nuclear deterrence doesn’t work any more. Ukraine has made many attacks deep into Russia without being nuked in return. Plenty of Iranian ballistic rockets blasts over Israel but Iran wasn’t nuked in return.
There is no trust between the US and Iran. We don’t know all the details yet of the MoU. But what we do know is that there is no trust between the US and Iran what so ever. This is probably more like a descriptive text on how they can cooperate in a way where both sides keeps tactical leverage. Neither side makes irreversible concessions. Violations can be punished quickly. Cooperation produces immediate benefits.
This is a fragile structure. It can easily break down. There may be details which cannot be overcome. To be seen on Friday. The US has to show that it is willing put enough force behind managing and restraining Israel versus Hezbollah in Lebanon. We have seen that Netanyahu hasn’t listened all that much to Trump’s directives and wishes. This could be a major obstacle.
A gradual reopening is tactically preferable for Iran. A tactical leverage for Iran right now is that global oil stocks have been drawn down towards painful and increasingly dangerous levels with increasing risks for oil price spikes in mid-July to August. This together with US midterm elections on 3 November gives tactical leverage to Iran. Iran probably doesn’t want to fully give up on that leverage. A rapid, full reopening where global stocks are able to refill over the coming 60 days will significantly erode that leverage. If Iran reinstates a closure of the SoH after 60 days (if talks break down again), then the effect won’t be that impactful in terms of prices and the US midterm elections.
So a gradual and partial reopening where global markets gets the oil they need while they are unable to rebuild stocks could be a practical middle way for both parties. Trump can sell it as ”the SoH has reopened” and get affordable gasoline for US consumers. Iran can sell it as ”the SoH has fully reopened, but there is some friction” so flow is only 60-80% of normal.
Not much real demand destruction below $100/b. What we do know is that there is not much real price pain demand destruction for oil globally at an oil price below $100/b. A lot of demand-shock destruction. Fear. But demand should now come roaring back towards normal with fear for exceptionally high prices now is rapidly receding.
Sudden China demand destruction due to EVs? Bullocks. EV share of total Chinese carpool now around 13%. Share of new sales of EVs has reached 50%. This is a very gradual process. It doesn’t make oil demand fall like a rock over night. When EV new sales share reaches 100%, then the gasoline car pool will contract by some 5-10% per year. But that is only gasoline. Sudden reduction in Chinese oil demand is more about shock and risk.
Chinese crude oil imports will come roaring back. At what price? Today’s ”neutral” oil price is $70/b. That is the five year price which has steadily traded around the $70/b mark over the past 3-4 years. With still a risky picture one would think that China and the rest of the world will be big buyers of oil in the range of $70-85/b.
Global demand will likely snap back towards normal, forecasted demand and growth at such prices.
Physical reopening is a gradual process. The physical and practical reopening of the SoH will likely be gradual rather than sudden. And that probably suites Iran tactically as well.
Brent M1 price versus the Brent 5-yr (today’s ”normal” price)

Market is starting to take US/Iran headlines with a pinch of salt. Brent crude rose $2.8/b yesterday to an official close of $112.1/b. But after that it traded as low as $108.05/b before ending late night at around $109.7/b. Through the day it traded in a range of $106.87 – 112.72/b amid a flurry of news or rumors from Iran and the US. ”US temporary sanctions during negotiations” (falls alarm). ”We will bomb Iran” (not anyhow),… etc. While the market is still fluctuating to this kind of news flow, it is starting to take such headlines with a pinch of salt.
We’ll see. Maybe, maybe not. The Brent M1 contract is trading at $110.2/b this morning which very close to the average ticks through yesterday of $110.4/b.
Trump with bearish, verbal intervention whenever Brent trades above $110/b it seems. What seems to be a pattern is that Trump states something like ”very good negotiations going on with Iran”, ”New leaders in Iran are great,..”, ”Great progress in negotiations,…”, ”Deal in sight,..” etc whenever the Brent M1 contract trades above $110/b. An effort to cool the market. These hot air verbal interventions from Trump used to have a heavy bearish impact on prices, but they now seems to have less and less effect unless they are backed by reality.
As far as we can see there has been no real progress in the negotiations between the US and Iran with both sides still standing by their previous demands.
Iran is getting stronger while the cease fire lasts making a return to war for Trump yet harder. Iran is naturally in constant preparation for a return to war given Trump’s steady threats of bombing Iran again. Iran is naturally doing what ever is possible to prepare for a return to war. And every day the cease fire lasts it is better prepared. This naturally makes it more and more difficult and dangerous for the US to return to warring activity versus Iran as the consequences for energy infrastructure in the Persian Gulf will be more and more severe the longer the cease fire lasts. Israel seems to see it this way as well. That the war is not won and that current frozen state of a cease fire gives Iran opportunity to rebuild military and politically.
Global inventories are drawing down day by day. How much? In the meantime the Strait of Hormuz stays closed. There is varying measures and estimates of how much global inventories are drawing down. Our rough estimate, back of the envelope, is that global inventories are drawing down by at least some 10 mb/d or about 300 mb/d in a balance between loss of supply versus demand destruction. Other estimates we see are a monthly draw of 250-270 mb/d. The IEA only ’measured’ a draw in global observable stocks of 117 mb in April with oil on water rising 53 mb while on shore stocks fell 170 mb. But global stocks are hard to measure with large invisible, unmeasured stocks. As such a back of the envelope approach may be better.
Oil products is what the world is consuming. Oil product prices likely to rise while product stocks fall. Strategic Petroleum Reserves (SPR) are predominantly crude oil. Discharging oil from OECD SPR stocks, a sharp reduction in Chinese crude imports and a reduction in global refinery throughput of 6-7 mb/d has helped to keep crude oil markets satisfactorily supplied. But global inventories are drawing down none the less. And oil products is really what the world is consuming. So if global refinery throughput stays subdued, then demand will eventually have to match the supply of oil products. The likely path forward this summer is a steady draw down in jet fuel, diesel and gasoline. Higher prices for these. Then, if possible, higher refinery throughput and higher usage of crude in response to very profitable refinery margins. And lastly sharper draw in crude stocks and higher prices for these. But some 6 mb/d of oil products used to be exported through the Strait of Hormuz. And it may not be so easy to ramp up refinery activity across the world to compensate. Especially as Ukraine continues to damage Russian refineries as well as Russian crude production and export facilities.
Watch oil product stocks and prices as well as Brent calendar 2027. What to watch for this summer is thus oil product inventories falling and oil product premiums to crude rising. Another measure to watch is the Brent crude 2027 contract as it rises steadily day by day as the Strait of Hormuz stays closed and global oil inventories decline. The latter is close to the highest level since the start of the war and keeps rising.
The Brent M1 contract and the Brent 2027 prices and current price of jet fuel in Europe (ARA). All in USD/b

Our back of the envelope calculation of the global shortage created by the closure of the Strait of Hormuz. Note that 3.5 mb/d of discharge from SPR is also a draw. Note also that ’Forced demand loss’ of 2.5 mb/d is probably temporary and will fall back towards zero as logistics are sorted out leaving ’Price demand loss’ to do the job of balancing the market. Thus a shortfall of at least 9 mb/d created by the closure. More if SPR discharge is included and more if Forced demand loss recedes.


Brent falling like a rock with oil likely to flow from SoH until at least 3 November

Vattenfalls och Industrikrafts kärnkraftsbolag Videberg Kraft har valt Rolls-Royce SMR
Selling down on a ”deal”

Sommarväder skapar prisrally på elbörsen
Oil product price pain is set to rise as the Strait of Hormuz stays closed into summer
Sommarväder skapar prisrally på elbörsen
Vattenfalls och Industrikrafts kärnkraftsbolag Videberg Kraft har valt Rolls-Royce SMR
Selling down on a ”deal”
Brent falling like a rock with oil likely to flow from SoH until at least 3 November
-
Nyheter3 veckor sedan
Sommarväder skapar prisrally på elbörsen
-
 Nyheter1 vecka sedan
Vattenfalls och Industrikrafts kärnkraftsbolag Videberg Kraft har valt Rolls-Royce SMR
-
Analys1 vecka sedan
Selling down on a ”deal”
-
Analys14 timmar sedan
Brent falling like a rock with oil likely to flow from SoH until at least 3 November