Analys
SEB Jordbruksprodukter, 9 augusti 2012
 Marknaden avvaktar fredagens WASDE-rapport. Rörelserna blir säkerligen stora på fredag. Har man positioner i terminer eller i oprissäkrat spannmål att köpa eller att sälja, ska man nog vara beredd på att agera snarast efter att rapporten släpps klockan 14:30 på fredag.
Gårdagens ministermöte i Ryssland med syfte att diskutera ”food security” gav följande resultat: vice statsministern Arkady Dvokovich sade för det första att man håller fast vid sin prognos om en spannmålsskörd på 75 – 80 mt. För det andra sade han att det inte fanns någon anledning att begränsa exporten. Vi tror, på goda grunder, att skörden av spannmål totalt hamnar på högst 66 mt och motiverar detta mer i detalj nedan.
Teknisk analys av framförallt vete och majs indikerar att priset kan bryta upp efter att ha konsoliderats i två veckor. Vi anser att risken alltjämt är på uppsidan i spannmålspriserna och i oljeväxterna. De senaste två veckornas lugn tror vi får ett abrupt slut senast på fredag klockan 14:30.
Förväntningarna på WASDE-rapporten
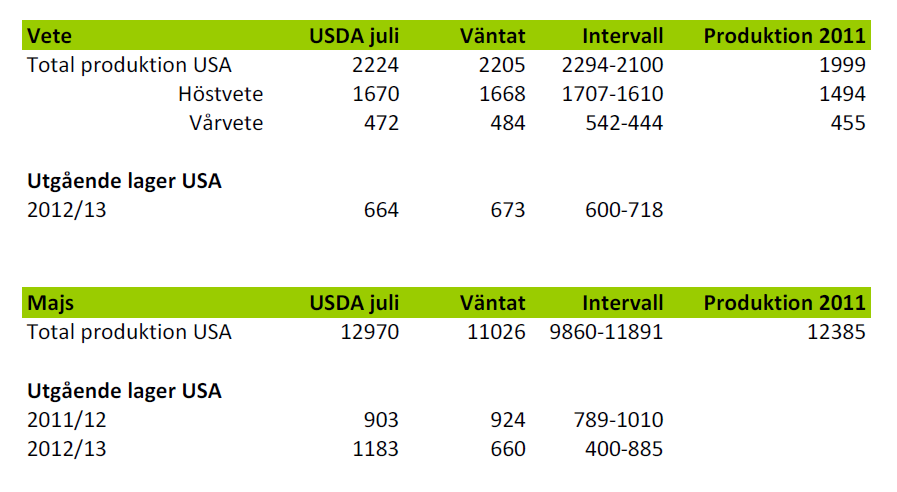
Nedan ser vi marknadens förväntningar på WASDE-statistiken som publiceras på fredag klockan 14:30 svensk tid. Alla siffror är i miljoner bushels. Marknaden kommer att fokusera på majs och sojabönor och på vilken sida siffrorna hamnar i förhållande till de väntade, kommer att avgöra åt vilket håll priserna på dessa – och vetepriset rör sig.
Odlingsväder
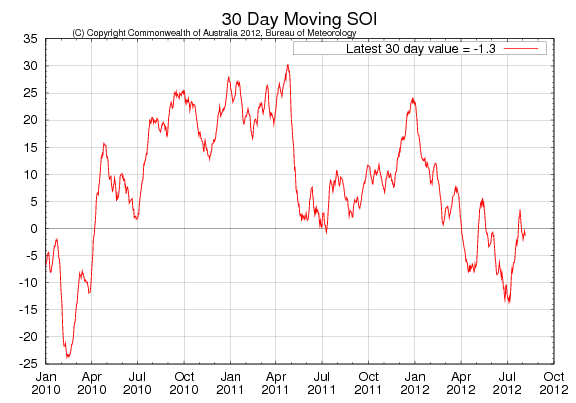
Southern Oscillation Index har tagit sig upp till neutrala förhållanden igen, men det anses vara temporärt, eftersom de flesta prognosmodeller pekar på att ENSO ska vara nära El Niño-förhållanden, dvs med SOI närmare eller lägre än -8.
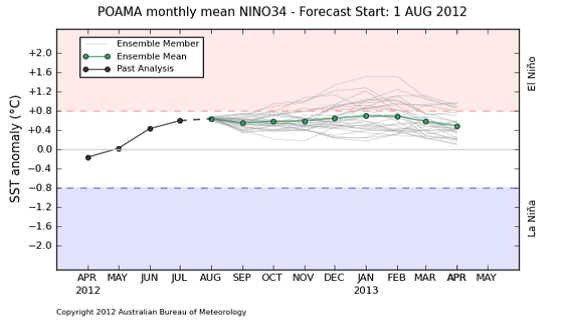
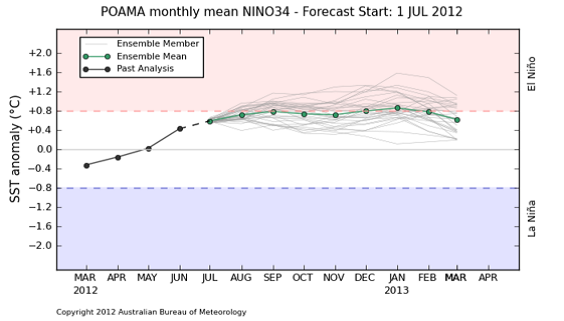
Australiensarnas prognos för ENSO pekar som vi ser nedan på att El Niño kan utveckla sig under hösten, men att det än så länge är osäkert. ENSO surfar precis på gränsen till El Niño. Nedan ser vi den allra senaste ensembleprognosen, som just publicerats.
Om vi jämför den med förra månadens ser vi att sannolikheten för El Niño har minskat något. Ingenstans framåt i tiden ligger den senaste ensembleprognosen på ”El Niño”-territorium. Det gjorde den för en månad sedan.
Vete
Ukraina har i princip skördat färdigt. I Ryssland väntas mer nederbörd. Australiens veteodlingsområden har 60%-80% mindre nederbörd än normalt och man oroar sig där för att tendensen till El Niño ska stärkas. Det motsatta gäller i Argentina. Argentina har haft riklig nederbörd, men prognosen är att det ska bli torrare efter helgen.
I Europa har det kommit in torrare väder, utom som bekant i norra Europa. Som berört ovan ledde inte gårdagens ministermöte om ”food security” i Ryssland till ett exportstopp. Men det utesluter inte att det ändå kan komma. En del menar att det är uteslutet att Ryssland inför exportstopp eftersom de nu är medlemmar i WTO. Det finns dock inte något som hindrar att Ryssland ändå inför någon typ av exportbegränsning eftersom dessa är tillåtna under vissa förhållanden och dessa bestäms av landet självt. Den som tvivlar på detta kan läsa själv på WTO:s egen hemsida.
Som nämnt ovan sade vice statsministern Arkady Dvokovich att skörden blir 75 – 80 mt. Det tror vi inte alls på. Vi tror att total spannmålsskörd hamnar på 66 mt. Per den 3 augusti låg hektarskörden 30% under förra årets. Skörden förra året uppgick till 94 mt och 0.7 x 94 = 65.8 mt. Hektarskörden i Volgaregionenväntas bli 50% lägre än förra året. Vartefter skörden flyttar sig norrut, sjunker hektarskörden. Vi kommer osökt att tänka på Winston Churchills beskrivning, som fast ständigt aktuell, passar särskilt bra här: ”I cannot forecast to you the action of Russia. It is a riddle, wrapped in a mystery, inside an enigma; but perhaps there is a key. That key is Russian national interest.”
Vi vet inte, men vi gissar att Ryssland kommer att införa någon slags exportbegränsning för att få det här att gå ihop. Det är den enda logiska slutsatsen. Detta kommer att trycka upp priserna ännu mer. Förra veckans nyhet om att den amerikanske jordbruksattachén i Kina uppskattade att Kinas veteskörd skulle bli 8 mt lägre än USDA estimerade i juli gick spårlöst förbi i marknaden.
Frankrikes jordbruksdepartement höjde skördeestimatet till 36.7 mt (+0.8 mt). Det är 2.7 mt mer än förra året.
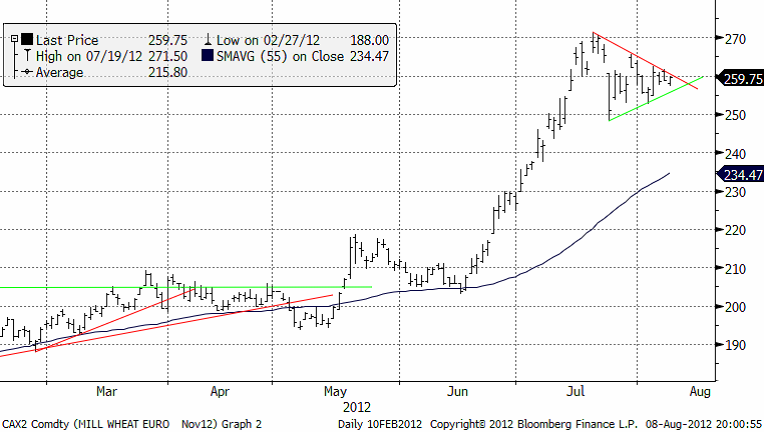
Matifvetet med novemberleverans har format en ”bullish” triangel. Triangeln bildas av att topparna sjunker och bottnarna stiger. Efter den här typen av prisuppgångar som har varit brukar en triangelformation vara en konsolideringfas inför en ny våg av prisuppgångar. Mot bakgrund för det första av risken för en dålig rapport från WASDE på fredag och Rysslands av allt att döma falska uppgifter om hur stor skörden väntas bli i landet, pekar det mesta väsentliga fundamentala informationen vi har, i samma riktning som den tekniska analysen. Vi är inte tvärsäkra, och det är bäst att avvakta och se och sedan försöka vara bland de första som agerar, men det mesta tyder på att priset kommer att fortsätta uppåt.
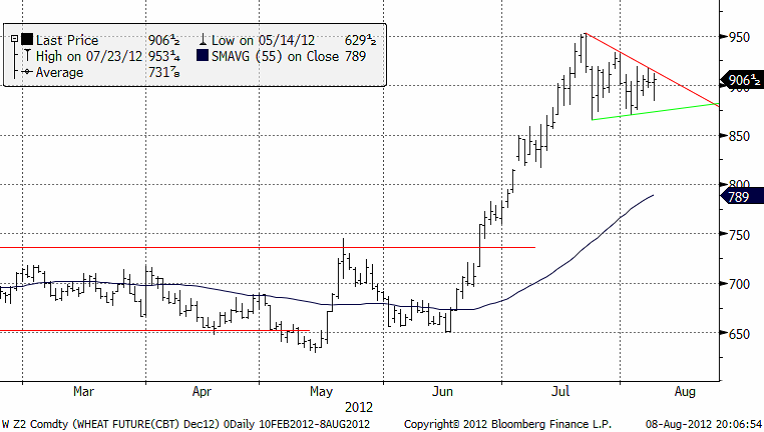
Nedan ser vi Chicagovetet med leverans i december. Vi ser samma triangelformation, som är bullish, i det här diagrammet.
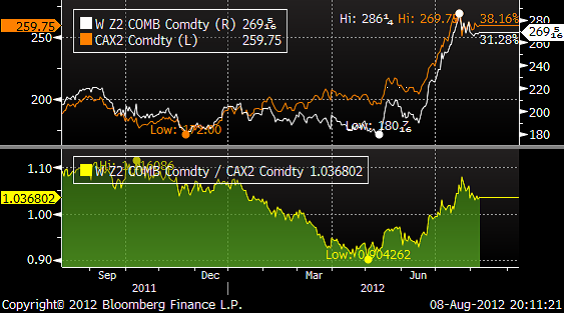
Nedan ser vi prisskillnaden mellan Chicagovete med decemberleverans och Matifs novemberkontrakt. Chicagovetet är omräknat till euro per ton. I den nedre delen av diagrammet ser du kvoten mellan Chicago och Matif. Vi ser att Chicago dragit ifrån Matif och att premien just nu är 3.68%. I början på maj var Chicagos decemberkontrakt 10% billigare än Matif. Detta gör att det finns en potential för Matif att gå upp i pris, bara för att komma ikapp. Ett ryskt exportstopp skulle se till att detta hände.
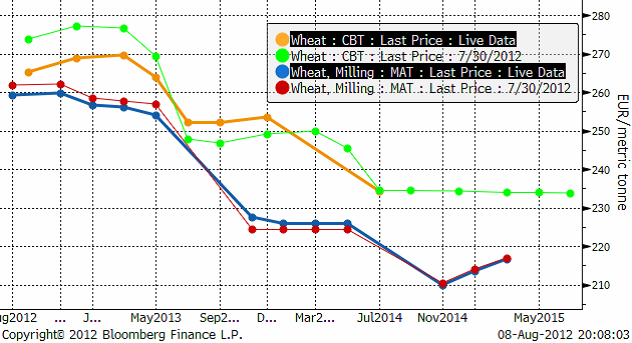
Nedan ser vi hur terminspriserna på Matif och Chicago förändrats den senaste veckan. Backwardation är kraftigare på Matif än i Chicago. Allt annat lika, om man vill prissäkra, får man högre pris på Chicagobörsen. Vill man köpa terminskontrakt med leverans 2013 eller 2014 bör man göra det i Matifkontrakten. Eventuellt kan det vara intressant att handla dem mot varandra.
Maltkorn
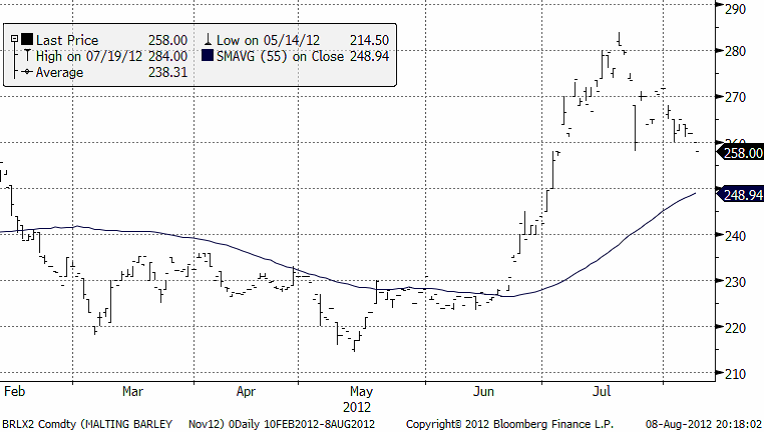
Novemberkontraktet på maltkorn ligger i en nedgångsfas som har stora likheter med vad som i efterhand ofta identifieras som en rekyl inför en ny, kraftig prisuppgång.
Potatis
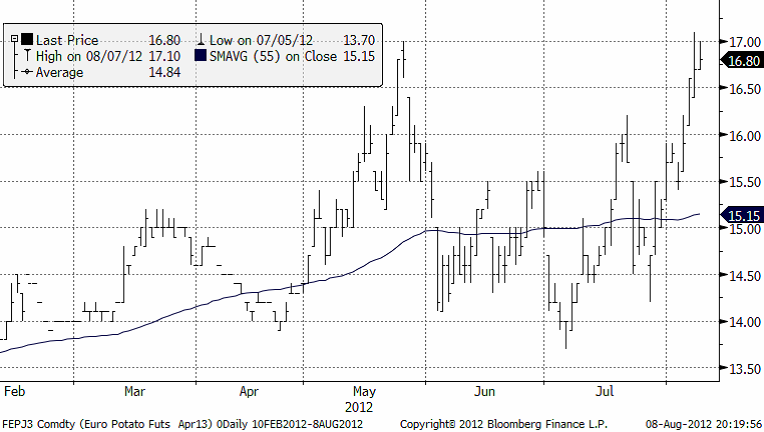
Potatispriset för leverans nästa år har gått upp över 16 euro och tangerar högstanoteringen 17 euro per deciton. Vi skrev förra veckan om intervallet 14 – 16. Att priset nu gått till 17 innebär ändå inte att intervallet är överspelat. Men skulle priset orka gå över 17 euro är intervallet brutet. Det är ett svårt läge nu, när spannmålsmarknaden ser så ”bullish” ut och minst två avgörande besked kan komma inom kort:
WASDE på fredag och när som helst, ett ryskt exportstopp. Om vi inte visste detta, skulle vi tro att priset skulle vända ner på potatis från de här nivåerna.
Majs
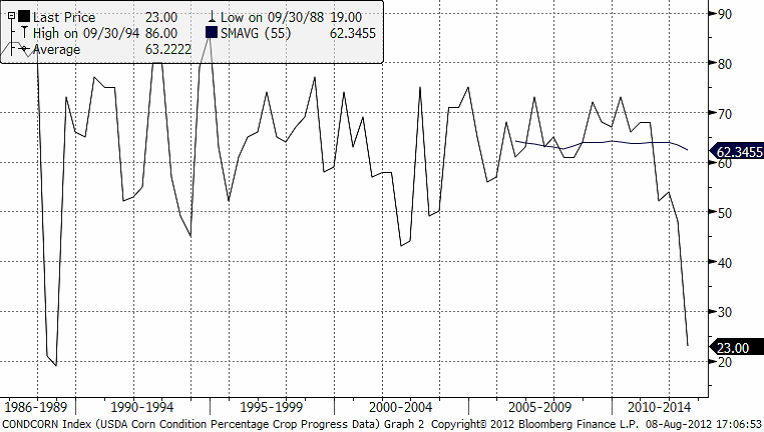
Lättare regn förekommer i mellanvästern, men detta är sannolikt för lite och för sent. Det torra vädret väntas bestå kanske så länge som mot slutet av augusti. Nederbörd har ökat över Ukraina och Ryssland. Det kanske gör någon nytta i Ryssland, men i Ukraina är det för sent. Måndagens crop ratings visade att majs i good / excellent condition minskat 1% till 23%. Poor condition till very poor condition ökade med 2% till 25%. Nedan ser vi ett diagram som visar good/excellent condition sedan 1986. För 24 år sedan, år 1988 låg andelen prima majs på 18%. Annars ser vi att det är ovanligt dåligt i år.
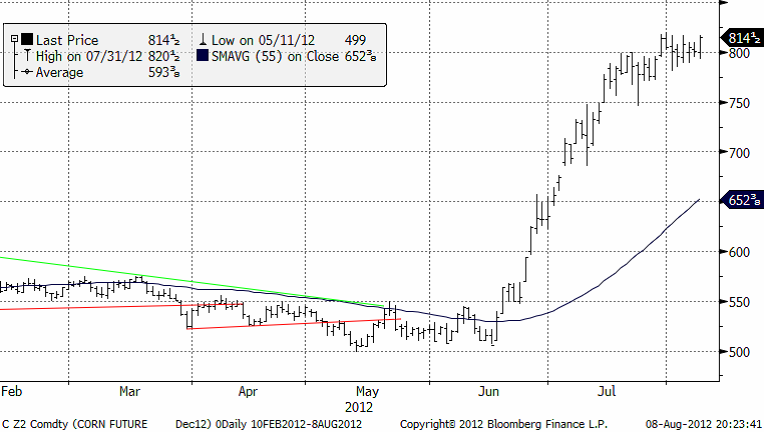
USDA väntas sänka sitt estimat för amerikansk skörd. USDA har också en tendens att inte pytsa ut alla dåliga nyheter samtidigt. Dåliga siffror brukar följas av mer av samma sak, fram till den slutliga siffran i januari. Priset på decembermajs har även den senaste veckan rört sig ”sidledes”. Marknaden är helt klart trött. Alla väntar på fredagens WASDE-rapport. När den kommer blir det säkert nytt liv i marknaden. Och då troligen uppåt.
Sojabönor
Det är små förändringar avseende vädret i de delar av USA där sojabönor odlas. Lättare regn väntas i delar av mellanvästern, men prognoserna visar att det kommer att vara ganska torrt ända fram till slutet av månaden. I Indien har nederbörden ökat, framförallt i de torkdrabbade nordvästra delstaterna.
Osäkerheten inför fredagens WASDE-rapport är stor. Marknadens uppfattning om avkastning per acre i USA varierar mellan 35.8 och 39.5 bushels per acre. Skördad areal varierar varierar också mellan 74 och 75.5 miljoner acres. USDA har en tendens att (fortsätta) sänka avkastningsestimaten fram till dess de publicerar den slutliga siffran i januari.
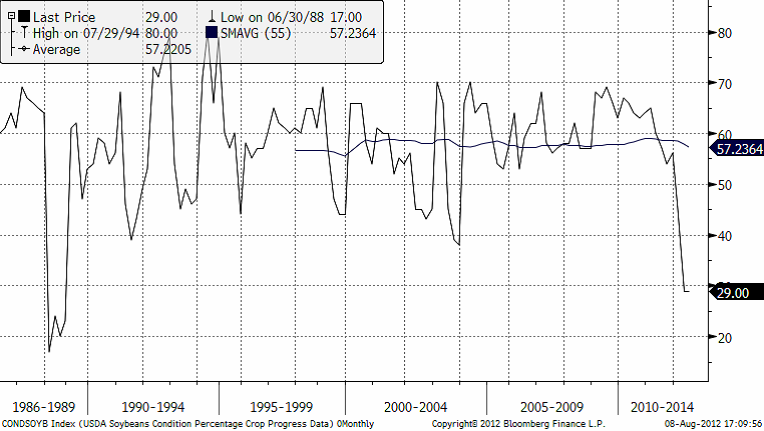
Crop condition som publicerades i måndags låg kvar oförändrat på 29% good/excellent från veckan innan. Däremot ökade andelen i poor/very poor condition med 2%. Som vi ser i diagrammet nedan får vi gå tillbaka till 1988 för att hitta en lägre nivå än 29% i good/excellent condition. Då nåddes som lägst 17%.
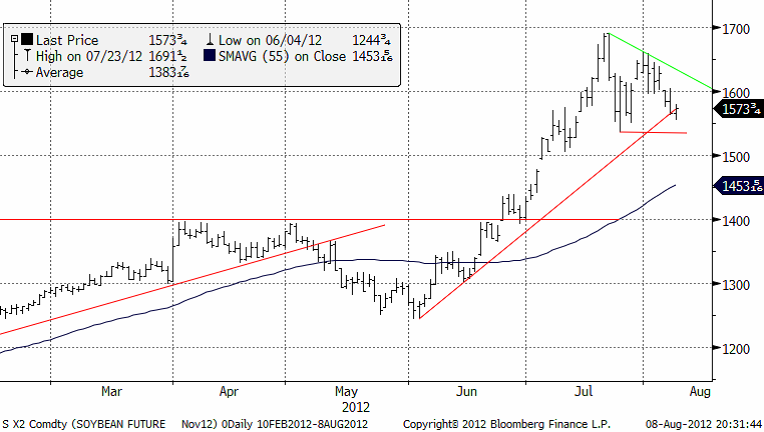
En rekordskörd väntas från Sydamerika nästa år, men fram till dess ska världen hushålla med USA:s skörd. Sydamerikas produktion gynnas av att ENSO, som vi sett ovan ligger nära (eller går helt in i El Niño). Detta innebär riklig nederbörd i Sydamerika. Senaste siffran på hur stor andel som brasilianska bönder redan sålt av kommande skörd är 41%. Den låg på 10% samma tid förra året. Malaysia har höjt exportkvoten för palmolja som kan exporteras skattefritt. Lagren av palmolja har vuxit i landet. Kina har fortsatt att sälja av sina stora lager och har ett importbehov om uppskattningsvis 60 mt av 2012/13 års skörd. Brasilien har exporterat 4.1 mt i juli och bör nu ha endast 4.5 mt kvar att exportera; om man utgår från Abioves estimat om en möjlig export på 31.1 mt. USA har i princip inga gamla sojabönor kvar, så hur Kina tänker lösa det här problemet ska bli intressant att se. Nedan ser vi kursdiagrammet på sojabönor med leverans i november. Den uppåtgående trendlinjen har precis brutits. Stöd finns nu på 1536 cent. Underifrån kommer också 55-dagars glidande medelvärde, som ibland sammanfaller med tekniska stöd. Sojabönor ser ur teknisk synvinkel inte lika ”bullish” ut som vete och majs.
Raps
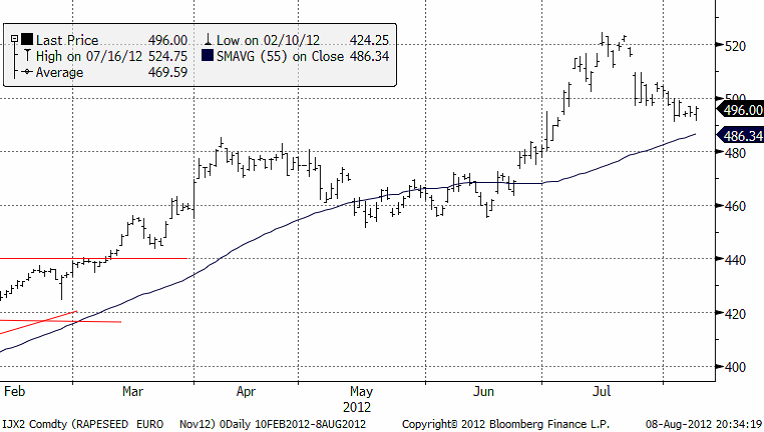
Priset på novemberterminen befinner sig alltjämt i en obruten uppåtgående trend. 500 som var ett starkt stöd, bröts dock, men 480 euro är ett annat starkt stöd.
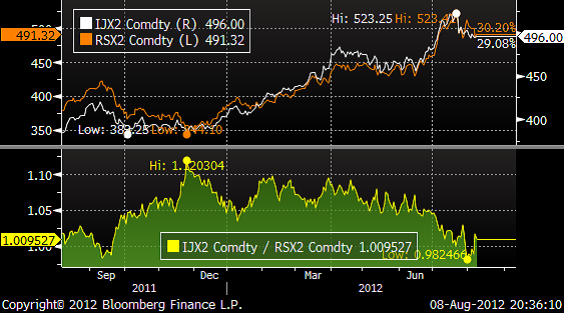
Nedan ser vi kvoten mellan ICE (Canada) Canola (november) och Matif-rapsen. Canolapriset har räknats om till euro per ton.
Vi ser att Matif-rapsen fallit i pris i relation till canolan. I slutet av förra året var premien över 10% för Matif. Nu ligger Matif på par med Canola och har till och med handlats till rabatt i början av augusti. Med tanke på att rapsen noteras i euro, som är svag, kan man tänka sig högre priser (i euro) framöver.
Gris
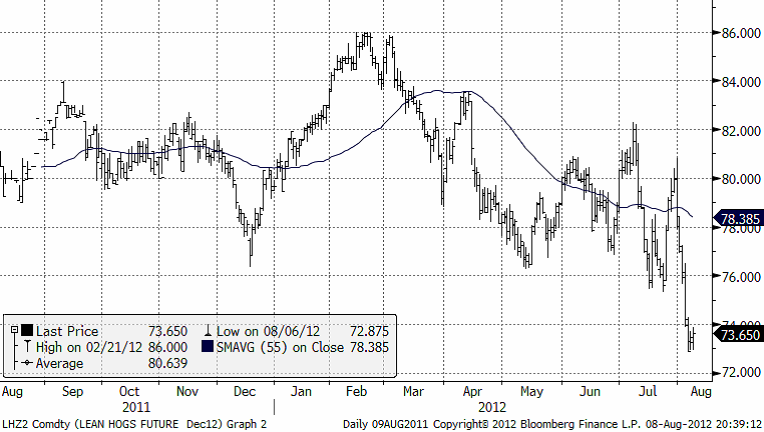
Decemberkontraktet på lean hogs har brutit ner och befinner sig nu i sjunkande trend.
Mjölk
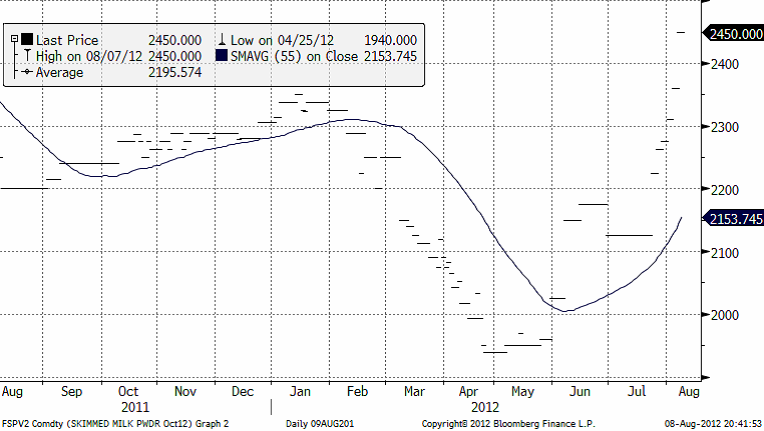
Priset på mjölkpulver i Nordeuropa har fortsatt att stiga kraftigt den senaste veckan. Förra veckan låg priset på Eurex i spotkontraktet på 2275 euro per ton. Nu har priset gått upp till 2450, vilket är närmare +8% på en vecka.
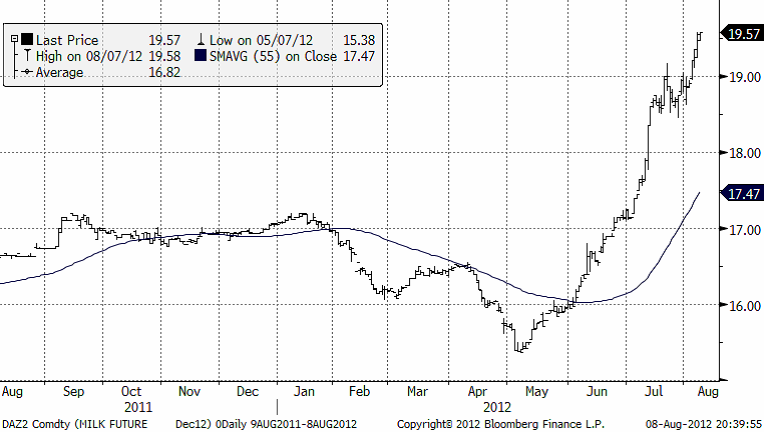
På den amerikanska börsen, där torkan som drabbat foderproduktionen är mycket allvarligare än i Europa, har priset rusat. Nedan ser vi decemberkontraktet. Konsolideringsfasen (en triangel) vid 19 cent per pund, har brutits. Kanske 20 cent kan noteras inom kort?
Socker
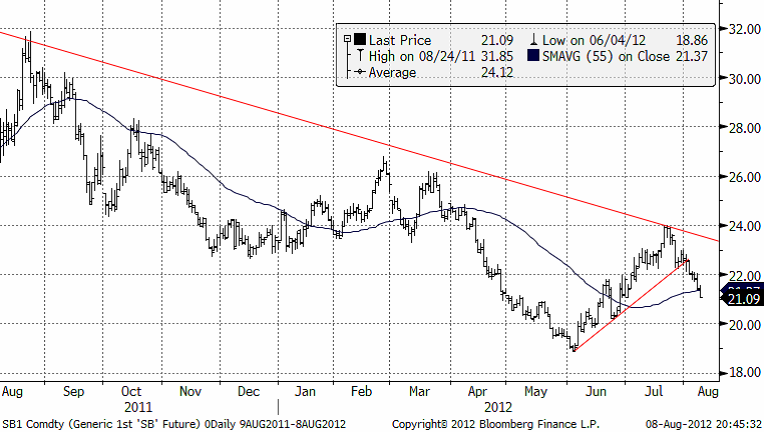
Priset på socker bröt stödet och föll från 22 ner till 21 i skrivande stund. 20 cent per pund är ett tekniskt stöd. Vi tror att priset ska ner och testa den nivån, kanske rentav bottennoteringen från juni på 18.86 cent.
[box]SEB Veckobrev Jordbruksprodukter är producerat av SEB Merchant Banking och publiceras i samarbete och med tillstånd på Råvarumarknaden.se[/box]
Disclaimer
The information in this document has been compiled by SEB Merchant Banking, a division within Skandinaviska Enskilda Banken AB (publ) (“SEB”).
Opinions contained in this report represent the bank’s present opinion only and are subject to change without notice. All information contained in this report has been compiled in good faith from sources believed to be reliable. However, no representation or warranty, expressed or implied, is made with respect to the completeness or accuracy of its contents and the information is not to be relied upon as authoritative. Anyone considering taking actions based upon the content of this document is urged to base his or her investment decisions upon such investigations as he or she deems necessary. This document is being provided as information only, and no specific actions are being solicited as a result of it; to the extent permitted by law, no liability whatsoever is accepted for any direct or consequential loss arising from use of this document or its contents.
About SEB
SEB is a public company incorporated in Stockholm, Sweden, with limited liability. It is a participant at major Nordic and other European Regulated Markets and Multilateral Trading Facilities (as well as some non-European equivalent markets) for trading in financial instruments, such as markets operated by NASDAQ OMX, NYSE Euronext, London Stock Exchange, Deutsche Börse, Swiss Exchanges, Turquoise and Chi-X. SEB is authorized and regulated by Finansinspektionen in Sweden; it is authorized and subject to limited regulation by the Financial Services Authority for the conduct of designated investment business in the UK, and is subject to the provisions of relevant regulators in all other jurisdictions where SEB conducts operations. SEB Merchant Banking. All rights reserved.
Analys
More weakness and lower price levels ahead, but the world won’t drown in oil in 2026

Some rebound but not much. Brent crude rebounded 1.5% yesterday to $65.47/b. This morning it is inching 0.2% up to $65.6/b. The lowest close last week was on Thursday at $64.11/b.

The curve structure is almost as week as it was before the weekend. The rebound we now have gotten post the message from OPEC+ over the weekend is to a large degree a rebound along the curve rather than much strengthening at the front-end of the curve. That part of the curve structure is almost as weak as it was last Thursday.
We are still on a weakening path. The message from OPEC+ over the weekend was we are still on a weakening path with rising supply from the group. It is just not as rapidly weakening as was feared ahead of the weekend when a quota hike of 500 kb/d/mth for November was discussed.
The Brent curve is on its way to full contango with Brent dipping into the $50ies/b. Thus the ongoing weakening we have had in the crude curve since the start of the year, and especially since early June, will continue until the Brent crude oil forward curve is in full contango along with visibly rising US and OECD oil inventories. The front-month Brent contract will then flip down towards the $60/b-line and below into the $50ies/b.
At what point will OPEC+ turn to cuts? The big question then becomes: When will OPEC+ turn around to make some cuts? At what (price) point will they choose to stabilize the market? Because for sure they will. Higher oil inventories, some more shedding of drilling rigs in US shale and Brent into the 50ies somewhere is probably where the group will step in.
There is nothing we have seen from the group so far which indicates that they will close their eyes, let the world drown in oil and the oil price crash to $40/b or below.
The message from OPEC+ is also about balance and stability. The world won’t drown in oil in 2026. The message from the group as far as we manage to interpret it is twofold: 1) Taking back market share which requires a lower price for non-OPEC+ to back off a bit, and 2) Oil market stability and balance. It is not just about 1. Thus fretting about how we are all going to drown in oil in 2026 is totally off the mark by just focusing on point 1.
When to buy cal 2026? Before Christmas when Brent hits $55/b and before OPEC+ holds its last meeting of the year which is likely to be in early December.
Brent crude oil prices have rebounded a bit along the forward curve. Not much strengthening in the structure of the curve. The front-end backwardation is not much stronger today than on its weakest level so far this year which was on Thursday last week.

The front-end backwardation fell to its weakest level so far this year on Thursday last week. A slight pickup yesterday and today, but still very close to the weakest year to date. More oil from OPEC+ in the coming months and softer demand and rising inventories. We are heading for yet softer levels.

Analys
A sharp weakening at the core of the oil market: The Dubai curve

Down to the lowest since early May. Brent crude has fallen sharply the latest four days. It closed at USD 64.11/b yesterday which is the lowest since early May. It is staging a 1.3% rebound this morning along with gains in both equities and industrial metals with an added touch of support from a softer USD on top.

What stands out the most to us this week is the collapse in the Dubai one to three months time-spread.
Dubai is medium sour crude. OPEC+ is in general medium sour crude production. Asian refineries are predominantly designed to process medium sour crude. So Dubai is the real measure of the balance between OPEC+ holding back or not versus Asian oil demand for consumption and stock building.
A sharp weakening of the front-end of the Dubai curve. The front-end of the Dubai crude curve has been holding out very solidly throughout this summer while the front-end of the Brent and WTI curves have been steadily softening. But the strength in the Dubai curve in our view was carrying the crude oil market in general. A source of strength in the crude oil market. The core of the strength.
The now finally sharp decline of the front-end of the Dubai crude curve is thus a strong shift. Weakness in the Dubai crude marker is weakness in the core of the oil market. The core which has helped to hold the oil market elevated.
Facts supports the weakening. Add in facts of Iraq lifting production from Kurdistan through Turkey. Saudi Arabia lifting production to 10 mb/d in September (normal production level) and lifting exports as well as domestic demand for oil for power for air con is fading along with summer heat. Add also in counter seasonal rise in US crude and product stocks last week. US oil stocks usually decline by 1.3 mb/week this time of year. Last week they instead rose 6.4 mb/week (+7.2 mb if including SPR). Total US commercial oil stocks are now only 2.1 mb below the 2015-19 seasonal average. US oil stocks normally decline from now to Christmas. If they instead continue to rise, then it will be strongly counter seasonal rise and will create a very strong bearish pressure on oil prices.
Will OPEC+ lift its voluntary quotas by zero, 137 kb/d, 500 kb/d or 1.5 mb/d? On Sunday of course OPEC+ will decide on how much to unwind of the remaining 1.5 mb/d of voluntary quotas for November. Will it be 137 kb/d yet again as for October? Will it be 500 kb/d as was talked about earlier this week? Or will it be a full unwind in one go of 1.5 mb/d? We think most likely now it will be at least 500 kb/d and possibly a full unwind. We discussed this in a not earlier this week: ”500 kb/d of voluntary quotas in October. But a full unwind of 1.5 mb/d”
The strength in the front-end of the Dubai curve held out through summer while Brent and WTI curve structures weakened steadily. That core strength helped to keep flat crude oil prices elevated close to the 70-line. Now also the Dubai curve has given in.

Brent crude oil forward curves

Total US commercial stocks now close to normal. Counter seasonal rise last week. Rest of year?

Total US crude and product stocks on a steady trend higher.

Analys
OPEC+ will likely unwind 500 kb/d of voluntary quotas in October. But a full unwind of 1.5 mb/d in one go could be in the cards

Down to mid-60ies as Iraq lifts production while Saudi may be tired of voluntary cut frugality. The Brent December contract dropped 1.6% yesterday to USD 66.03/b. This morning it is down another 0.3% to USD 65.8/b. The drop in the price came on the back of the combined news that Iraq has resumed 190 kb/d of production in Kurdistan with exports through Turkey while OPEC+ delegates send signals that the group will unwind the remaining 1.65 mb/d (less the 137 kb/d in October) of voluntary cuts at a pace of 500 kb/d per month pace.

Signals of accelerated unwind and Iraqi increase may be connected. Russia, Kazakhstan and Iraq were main offenders versus the voluntary quotas they had agreed to follow. Russia had a production ’debt’ (cumulative overproduction versus quota) of close to 90 mb in March this year while Kazakhstan had a ’debt’ of about 60 mb and the same for Iraq. This apparently made Saudi Arabia angry this spring. Why should Saudi Arabia hold back if the other voluntary cutters were just freeriding? Thus the sudden rapid unwinding of voluntary cuts. That is at least one angle of explanations for the accelerated unwinding.
If the offenders with production debts then refrained from lifting production as the voluntary cuts were rapidly unwinded, then they could ’pay back’ their ’debts’ as they would under-produce versus the new and steadily higher quotas.
Forget about Kazakhstan. Its production was just too far above the quotas with no hope that the country would hold back production due to cross-ownership of oil assets by international oil companies. But Russia and Iraq should be able to do it.
Iraqi cumulative overproduction versus quotas could reach 85-90 mb in October. Iraq has however steadily continued to overproduce by 3-5 mb per month. In July its new and gradually higher quota came close to equal with a cumulative overproduction of only 0.6 mb that month. In August again however its production had an overshoot of 100 kb/d or 3.1 mb for the month. Its cumulative production debt had then risen to close to 80 mb. We don’t know for September yet. But looking at October we now know that its production will likely average close to 4.5 mb/d due to the revival of 190 kb/d of production in Kurdistan. Its quota however will only be 4.24 mb/d. Its overproduction in October will thus likely be around 250 kb/d above its quota with its production debt rising another 7-8 mb to a total of close to 90 mb.
Again, why should Saudi Arabia be frugal while Iraq is freeriding. Better to get rid of the voluntary quotas as quickly as possible and then start all over with clean sheets.
Unwinding the remaining 1.513 mb/d in one go in October? If OPEC+ unwinds the remaining 1.513 mb/d of voluntary cuts in one big go in October, then Iraq’s quota will be around 4.4 mb/d for October versus its likely production of close to 4.5 mb/d for the coming month..
OPEC+ should thus unwind the remaining 1.513 mb/d (1.65 – 0.137 mb/d) in one go for October in order for the quota of Iraq to be able to keep track with Iraq’s actual production increase.
October 5 will show how it plays out. But a quota unwind of at least 500 kb/d for Oct seems likely. An overall increase of at least 500 kb/d in the voluntary quota for October looks likely. But it could be the whole 1.513 mb/d in one go. If the increase in the quota is ’only’ 500 kb/d then Iraqi cumulative production will still rise by 5.7 mb to a total of 85 mb in October.
Iraqi production debt versus quotas will likely rise by 5.7 mb in October if OPEC+ only lifts the overall quota by 500 kb/d in October. Here assuming historical production debt did not rise in September. That Iraq lifts its production by 190 kb/d in October to 4.47 mb/d (August level + 190 kb/d) and that OPEC+ unwinds 500 kb/d of the remining quotas in October when they decide on this on 5 October.

-

 Nyheter4 veckor sedan
Mahvie Minerals i en guldtrend
-

 Analys4 veckor sedan
Volatile but going nowhere. Brent crude circles USD 66 as market weighs surplus vs risk
-
 Nyheter4 veckor sedan
Aktier i guldbolag laggar priset på guld
-

 Nyheter3 veckor sedan
Kinas elproduktion slog nytt rekord i augusti, vilket även kolkraft gjorde
-

 Nyheter3 veckor sedan
Tyskland har så höga elpriser att företag inte har råd att använda elektricitet
-
 Nyheter4 veckor sedan
Guld når sin högsta nivå någonsin, nu även justerat för inflation
-
 Nyheter3 veckor sedan
Det stigande guldpriset en utmaning för smyckesköpare
-

 Analys4 veckor sedan
Waiting for the surplus while we worry about Israel and Qatar


