

Analys
SEB Jordbruksprodukter, 31 mars 2013

 Lagerstatistiken och den tillhörande odlade arealen i USA var ultrabaissiga. Priserna på majs stängde limit-down. Vete och sojabönor föll kraftigt de också. Pristrenden kommer att gå nedåt härifrån.
Marknadens missbedömning var en av de största någonsin och marknadsrörelsen på Skärtorsdagen en av de största någonsin, i majs bara dämpad av den största tillåtna prisrörelsen.
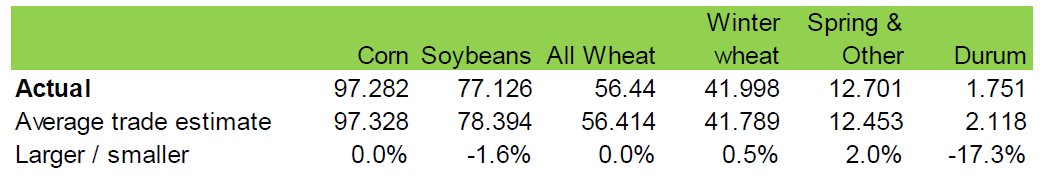
 Sådden av majs väntas ske på 97.3 miljoner acres, något över marknadens förväntningar. Det är den största arealen sedan 1936.
De amerikanska börserna var stängda på Långfredagen, men är öppna på Annandag Påsk. Europa är dock stängt och öppnar först på tisdag. Vi kan förvänta oss betydligt lägre priser på tisdag.
Läsaren kanske kommer ihåg att jag här förra veckan skrev att den rekyl uppåt som vi sett fram till i torsdags, var ett bra tillfälle för lantbrukare att prissäkra. Jag skrev också att risk / reward var på nedsidan, eftersom de senaste rapporterna lett till uppgångar. Nu tänker förmodligen många att ”det är för sent” att prissäkra. I synnerhet som priserna kommer stå ännu lägre på tisdag när Europa öppnar. Att inte prissäkra på tisdag tror jag är ett misstag. Det kommer säkerligen att gå nedåt härifrån. Låt inte ett misstag bli ett misslyckande.
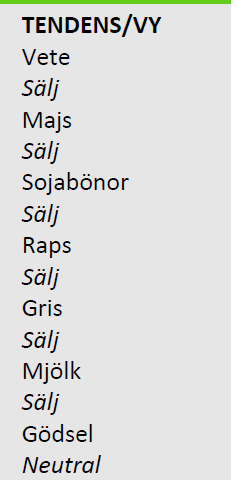
Vi går över till säljrekommendation på alla grödor.
Stocks & Plantings – rapporten i siffror
Lagren av vete, majs och sojabönor var per den 1 mars betydligt högre än vad marknaden förväntat sig, som vi ser i tabellen nedan.
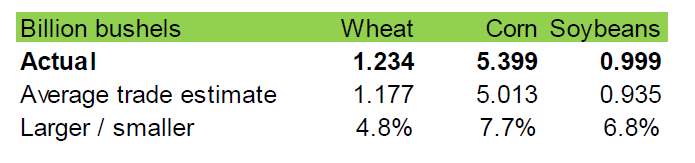
Lagerestimaten år så stora att man undrar om det inte var fel – för låga siffror i decemberrapporten, eller om lagren nu möjligtvis är för stora. Om marknaden tror på siffrorna, och det gör den med all säkerhet, så finns knappast längre någon anledning till oro för att det är kallt och sådden blivit försenad. Vad gäller sojabönor försvann också oron för att sojabönorna ska ta slut i USA innan Brasilien får ut sina.
Sådd areal, som vi ser nedan hade marknadens analytiker bättre koll på, utom för vårvete och durum. Men vi vet redan tidigare att sådden väntas bli mycket stor i år.
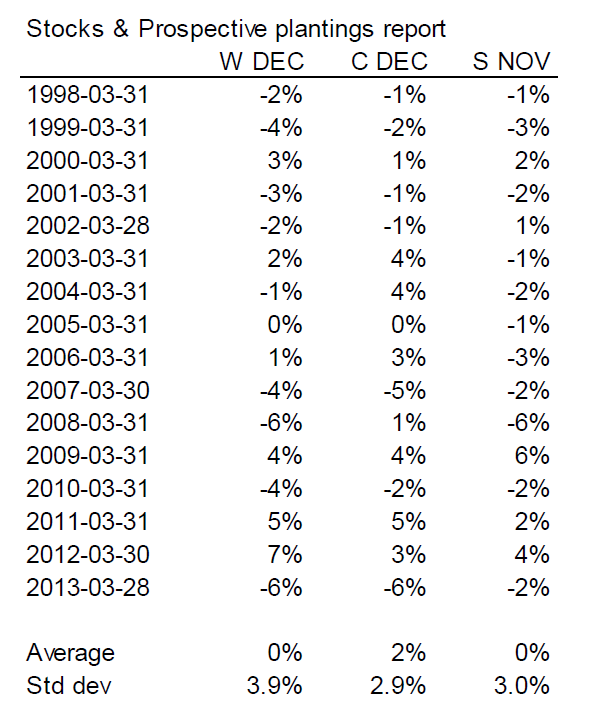
Nedan ser vi prisförändringarna på de senaste årens rapportdagar. Prisreaktionen är uppmätt i respektive års decemberkontrakt för vete och majs och november för sojabönor.
Var hittar man terminspriser på nätet?
Den vanligaste frågan jag får via email från läsare av mitt veckobrev eller marknadskommentaren på ATL.nu är var man kan följa priserna på terminer på nätet. Oftast är det självklaraste svaret att man ska besöka respektive börs hemsida. Börserna publicerar priser som är fördröjda med 15 minuter. Besöker man den tyska börsen Eurex hittar man efter lite letande vad man söker. Men besöker man den franska börsen Matif (som nu är en del av New York Stock Exchange) hittar man det inte. Sidan är också en blandning av franska och engelska.
Ett betydligt bättre sätt är att besöka www.barchart.com.
Jag har än så länge inte sökt något där som jag inte hittat. För enkelhets skull har jag listat svaren på de vanligaste frågorna nedan:
Kvarnvete på Matif
www.barchart.com/commodityfutures/Matif_Milling_Wheat_Futures/MLX11
Raps på Matif
www.barchart.com/commodityfutures/Matif_Rapeseed_Futures/XR
Smör på Eurex
www.barchart.com/commodityfutures/Eurex_Butter_Futures/QYH13
SMP på Eurex
www.barchart.com/commodityfutures/Eurex_Skimmed_Milk_Futures/MRN13
Priserna är fördröjda med 15 minuter. Det duger väldigt väl för att följa med i marknaden och är vad de allra flesta har ändå. Realtidspriser kostar så mycket att bara traders och kundhandlare på bankerna har dem. När det är skarpt läge och man vill handla på telefon kan man få priserna av dem.
Odlingsväder
Det har inte varit några stora förändringar i klimatet i USA. Det är fortsatt torrt.
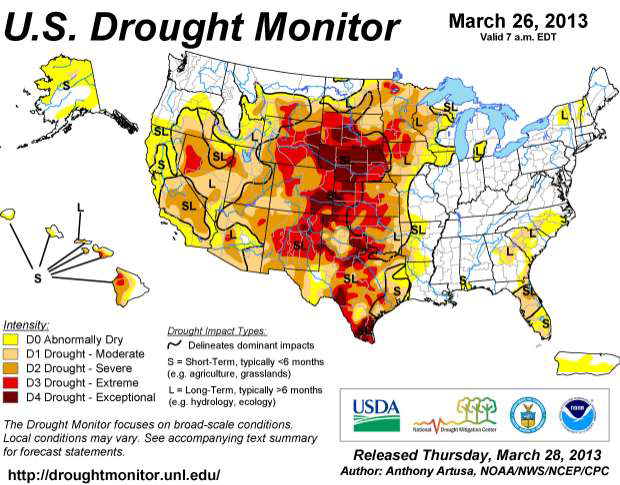
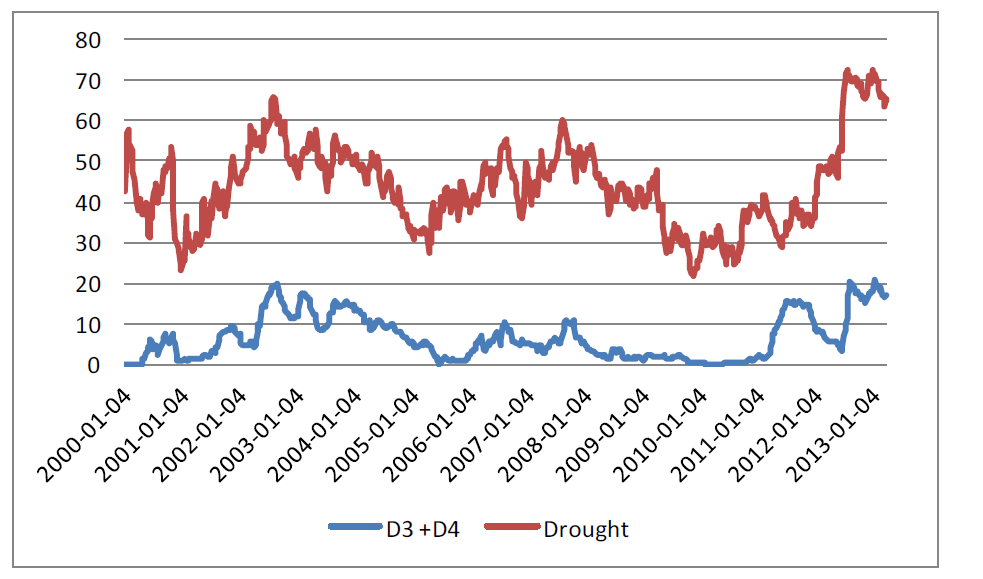
I siffrorna för torkan ser vi att det inte heller där märks av någon skillnad.
Vete
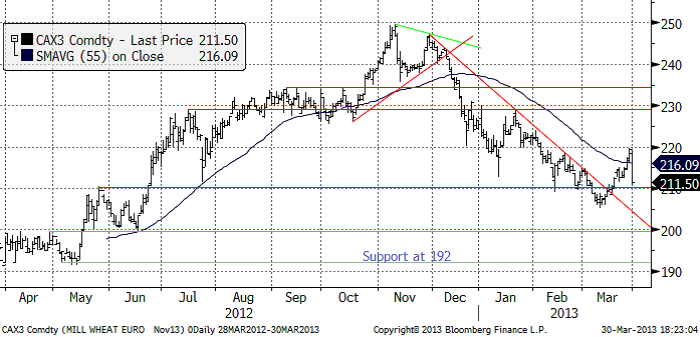
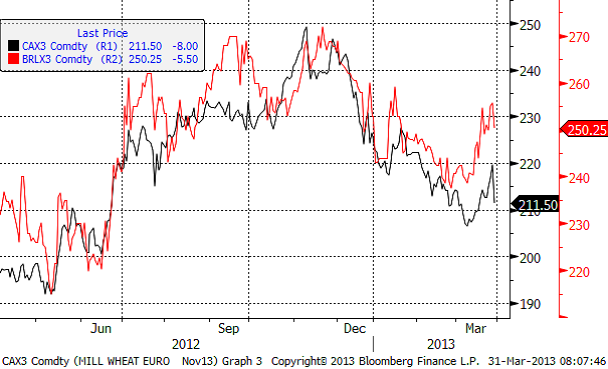
Priset på november (2013) hann falla ner till 211.50 i torsdags innan marknaden föll. Det var lite handel vid femtiden, men sedan hade handlarna på spannmålsfirmorna gått hem och tagit helg de också. Tekniskt ser vi att 210 är en viktig stödnivå. Den lär brytas på tisdag med 200 som nästa stödnivå.
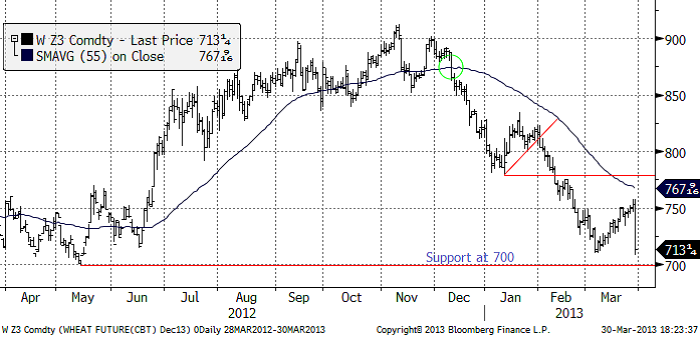
Decemberkontraktet på CBOT föll ner till botten på nedgången från december. Den nivån kommer säkert att testas på måndag och förmodligen brytas. 700 cent är en viktig nivå att hålla koll på. Bryts även den nivån, öppnas för ytterligare prisfall.
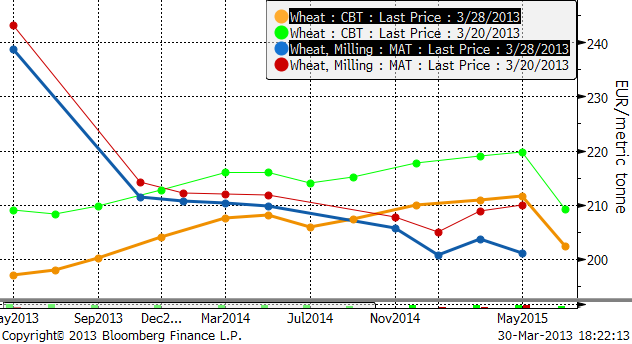
Terminskurvorna (alla i euro / ton) visar att prisfallet varit mycket kraftigare i USA och att lagerstatistiken påverkade alla löptider även för leverans långt bort i tiden. Lagren satt som en propp i marknaden. Matif hann inte alls falla lika mycket i torsdags och har en del ”catch up” att göra på tisdag.
Crop condition för vintervetet i USA börjar publiceras på måndag klockan 22:00. Den senaste uppdateringen är från den 23 november förra året. Då var 33% i good / excellent condition.
Möjligen kan man tänka sig att en ny siffra, som förmodligen inte är sådär fantastiskt bra, kan få vetemarknaden att rekylera uppåt på tisdag. En sådan uppgång kan förmodligen vara ett bra tillfälle att sälja på.
Vi har säljrekommendation på vete.
Maltkorn
Priset på maltkorn med leverans i november har fortsatt att ligga högre än kvarnvetet på Matif. Eftersom maltkorn är en så pass illikvid terminsmarknad reagerade inte priserna på torsdagens rapport. Förmodligen gjordes inget avslut efter 17:00, men jag har inte kollat i detalj. Vi ser att när priset på maltkorn dragit ifrån, som nu, har det alltid återvänt till sin stadiga ”spread” till kvarnvetet. Maltkornet är just nu särskilt säljvärt, mer så än kvarnvetet.
Vi har säljrekommendation på maltkorn.
Majs
Majspriset (december 2013) föll kraftigt, som vi redan nämnt. Lagerrapporten var ultranegativ för majsen. Priset föll förbi botten från nedgången från december, men stängde pga limit-down stopp i handeln över stödet på 530 cent. Den nivån kommer naturligtvis att testas på måndag. På måndag är dessutom största tillåtna prisrörelse utökad eftersom torsdagen stängde limit down.
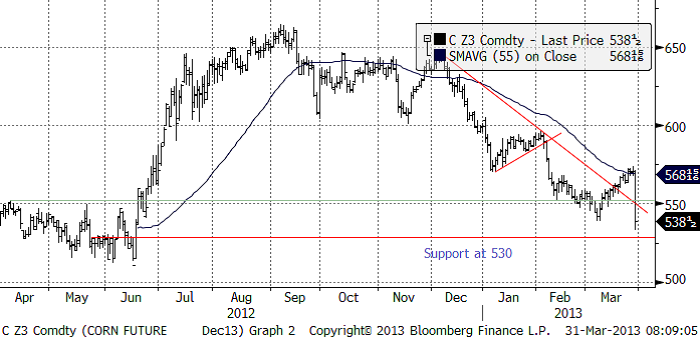
Som nämnt ovan är arealen sådd med majs den största i USA sedan 1936. Sådden är igång i södra USA. Det kommer att bli väldigt gott om majs i år, om det inte blir en ny tork-katastrof. Vi går över till säljrekommendation på majs.
Sojabönor
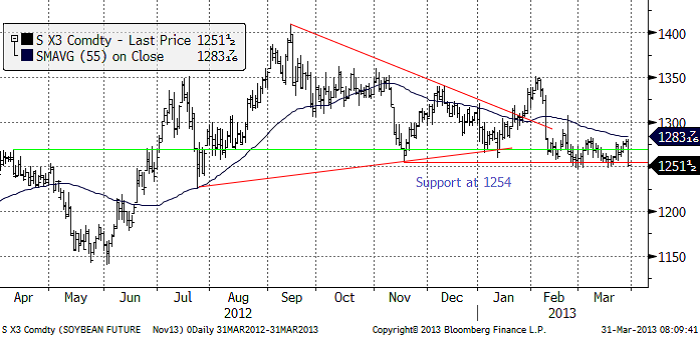
Sojabönorna (november 2013) gick genom stödet på 1254, då lagren visade att USA INTE har någon brist på sojabönor. Möjligen kan detta ifrågasättas, eftersom export inspections har legat tidigt i säsongen – började öka tidigt och började falla tidigt. Det är viktigt för en kort position att priset faller genom stödet på 1250 också och för det behövs bara 2 cent.
Marknaden har i flera veckor ojat sig över att lastningen i hamnarna i Brasilien tar så lång tid. Regnigt väder och arbetslagstiftning är två av orsakerna. En annan är att själva storleken på skörden. Det är flera miljoner ton mer sojabönor som ska exporteras. Om vi tänker på hur våra hamnar i Sverige, Danmark eller Tyskland skulle reagera på några miljoner ton extra att hantera, kanske man får lättare att förstå att det kan bli kö på fartygen.
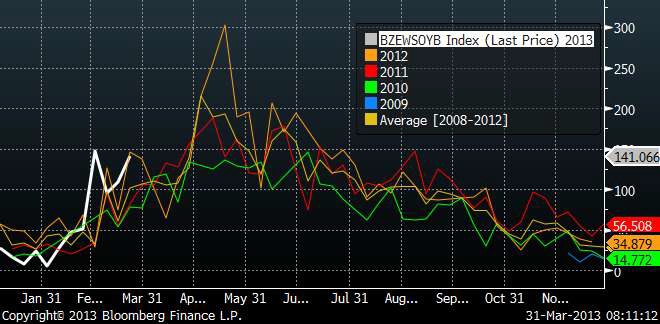
Nedan ser vi Brasiliens export av sojabönor i miljoner dollar FOB. Diagrammet visar de olika kalenderåren. Vi ser att årets export kom igång sent. Säkerligen kommer den vita kurvan att hamna på rekordnivåer senare i år.
Ser vi till skörden av sojabönor i USA, ser vi att det i förhållande till förra året är nästan 20 miljoner ton mer!!!
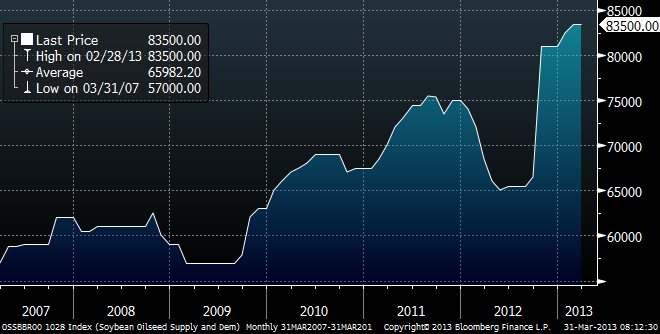
Det är alltså inte konstigt att det är ett problem med sojabönorna i hamnarna i Brasilien. Problemet har varit mycket regn, framförallt, men det stora problemet är skördens och exportens enorma storlek. Det är knappast något som motiverar att priset ska stiga. Snarare tvärtom. Vi går över till säljrekommendation på sojabönor.
Raps
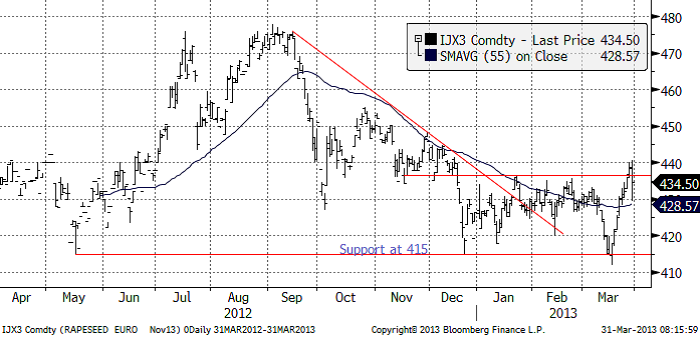
Rapspriset (november 2013) som gick upp och rörde vid 440 euro per ton, följde med sojabönorna ner. Nu kommer priset med största sannolikhet att ge tillbaka vinsterna till marknaden och falla ner mot stödet på 415 euro igen. Vi går nu åter till säljrekommendation på raps.
Gris
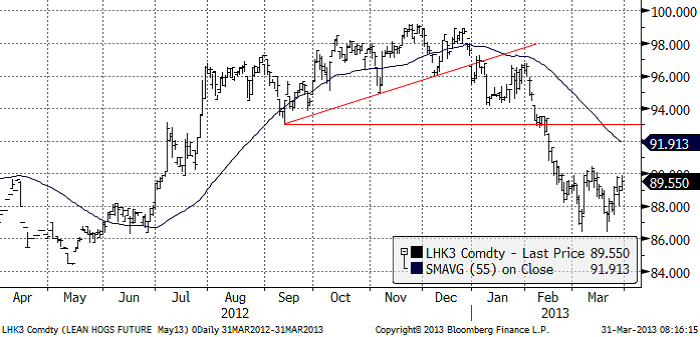
Grispriset (Maj 13) har stabiliserat sig mellan 86 och 90 cent. Det är för tidigt att säga om det här är en konsolidering för en rekyl uppåt, eller en paus inför ytterligare en nedgång.
Mjölk
I kursdiagrammet nedan ser vi fyra kurvor.
BUT1 = priset på det kortaste terminskontraktet på Eurex, på smör.
FSP1 = priset på det kortaste terminskontraktet på Eurex, på SMP.
DPEUWEWM = USDA:s notering på SMP FOB Western Europe.
SMPPMHW2 = Fonterra’s auktionspris på SMP.
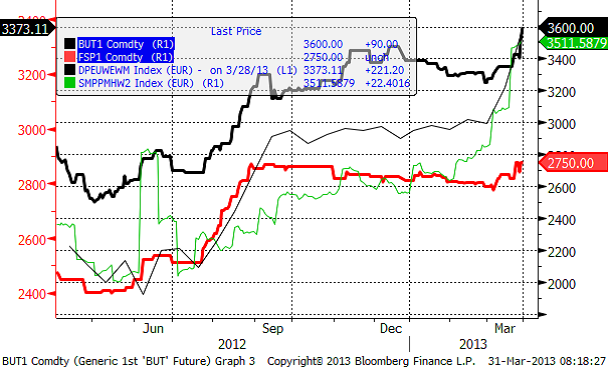
Priset på SMP har rusat och USDA:s notering på europeiska SMP-priser har följt med. Priset på SMP på Eurex har inte följt med, utan ligger på samma nivå som i september och oktober. Terminspriset på smör har däremot handlats upp och ligger nu på all-time-high.
SEB Commodities erbjuder ett litet ”prova-på” kontrakt som består av 0.5 ton Eurex-smör och 0.9 ton Eurex SMP. Ett paket som motsvarar 10 ton flytande mjölkråvara. Just nu är det underliggande värdet på ett sådant kontrakt drygt 33 000 kronor.
Den som vill följa priset på SMP på Eurex gör det via länken:
www.eurexchange.com/exchange-en/products/com/agr/14016/
[box]SEB Veckobrev Jordbruksprodukter är producerat av SEB Merchant Banking och publiceras i samarbete och med tillstånd på Råvarumarknaden.se[/box]
Disclaimer
The information in this document has been compiled by SEB Merchant Banking, a division within Skandinaviska Enskilda Banken AB (publ) (“SEB”).
Opinions contained in this report represent the bank’s present opinion only and are subject to change without notice. All information contained in this report has been compiled in good faith from sources believed to be reliable. However, no representation or warranty, expressed or implied, is made with respect to the completeness or accuracy of its contents and the information is not to be relied upon as authoritative. Anyone considering taking actions based upon the content of this document is urged to base his or her investment decisions upon such investigations as he or she deems necessary. This document is being provided as information only, and no specific actions are being solicited as a result of it; to the extent permitted by law, no liability whatsoever is accepted for any direct or consequential loss arising from use of this document or its contents.
About SEB
SEB is a public company incorporated in Stockholm, Sweden, with limited liability. It is a participant at major Nordic and other European Regulated Markets and Multilateral Trading Facilities (as well as some non-European equivalent markets) for trading in financial instruments, such as markets operated by NASDAQ OMX, NYSE Euronext, London Stock Exchange, Deutsche Börse, Swiss Exchanges, Turquoise and Chi-X. SEB is authorized and regulated by Finansinspektionen in Sweden; it is authorized and subject to limited regulation by the Financial Services Authority for the conduct of designated investment business in the UK, and is subject to the provisions of relevant regulators in all other jurisdictions where SEB conducts operations. SEB Merchant Banking. All rights reserved.

Market is starting to take US/Iran headlines with a pinch of salt. Brent crude rose $2.8/b yesterday to an official close of $112.1/b. But after that it traded as low as $108.05/b before ending late night at around $109.7/b. Through the day it traded in a range of $106.87 – 112.72/b amid a flurry of news or rumors from Iran and the US. ”US temporary sanctions during negotiations” (falls alarm). ”We will bomb Iran” (not anyhow),… etc. While the market is still fluctuating to this kind of news flow, it is starting to take such headlines with a pinch of salt.

We’ll see. Maybe, maybe not. The Brent M1 contract is trading at $110.2/b this morning which very close to the average ticks through yesterday of $110.4/b.
Trump with bearish, verbal intervention whenever Brent trades above $110/b it seems. What seems to be a pattern is that Trump states something like ”very good negotiations going on with Iran”, ”New leaders in Iran are great,..”, ”Great progress in negotiations,…”, ”Deal in sight,..” etc whenever the Brent M1 contract trades above $110/b. An effort to cool the market. These hot air verbal interventions from Trump used to have a heavy bearish impact on prices, but they now seems to have less and less effect unless they are backed by reality.
As far as we can see there has been no real progress in the negotiations between the US and Iran with both sides still standing by their previous demands.
Iran is getting stronger while the cease fire lasts making a return to war for Trump yet harder. Iran is naturally in constant preparation for a return to war given Trump’s steady threats of bombing Iran again. Iran is naturally doing what ever is possible to prepare for a return to war. And every day the cease fire lasts it is better prepared. This naturally makes it more and more difficult and dangerous for the US to return to warring activity versus Iran as the consequences for energy infrastructure in the Persian Gulf will be more and more severe the longer the cease fire lasts. Israel seems to see it this way as well. That the war is not won and that current frozen state of a cease fire gives Iran opportunity to rebuild military and politically.
Global inventories are drawing down day by day. How much? In the meantime the Strait of Hormuz stays closed. There is varying measures and estimates of how much global inventories are drawing down. Our rough estimate, back of the envelope, is that global inventories are drawing down by at least some 10 mb/d or about 300 mb/d in a balance between loss of supply versus demand destruction. Other estimates we see are a monthly draw of 250-270 mb/d. The IEA only ’measured’ a draw in global observable stocks of 117 mb in April with oil on water rising 53 mb while on shore stocks fell 170 mb. But global stocks are hard to measure with large invisible, unmeasured stocks. As such a back of the envelope approach may be better.
Oil products is what the world is consuming. Oil product prices likely to rise while product stocks fall. Strategic Petroleum Reserves (SPR) are predominantly crude oil. Discharging oil from OECD SPR stocks, a sharp reduction in Chinese crude imports and a reduction in global refinery throughput of 6-7 mb/d has helped to keep crude oil markets satisfactorily supplied. But global inventories are drawing down none the less. And oil products is really what the world is consuming. So if global refinery throughput stays subdued, then demand will eventually have to match the supply of oil products. The likely path forward this summer is a steady draw down in jet fuel, diesel and gasoline. Higher prices for these. Then, if possible, higher refinery throughput and higher usage of crude in response to very profitable refinery margins. And lastly sharper draw in crude stocks and higher prices for these. But some 6 mb/d of oil products used to be exported through the Strait of Hormuz. And it may not be so easy to ramp up refinery activity across the world to compensate. Especially as Ukraine continues to damage Russian refineries as well as Russian crude production and export facilities.
Watch oil product stocks and prices as well as Brent calendar 2027. What to watch for this summer is thus oil product inventories falling and oil product premiums to crude rising. Another measure to watch is the Brent crude 2027 contract as it rises steadily day by day as the Strait of Hormuz stays closed and global oil inventories decline. The latter is close to the highest level since the start of the war and keeps rising.
The Brent M1 contract and the Brent 2027 prices and current price of jet fuel in Europe (ARA). All in USD/b

Our back of the envelope calculation of the global shortage created by the closure of the Strait of Hormuz. Note that 3.5 mb/d of discharge from SPR is also a draw. Note also that ’Forced demand loss’ of 2.5 mb/d is probably temporary and will fall back towards zero as logistics are sorted out leaving ’Price demand loss’ to do the job of balancing the market. Thus a shortfall of at least 9 mb/d created by the closure. More if SPR discharge is included and more if Forced demand loss recedes.

Brent is climbing higher. Front-month is at USD 106.3/bl this morning, close to a weekly high and a USD 9/bl jump from Mondays open. This is the move we flagged as a risk earlier in the week: the market shifting from ”a deal is around the corner” to ”this is going to take longer than we thought”.

Analyst Commodities, SEB
During April, rest-of-year Brent remained remarkably stable around USD 90/bl. A stability which rested on one single assumption: the SoH reopens around 1 May. That assumption is now slowly falling apart.
As we highlighted yesterday: every week of delay beyond 1 May adds (theoretically) ish USD 5/bl to the rest-of-year average, as global inventories draw 100 million barrels per week. i.e., a mid-May reopening implies rest-of-year Brent closer to USD 100/bl, and anything pushing into June or July takes us meaningfully higher.
What’s changed in the last 48 hours:
#1: The US military has formally warned that clearing suspected sea mines from SoH could take up to six months. That is a completely different timescale from what the financial market is pricing. Even a political deal tomorrow does not immediately reopen the strait.
#2: Trump has shifted his tone from urgency to ”strategic patience”. In yesterday’s press conference: ”Don’t rush me… I want a great deal.” The market is reading this as a president no longer feeling pressured by timelines, with the naval blockade running in the background.
#3: So far, the military activity is escalating, not de-escalating. Axios reports Iran is laying more mines in SoH. The US 3rd carrier strike group (USS George H.W. Bush) is arriving with two countermine vessels. Trump yesterday ordered the US Navy to destroy any Iranian boats caught laying mines. While CNN reports that the Pentagon is actively drawing up plans to strike Iranian SoH capabilities and individual Iranian military leaders if the ceasefire collapses. i.e., NOT a attitude consistent with an imminent deal!
Spot crude and product prices eased off the early-April highs on a combination of system rerouting and deal optimism. Both now weakening. Goldman estimates April Gulf output is reduced by 14.5 mbl/d, or 57% of pre-war supply, a number that keeps getting worse the longer this drags on.
Demand-side adaptation is ongoing: S. Korea has cut its Middle East crude dependence from 69% to 56% by pulling more from the Americas and Africa, and Japan is kicking off a second round of SPR releases from 1 May. But SPRs are finite.
Ref. to the negotiations, we should not bet on speed. The current Iranian leadership is dominated by genuine hardliners willing to absorb economic pain and run the clock to extract concessions. That is not a setup for a rapid resolution. US/Israeli media briefings keep framing the delay as ”internal Iranian divisions”, the reality is more complicated and points toward weeks and months, not days.
Our point is that the complexity is large, and higher prices have only just started (given a scenario where the negotiations drag out in time). The market spent April leaning on the USD 90/bl rest-of-year assumption; that case is diminishing by the hour. If ”early May reopening” is replaced by ”June, July or later” over the next week or two, both crude and products have meaningful room to reprice higher from here. There is a high risk being short energy and betting on any immediate political resolution(!).
Down on Friday. Up on Monday. The Brent June crude oil contract traded down 5.1% last week to a close of $90.38/b. It reached a high of $103.87/b last Monday and a low of $86.09/b on Friday as Iran announced that the Strait of Hormuz was fully open for transit. That quickly changed over the weekend as the US upheld its blockade of Iranian oil exports while Iran naturally responded by closing the SoH again. The US blew a hole in the engine room of the Iranian ship TOUSKA and took custody of the ship on Sunday. Brent crude is up 5.6% this morning to $95.4/b.
The cease-fire is expiring tomorrow. The US has said it will send a delegation for a second round of negotiations in Islamabad in Pakistan. But Iran has for now rejected a second round of talks as it views US demands as unrealistic and excessive while the US is also blocking the Strait of Hormuz.
While Brent is up 5% this morning, the financial market is still very optimistic that progress will be made. That talks will continue and that the SoH will fully open by the start of May which is consistent with a rest-of-year average Brent crude oil price of around $90/b with the market now trading that balance at around $88/b.
Financial optimism vs. physical deterioration. We have a divergence where the financial market is trading negotiations, improvements and resolution while at the same time the physical market is deteriorating day by day. Physical oil flows remain constrained by disrupted flows, longer voyage times and elevated freight and insurance costs.
Financial markets are betting that a US/Iranian resolution will save us in time from violent shortages down the road. But every day that the SoH remains closed is bringing us closer to a potentially very painful point of shortages and much higher prices.
The US blockade is also a weapon of leverage against its European and Asian allies. When Iran closed the SoH it held the world economy as a hostage against the US. The US blockade of the SoH is of course blocking Iranian oil exports. But it is also an action of disruption directed towards Europe and Asia. The US has called for the rest of the world to engaged in the war with Iran: ”If you want oil from the Persian Gulf, then go and get it”. A risk is that the US plays brinkmanship with the global oil market directed towards its European and Asian allies and maybe even towards China to force them to engage and take part. Maybe unthinkable. But unthinkable has become the norm with Trump in the White House.


Sommarväder skapar prisrally på elbörsen
Oil product price pain is set to rise as the Strait of Hormuz stays closed into summer

Solkraften pressar elpriserna dagtid

Michel Gubel ger sin syn på oljemarknaden