

Analys
SEB Jordbruksprodukter, 28 januari 2013
 Torkan i USA fortsätter att skapa oro för USA:s skörd i år. Samtidigt fortsätter vädret i Brasilien, världens nya kornbod, att vara gynnsamt. Vi gör inga ändringar av rekommendationer den här veckan. Majs ska man hålla ett öga på. Om priset bryter nedåt i veckan som kommer kan en sådan prisnedgång få en förlängning. Den kan i så fall smitta av sig på vetemarknaden och sojamarknaden.
Odlingsväder
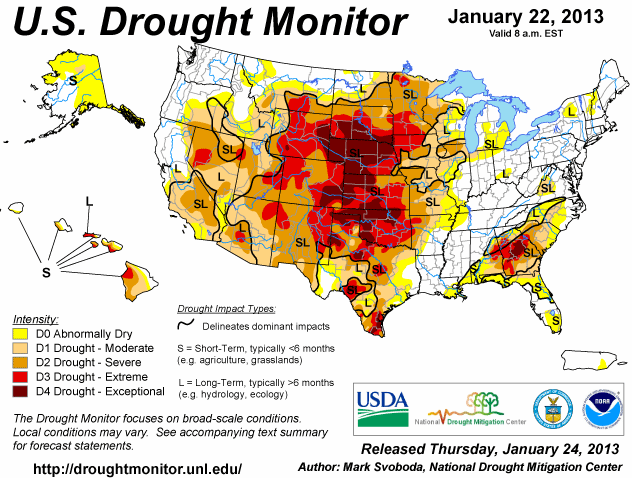
Torkan i USA håller i sig, som vi ser i den senaste ”Drought Monitor”, som publicerades i torsdags. Sedan förra veckan har torkan förbättrats marginellt.
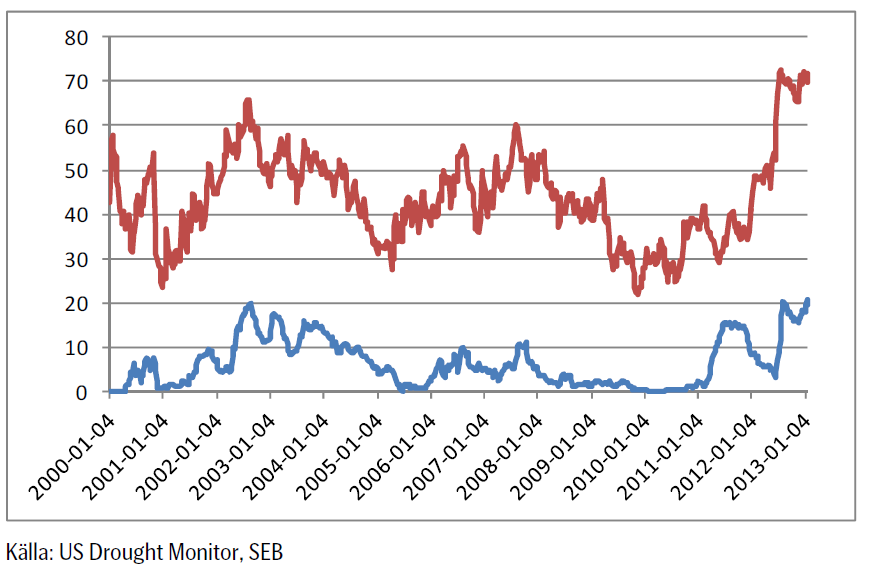
Andelen av USA:s yta som är drabbad av torka minskade marginellt i veckan fram till den rapport som kom förra veckan. Den övre röda linjen visar hur många procent av USA:s areal som är drabbad av någon form av torka. Den nedre blå linjen visar hur många procent som är drabbat av de två värsta varianterna av torka ”extreme” och ”exceptional”.
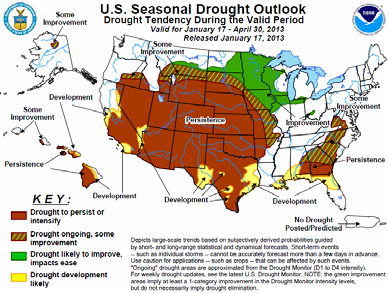
Nedan ser vi prognosen fram till den sista april / första maj, alltså till dess sådden av majs och sojabönor börjar. Alla färgade (ej vita) områden innebär att torkan håller i sig. Det lär alltså vara tämligen torrt när såningsmaskinerna dammar ut på fälten.
Över hela Europa har det kommit nederbörd den senaste tiden, vilket gynnar vintervetet. I västra Ryssland / Ukraina likaså, utom i de allra mest södra delarna. Även Turkiet och nordvästra Afrika har fått ordentlig nederbörd. I nordvästra Afrika avslutade detta en torr period på en månad. Det har också regnat i Sydostasien, vilket gynnar odlingen av ris. I Argentina har det kommit lättare nederbörd i de södra delarna.
De torra delarna av världen är norra Argentina, som är ett viktigt odlingsområde. Australien är rekordtorrt och så USA, som vi sett ovan är nästan rekordtorrt, nästan som 1939, det sista året av ”Dust Bowl” på 1930-talet.
Vete
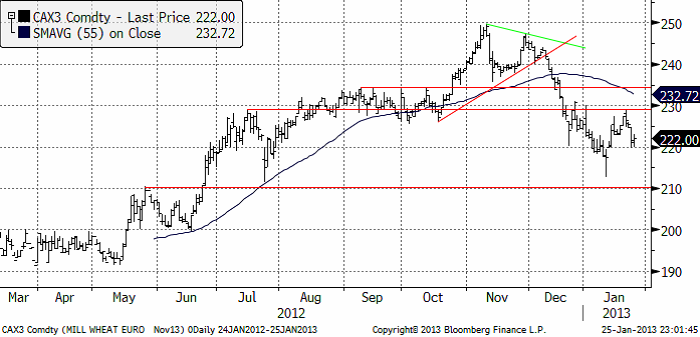
Priset på november (2013) kontraktet nådde upp till den tekniska motståndslinjen på 229 euro per ton, där det fanns tillräckligt med säljare för att trycka ner priset till 220. Veckan stängde på 222 euro.
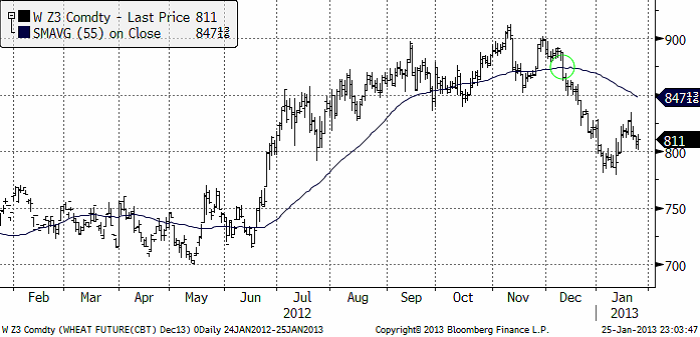
Nedan ser vi decemberkontraktet på CBOT. Uppgången i januari framträder nu allt mer som vi beskrev den i förra veckobrevet. Som en rekyl mot en fallande trend. Marknaden fann dock stöd i torsdags och fredags på 800 cent (en jämn siffra; jämna siffror är naturliga platser att vänta sig stöd och motstånd). Om måndagens handel öppnar uppåt, får vi ta det som tecken på ytterligare en rekyl uppåt, mot trenden. Omvänt, om marknaden öppnar veckans handel med att sjunka under 800 cent, eller gör det senare i veckan, ska vi tolka det som att marknaden kan vara beredd på att fortsätta den nedåtgående trenden.
Det gick rykten i veckan om att Ryssland skulle ta bort importskatten på 5% på vetet. Det har kommit rapporter om brist på vete från Ryssland. I fredags gick dock Rysslands vice premiärminister ut och dementerade att landet skulle ta bort importskatten. Förmodligen är det tullsamarbetet med spannmålsrika Kazakstan som hindrar detta. Till bilden av spannmålsbrist i Ryssland kan fogas nyheten om att den ryska Spannmålsorganisationen skrev av 8% av vintervetet då detta inte grott. De sade också i veckan att 7% sannolikt skadas pga bristen på skyddande snötäcke i kölden. Det ser ut som om Ryssland skulle behöva importera ett par ton.
EU:s vete tar slut den 24 juli med USDA:s prognos för utgående lager. EU:s export har däremot varit ännu högre än USDA räknat med. Därför måste EU:s höga exporttakt resten av säsongen ligga 13% lägre än hittills för att hålla USDA:s prognos, som knappast kan bli lägre, eftersom lagret i praktiken nästan innebär att det är tomt på sina håll.
Fundamentalt ser det alltså ganska oroligt ut. Den globala vetesituationen kan utvecklas både åt det bättre hållet, eller åt det sämre. Just nu ser det ut tämligen oroväckande ut och vi kan trots det höga priset inte rekommendera sälj. Vi fortsätter med neutral rekommendation.
Maltkorn
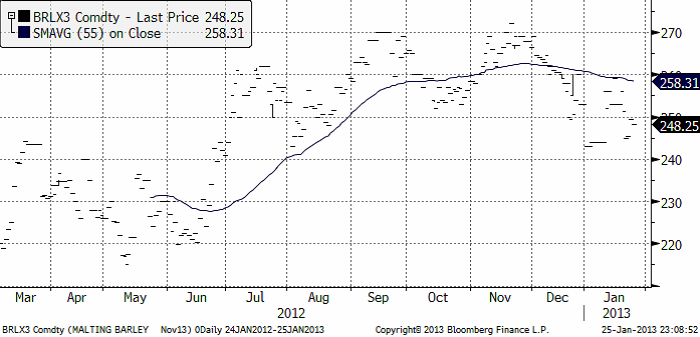
November 2013-kontraktet föll under veckans oroliga handel från 253 till 248.25 euro per ton. Maltkornet gick därmed ner – samtidigt som vetet steg.
Potatis
Potatispriset för leverans i april nästa år (2014) föll marginellt från 15.90 förra veckan till 15.80 i fredags vid stängning.
Majs
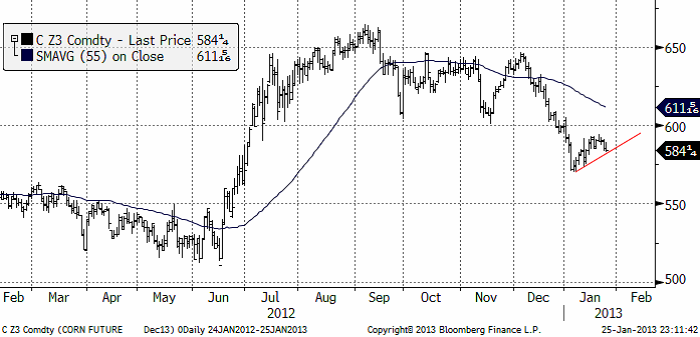
Majspriset (december 2013) fortsatte sin rekyl uppåt, men slutade veckan med prisnedgångar. Priset ligger nu precis på rekylens tekniska stöd. Om marknaden börjar veckan med att falla, bryts stödet och vi får anse rekylen överstökad. Då finns potential att testa den föregående bottennoteringen från januari på 570 cent. Nästa stöd finns i så fall på 550 cent.
Sådden i Argentina är ännu inte klar, därför att det har varit för torrt. Normalt sett börjar majsen blomma i januari. Den engelska termen är ”silking”, som beskriver mer hur majsen ser ut när den blommar. Effekten tolkas motstridigt av BAGE och regeringen i Argentina, där regeringen är mer avslappnad och frikostig med exportlicenser. Jag tror man ska tolka detta med vetskapen om den allmänna kortsiktighet som präglar landets styrning.
I övrigt väntas rekordstor areal (mitt i torkan i USA, vilket ger enorm osäkerhet). Hur det här kommer att utveckla sig får vi tolka en dag i taget. Den tekniska analysen blir viktig i detta. Just nu ligger som ovan nämnt, priset precis på en stödlinje. Bryts den nedåt i veckan, får vi tolka detta som en kortisktig säljsignal. I annat fall får vi hålla oss neutrala.
Sojabönor
Sojabönorna (november 2013) var i veckan uppe på ett pris över motståndslinjen från toppen i september.
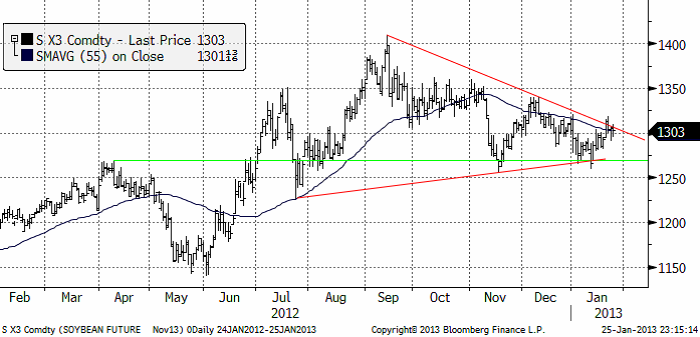
USA:s export ligger över förra årets. Argentinas export ligger dock efter. En tolkning är att bönderna behåller lager som en inflationshedge. Även här får vi ta marknadens utveckling en dag i taget. Den tekniska analysen säger just nu ingenting. Så vi får vänta i neutralt läge.
Raps
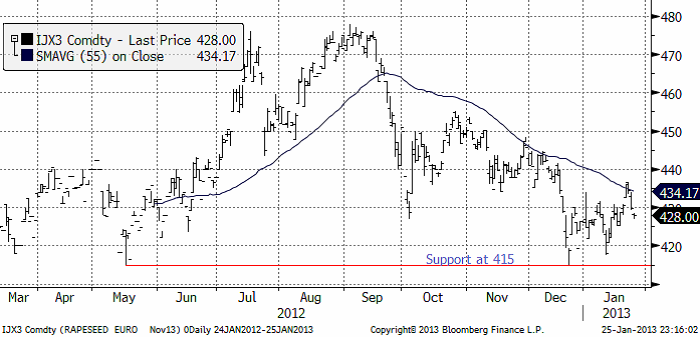
Rapspriset (november 2013) fortsatte upp i början av veckan, men vände sedan ner. Tekniskt ser diagrammet ut som rörelsen sedan december är en rekyl i en fallande marknad. Vi fortsätter därför med säljrekommendationen.
Gris
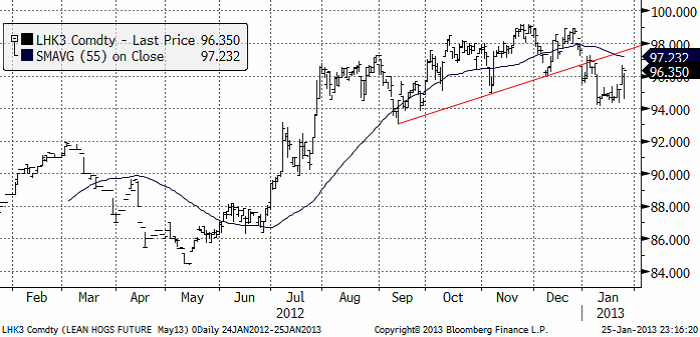
Grispriset (Maj 13), amerikansk Lean Hogs, har rekylerat uppåt efter brottet nedåt av stödlinjen vid årsskiftet. Rekylen uppåt följer ett klassiskt mönster. Den är ett säljtillfälle.
Mjölk
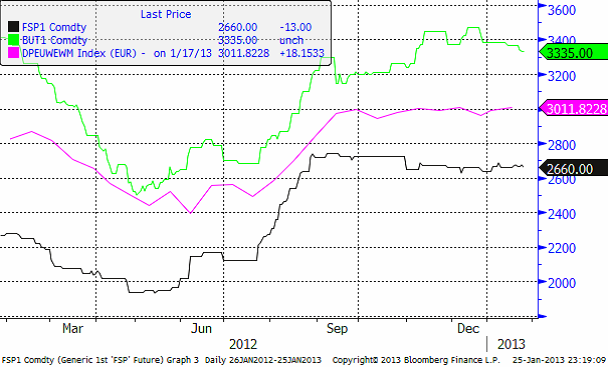
I diagrammet nedan ser vi tre kurvor.Den gröna linjen är priset på skummjölkspulver i euro per ton på Eurex-börsen. Den blå är priset på smör på Eurex börsen. Priserna på Eurex anges i euro per ton.
Slutligen så den gröna linjen. Den visar priset på helmjölkspulver (WMP) FOB Västeuropa. Källan är USDA och priserna uppdateras varannan vecka. Vi ser att WMP-priset legat stabilt det fjärde kvartalet förra året, med en liten nedgång mot slutet av året. 2013 har dock börjat med en liten prisuppgång.
Det börsbaserade priset i svenska kronor beräknas med formeln:

där
BUT = priset på smör i euro per ton
SMP = priset på skummjölkspulver i euro per ton
FX = växelkursen för EURSEK.
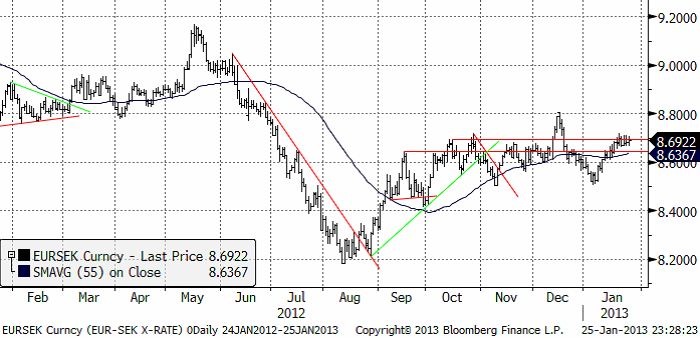
EURSEK
EURSEK rörde sig ”sidledes” i veckan som gick. De som läste vårt förra veckobrev minns att vi skrev att det var det mest troliga. Nu står marknaden och väger, precis på det övre motståndet. Vanligtvis brukar marknaden falla tillbaka i lägen som det här. Men, om veckan börjar med stigande kurser, kan det bli en förlängning på uppgången, i så fall till 8 kronor jämnt i första hand.
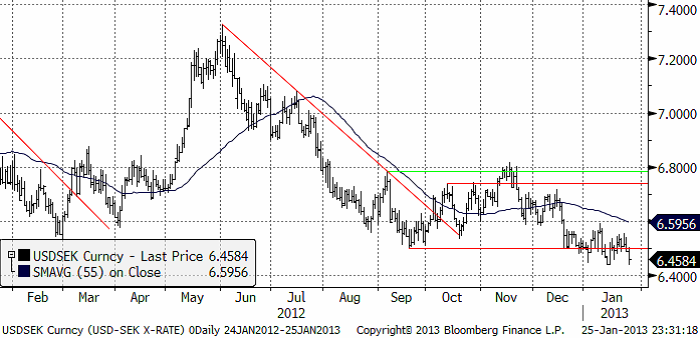
USDSEK
Dollarn har fortsatt att utveckla sig svagt mot kronan. I fredags föll kursen ner mot den senaste månadens stödnivå, som dock höll. I alla fall i fredags. Men det ser ut som om trenden nedåt är stark och gissningsvis vinner den. Vi tror att dollarförsvagningen fortsätter, drivet av att ”Fiscal Cliff” återigen rycker allt närmare.
[box]SEB Veckobrev Jordbruksprodukter är producerat av SEB Merchant Banking och publiceras i samarbete och med tillstånd på Råvarumarknaden.se[/box]
Disclaimer
The information in this document has been compiled by SEB Merchant Banking, a division within Skandinaviska Enskilda Banken AB (publ) (“SEB”).
Opinions contained in this report represent the bank’s present opinion only and are subject to change without notice. All information contained in this report has been compiled in good faith from sources believed to be reliable. However, no representation or warranty, expressed or implied, is made with respect to the completeness or accuracy of its contents and the information is not to be relied upon as authoritative. Anyone considering taking actions based upon the content of this document is urged to base his or her investment decisions upon such investigations as he or she deems necessary. This document is being provided as information only, and no specific actions are being solicited as a result of it; to the extent permitted by law, no liability whatsoever is accepted for any direct or consequential loss arising from use of this document or its contents.
About SEB
SEB is a public company incorporated in Stockholm, Sweden, with limited liability. It is a participant at major Nordic and other European Regulated Markets and Multilateral Trading Facilities (as well as some non-European equivalent markets) for trading in financial instruments, such as markets operated by NASDAQ OMX, NYSE Euronext, London Stock Exchange, Deutsche Börse, Swiss Exchanges, Turquoise and Chi-X. SEB is authorized and regulated by Finansinspektionen in Sweden; it is authorized and subject to limited regulation by the Financial Services Authority for the conduct of designated investment business in the UK, and is subject to the provisions of relevant regulators in all other jurisdictions where SEB conducts operations. SEB Merchant Banking. All rights reserved.

Parts of the Brent crude curve dipping into the high $50ies/b. Brent crude fell 2.3% over the week to Friday. It closed the week at $61.29/b, a slight gain on the day, but also traded to a low of $60.14/b that same day and just barely avoided trading into the $50ies/b. This morning it is risk-on in equities which seems to help industrial metals a little higher. But no such luck for oil. It is down 0.8% at $60.8/b. This week looks set for Brent crude to dip its feet in the $50ies/b. The Brent 3mth contract actually traded into the high $50ies/b on Friday.

The front-end backwardation has been on a weakening foot and is now about to fully disappear. The lowest point of the crude oil curve has also moved steadily lower and lower and its discount to the 5yr contract is now $6.8/b. A solid contango. The Brent 3mth contract did actually dip into the $50ies/b intraday on Friday when it traded to a low point of $59.93/b.
More weakness to come as lots of oil at sea comes to ports. Mid-East OPEC countries have boosted exports along with lower post summer consumption and higher production. The result is highly visibly in oil at sea which increased by 17 mb to 1,311 mb over the week to Sunday. Up 185 mb since mid-August. On its way to discharge at a port somewhere over the coming month or two.
Don’t forget that the oil market path ahead is all down to OPEC+. Remember that what is playing out in the oil market now is all by design by OPEC+. The group has decided that the unwind of the voluntary cuts is what it wants to do. In a combination of meeting demand from consumers as well as taking back market share. But we need to remember that how this plays out going forward is all at the mercy of what OPEC+ decides to do. It will halt the unwinding at some point. It will revert to cuts instead of unwind at some point.
A few months with Brent at $55/b and 40-50 US shale oil rigs kicked out may be what is needed. We think OPEC+ needs to see the exit of another 40-50 drilling rigs in the US shale oil patches to set US shale oil production on a path to of a 1 mb/d year on year decline Dec-25 to Dec-26. We are not there yet. But a 2-3 months period with Brent crude averaging $55/b would probably do it.
Oil on water increased 17 mb over the week to Sunday while oil in transit increased by 23 mb. So less oil was standing still. More was moving.

Crude oil floating storage (stationary more than 7 days). Down 11 mb over week to Sunday

The lowest point of the Brent crude oil curve versus the 5yr contract. Weakest so far this year.

Crude oil 1mth to 3mth time-spreads. Dubai held out strongly through summer, but then that center of strength fell apart in late September and has been leading weakness in crude curves lower since then.

Rebounding along with most markets. But concerns over solidity of Gaza peace may also contribute. Brent crude fell 0.8% yesterday to $61.91/b and its lowest close since May this year. This morning it is bouncing up 0.9% to $62.5/b along with a softer USD amid positive sentiment with both equities and industrial metals moving higher. Concerns that the peace in Gaza may be less solid than what one might hope for also yields some support to Brent. Bets on tech stocks are rebounding, defying fears of trade war. Money moving back into markets. Gold continues upwards its strong trend and a softer dollar helps it higher today as well.
US crude & products probably rose 5.6 mb last week (API) versus a normal seasonal decline of 2.4 mb. The US API last night partial and thus indicative data for US oil inventories. Their data indicates that US crude stocks rose 7.4 mb last week, gasoline stocks rose 3.0 mb while Distillate stocks fell 4.8 mb. Altogether an increase in commercial crude and product stocks of 5.6 mb. Commercial US crude and product stocks normally decline by 2.4 mb this time of year. So seasonally adjusted the US inventories rose 8 mb last week according to the indicative numbers by the API. That is a lot. Also, the counter seasonal trend of rising stocks versus normally declining stocks this time of year looks on a solid pace of continuation. If the API is correct then total US crude and product stocks would stand 41 mb higher than one year ago and 6 mb higher than the 2015-19 average. And if we combine this with our knowledge of a sharp increase in production and exports by OPEC(+) and a large increase in oil at sea, then the current trend in US oil inventories looks set to continue. So higher stocks and lower crude oil prices until OPEC(+) switch to cuts. Actual US oil inventory data today at 18:00 CET.
US commercial crude and product stocks rising to 1293 mb in week 41 if last nights indicative numbers from API are correct.

Crude oil soon coming to a port near you. OPEC has lifted production sharply higher this autumn. At the same time demand for oil in the Middle-East has fallen as we have moved out of summer heat and crude oil burn for power for air-conditioning. The Middle-East oil producers have thus been able to lift exports higher on both accounts. Crude oil and condensates on water has shot up by 177 mb since mid-August. This oil is now on its way to ports around the world. And when they arrive, it will likely help to lift stocks onshore higher. That is probably when we will lose the last bit of front-end backwardation the the crude oil curves. That will help to drive the front-month Brent crude oil price down to the $60/b line and revisit the high $50ies/b. Then the eyes will be all back on OPEC+ when they meet in early November and then again in early December.
Crude oil and condensates at sea have moved straight up by 177 mb since mid-August as OPEC(+) has produced more, consumed less and exported more.

When it starts to move lower it moves rather quickly. Gaza, China, IEA. Brent crude is down 2.1% today to $62/b after having traded as high as $66.58/b last Thursday and above $70/b in late September. The sell-off follows the truce/peace in Gaze, a flareup in US-China trade and yet another bearish oil outlook from the IEA.
A lasting peace in Gaze could drive crude oil at sea to onshore stocks. A lasting peace in Gaza would probably calm down the Houthis and thus allow more normal shipments of crude oil to sail through the Suez Canal, the Red Sea and out through the Bab-el-Mandeb Strait. Crude oil at sea has risen from 48 mb in April to now 91 mb versus a pre-Covid normal of about 50-60 mb. The rise to 91 mb is probably the result of crude sailing around Africa to be shot to pieces by the Houthis. If sailings were to normalize through the Suez Canal, then it could free up some 40 mb in transit at sea moving onshore into stocks.
The US-China trade conflict is of course bearish for demand if it continues.
Bearish IEA yet again. Getting closer to 2026. Credibility rises. We expect OPEC to cut end of 2025. The bearish monthly report from the IEA is what it is, but the closer we get to 2026, the more likely the IEA is of being ball-park right in its outlook. In its monthly report today the IEA estimates that the need for crude oil from OPEC in 2026 will be 25.4 mb/d versus production by the group in September of 29.1 mb/d. The group thus needs to do some serious cutting at the end of 2025 if it wants to keep the market balanced and avoid inventories from skyrocketing. Given that IEA is correct that is. We do however expect OPEC to implement cuts to avoid a large increase in inventories in Q1-26. The group will probably revert to cuts either at its early December meeting when they discuss production for January or in early January when they discuss production for February. The oil price will likely head yet lower until the group reverts to cuts.
Dubai: The Mid-East anchor dragging crude oil lower. Surplus emerging in Mid-East pricing. Crude oil prices held surprisingly strong all through the summer. A sign and a key source of that strength came from the strength in the front-end backwardation of the Dubai crude oil curve. It held out strong from mid-June and all until late September with an average 1-3mth time-spread premium of $1.8/b from mid-June to end of September. The 1-3mth time-spreads for Brent and WTI however were in steady deterioration from late June while their flat prices probably were held up by the strength coming from the Persian Gulf. Then in late September the strength in the Dubai curve suddenly collapsed. Since the start of October it has been weaker than both the Brent and the WTI curves. The Dubai 1-3mth time-spread now only stands at $0.25/b. The Middle East is now exporting more as it is producing more and also consuming less following elevated summer crude burn for power (Aircon) etc.
The only bear-element missing is a sudden and solid rise in OECD stocks. The only thing that is missing for the bear-case everyone have been waiting for is a solid, visible rise in OECD stocks in general and US oil stocks specifically. So watch out for US API indications tomorrow and official US oil inventories on Thursday.
No sign of any kind of fire-sale of oil from Saudi Arabia yet. To what we can see, Saudi Arabia is not at all struggling to sell its oil. It only lowered its Official Selling Prices (OSPs) to Asia marginally for November. A surplus market + Saudi determination to sell its oil to the market would normally lead to a sharp lowering of Saudi OSPs to Asia. Not yet at least and not for November.
The 5yr contract close to fixed at $68/b. Of importance with respect to how far down oil can/will go. When the oil market moves into a surplus then the spot price starts to trade in a large discount to the 5yr contract. Typically $10-15/b below the 5yr contract on average in bear-years (2009, 2015, 2016, 2020). But the 5yr contract is usually pulled lower as well thus making this approach a moving target. But the 5yr contract price has now been rock solidly been pegged to $68/b since 2022. And in the 2022 bull-year (Brent spot average $99/b), the 5yr contract only went to $72/b on average. If we assume that the same goes for the downside and that 2026 is a bear-year then the 5yr goes to $64/b while the spot is trading at a $10-15/b discount to that. That would imply an average spot price next year of $49-54/b. But that is if OPEC doesn’t revert to cuts and instead keeps production flowing. We think OPEC(+) will trim/cut production as needed into 2026 to prevent a huge build-up in global oil stocks and a crash in prices. But for now we are still heading lower. Into the $50ies/b.


Brent crude set to dip its feet into the high $50ies/b this week

Vad guldets uppgång egentligen betyder för världen

Spotpriset på guld över 4300 USD och silver över 54 USD
Crude oil soon coming to a port near you

Guld och silver stiger hela tiden mot nya höjder

OPEC+ missar produktionsmål, stöder oljepriserna

Ett samtal om guld, olja, fjärrvärme och förnybar energi

Goldman Sachs höjer prognosen för guld, tror priset når 4900 USD

Blykalla och amerikanska Oklo inleder ett samarbete
Guld nära 4000 USD och silver 50 USD, därför kan de fortsätta stiga
-
 Nyheter3 veckor sedan
OPEC+ missar produktionsmål, stöder oljepriserna
-
 Nyheter4 veckor sedan
Ett samtal om guld, olja, fjärrvärme och förnybar energi
-
 Nyheter2 veckor sedan
Goldman Sachs höjer prognosen för guld, tror priset når 4900 USD
-
 Nyheter3 veckor sedan
Blykalla och amerikanska Oklo inleder ett samarbete
-
 Nyheter2 veckor sedan
Guld nära 4000 USD och silver 50 USD, därför kan de fortsätta stiga
-
Analys4 veckor sedan
Are Ukraine’s attacks on Russian energy infrastructure working?
-

 Nyheter4 veckor sedan
Guldpriset uppe på nya höjder, nu 3750 USD
-
Nyheter3 veckor sedan
Ett samtal om guld, olja, koppar och stål