

Analys
SEB Jordbruksprodukter, 18 februari 2013

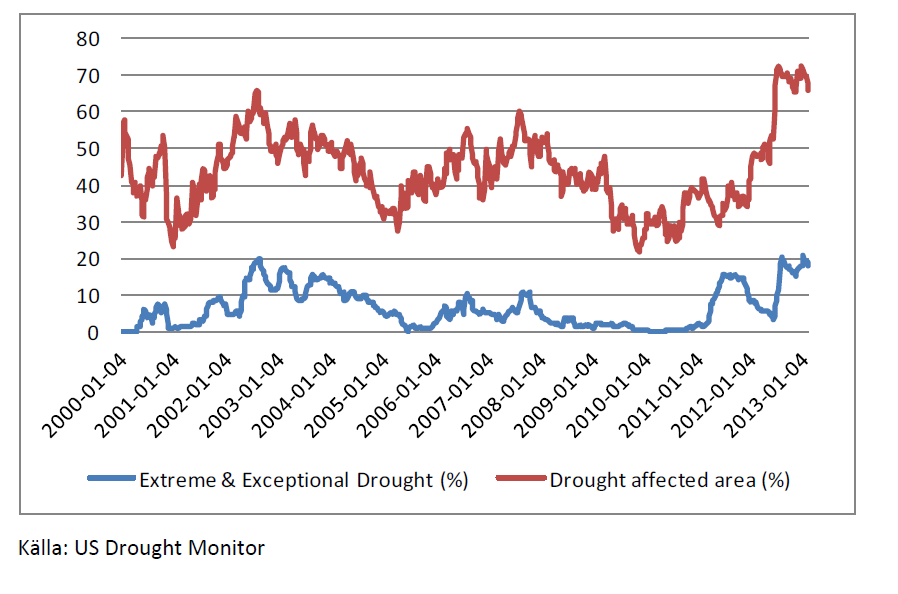
 Det är en något mindre del av USA som är drabbat av torka i den senaste veckans Drought Monitor-rapport, än veckan innan. Frågan är om detta nu är början på mindre torka, bättre utsikter för en god skörd och därmed lägre pris. Det är (nästan) alltid på våren och sommaren som skörden och därmed priset avgörs.
Vädret i Brasilien fortsätter att vara bra. Vädret i Argentina ser ut att förbättras. I Ryssland är det blandat. Det finns faktiskt risk för torka. Den som följt med i temperaturen på potentiella semesterorter, har kanske noterat att det är uppåt 30 grader varmt vid Svarta Havskusten.
Vete
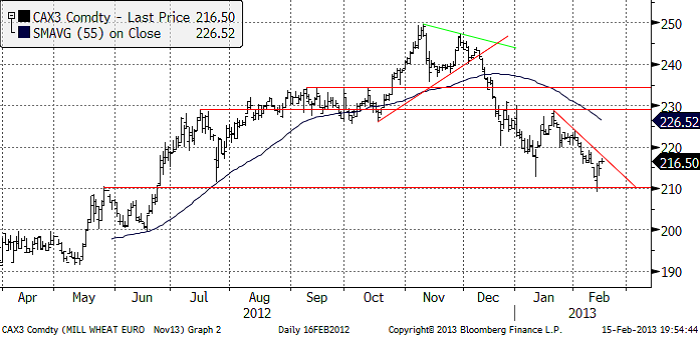
Priset på november (2013) kontraktet slutade 1% lägre än förra veckan, efter att ha börjat med ett kraftigt prisfall ner till 210 euro innan rekylen uppåt kom. 210 euro är ett tekniskt stöd. Bryts detta på uppsidan i veckan som kommer, är prisfallet från början av december troligen hejdat för ett tag framöver. Men det mest sannolika är att priset vänder ner igen för ett nytt test av 210-nivån.
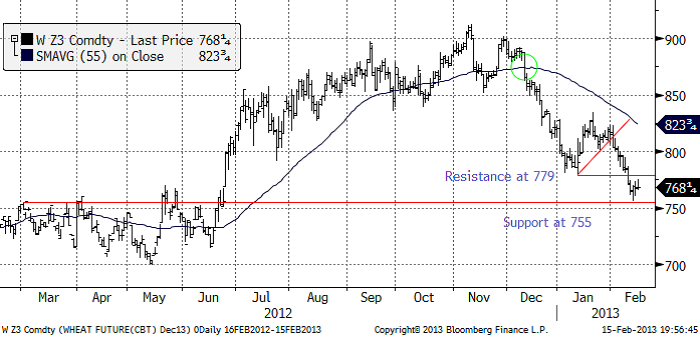
Nedan ser vi decemberkontraktet på CBOT, som inte lyckades rekylera upp lika mycket som Matif, efter att ha inlett veckan med prisfall. Det finns en gammal stödnivå på 755, som även fungerade i veckan som gick. Det finns också ett motstånd på 779 cent. Däremellan ligger nu marknaden. Frågan är vilket av stödet eller motståndet som ska brytas. Vi skulle gissa att stödet bryts, baserat på hur kursutvecklingen brukar bli när det är så här. Det finns i så fall potential för priset att falla ner mot 700 cent, eller strax däröver, det vill säga in i det prisintervall som vetet handlade i under förra våren.
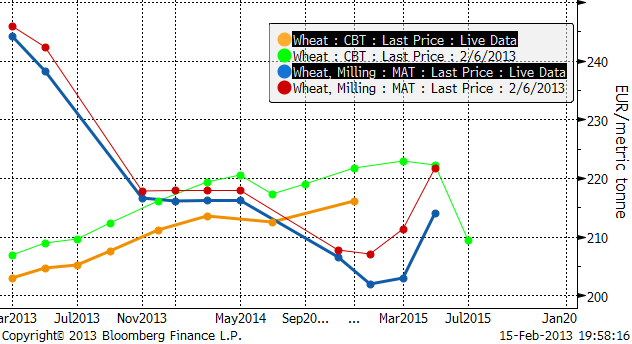
Vi ser i diagrammet nedan att Chicago-terminerna fallit över hela linjen. Notera också de konstiga priserna på de allra längsta terminskontrakten.
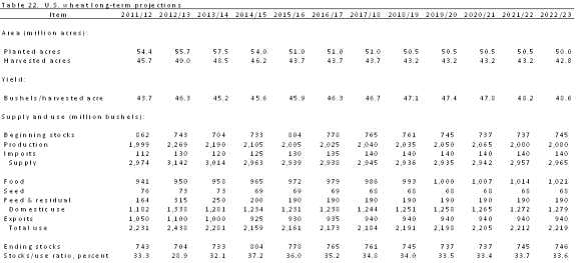
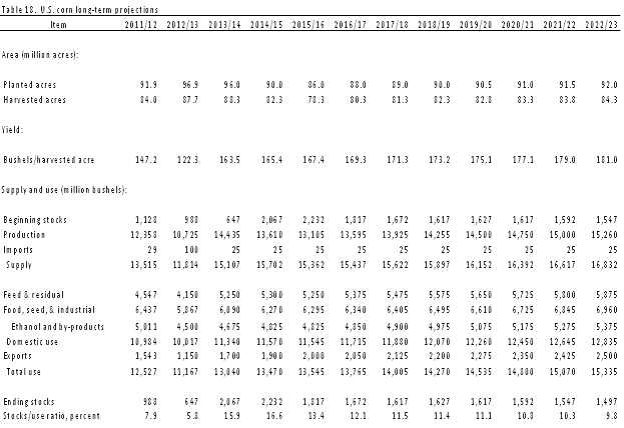
Det amerikanska jordbruksdepartementet USDA kom ut med sin långtidsprognos nu i veckan som sträcker sig fram till 2022. Prognosen för vete 2013/14 visar en ökning med 3% på årsbasis för sådd areal till 57.5 miljoner acres, vilket är den högsta nivån sedan 2009, men under de kommande åren förväntas sådd areal att fortsätta den historiska nedgången. Skördad areal förväntas hamna på 48.5 miljoner acres, vilket är 3% lägre än under 2012 som en följd av grödornas dåliga tillstånd. Långtidsprognosen innehöll också USDA’s första prognos för 2013 års veteproduktion som förväntas uppgå till 2,190 mb, vilket är en minskning med 79 mb jämfört med 2012, men den största produktionen under prognosperioden fram till 2022. Den genomsnittliga avkastningen 2013 beräknas uppgå till 45.2 bu/acre, och förväntas därefter att öka stadigt under åren för att 2022 uppgå till 48.6 bu/acre. Prognosen för ingående lager av vete per den 1 juni 2014 är satt till 733 mb, jämfört med estimatet för 2013 som ligger på 704 mb. Ingående lager 2015 förväntas uppgå till 804 mb, vilket skulle vara den högsta nivån under hela prognosperioden.
Strategie Grains justerar ned sin prognos för EU’s produktion av vete 2013/14 med 1.1 mt till 132.2 mt, som en följd av det blöta vädret i Storbritannien och lägre areal i Frankrike. SG säger att kontinuerliga regn begränsade sådden av höstvete i Storbritannien medan ny information har lett till en minskad uppskattning av vete arealen i Frankrike. De båda ländernas sammanlagda produktion justeras ned med 1.4 mt jämfört med förra månaden, något som dock uppvägdes något av marginellt högre skördeestimat för Litauen, Tjeckien, Rumänien och Bulgarien.
FranceAgriMer säger att EU:s lantbrukare kan komma att öka skördearealen för vete i år med 3% genom ökad sådd i Polen och Rumänien. Arealen förväntas uppgå till 23.8 miljoner hektar mot förra årets 23 miljoner hektar. Frankrikes vete areal kan komma att öka med 3 procent, medan arealen i Tyskland, Polen och Rumänien förväntas öka med 3%, 10% och 9% respektive. Även i Spanien, Italien och Ungern förväntas vetearealen bli högre i år än förra året. Arealen för vete i Storbritannien förvänts däremot att minska med mer än 200 000 hektar till 1.78 miljoner hektar på grund av att sådden försvårades av det kraftiga regnandet, framförallt i de östra delarna av landet.
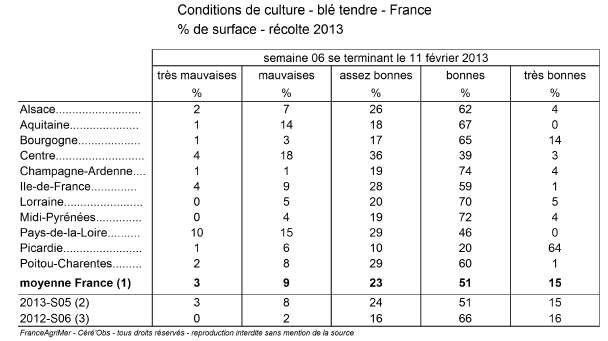
Per den 11 februari klassas 66% av vetet i Frankrike som ”good/excellent” enligt FranceAgriMer i en den första rapporten efter vetets vintervila. Den förra rapporten som släpptes den 3 december, före vintervilan, låg på 74% good/excellent. För ett år sedan var 82% i good/excellent skick.
De två största veteodlingsområdena i Frankrike, Centre och Picardie har fått dubbelt så mycket regn under december som normalt. Utsädesföretaget Groupe Limagrain rapporterar att det finns skador på grödan i alla regioner där det regnat för mycket och marken är mättad av fukt. I tabellen nedan ser vi att Centre har en högre andel vete i dåligt skick än alla andra landsdelar.
Utsikterna för Kinas grödor har återigen aktualiserats. Lokala USDA analytiker säger att veteproduktionen 2012/13 beräknas till 108 mt på grund av problem med fusarium i stora veteproducerande regioner såsom Anhui, Hubei, Jiangsu och Henan provinsen. Detta skulle vara betydligt lägre än den officiella siffran på 121 mt. Slutsatsen man kan dra av detta är att Kinas import av vete därmed kan vara mycket högre än tidigare väntat och vi hör från våra kontakter i marknaden att det ryktas om att Kina nyligen har köpt vete från USA och Australien.
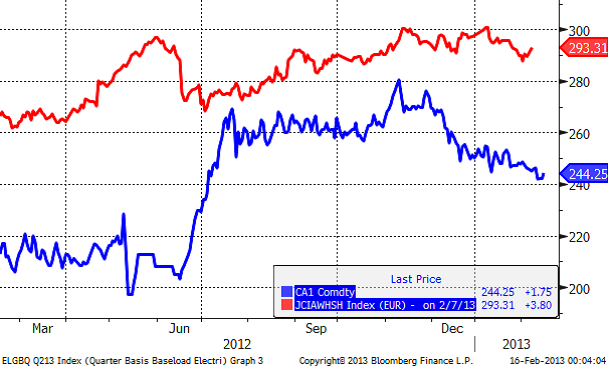
Mellan augusti 2012 och januari 2013 steg det lokala vetepriset från 2169 RMB till 2360 RMB per ton, en ökning med 9 procent, vilket enligt FAS skulle kunna vara en stark indikation på att veteproduktionen och det totala tillgängliga utbudet är lägre än de kinesiska officiella produktionsestimaten. Nedan ser vi priset på spotkontraktet på Matif och Ex-warehouse vetepris i Shanghai, också i euro per ton (omräknat).
Vi fortsätter vår neutrala vy på vetet. Tekniskt lutar det åt lägre pris. Det verkar som om marknaden tagit fasta på att torkan i USA visar tecken på att ha toppat ur. Orosmoment som risken för torka i Ryssland och risken för större importbehov i Kina har hittills inte lyckats gripa tag i marknadens aktörer.
Majs
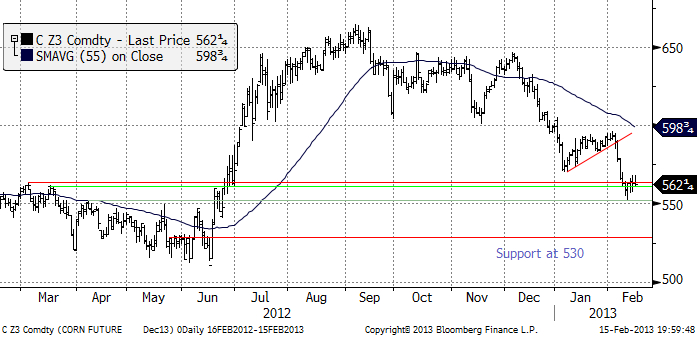
Majspriset (december 2013) nådde 550 cent, vilket var det ”mål” vi nämnde för ett par veckor sedan. Vi tror att den rekyl vi såg mot slutet av veckan är en så teknisk så kallad ”flagga” och att priset kommer att vända ner igen. Nästa stöd finns på 530 cent. Dit tror vi att priset går.
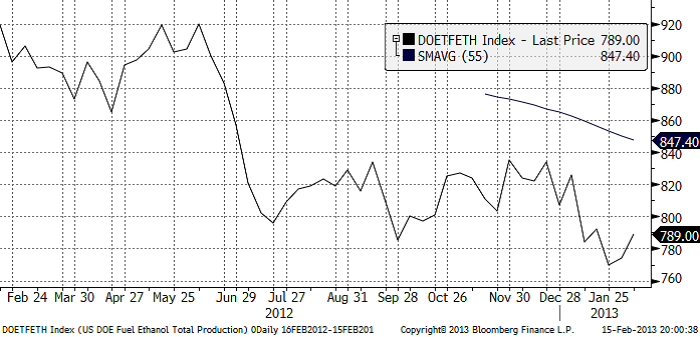
Veckovis etanolproduktion i USA har hämtat sig sedan den 25 januari när den nådde den rekordlåga nivån 770,000 fat / dag.
USDA:s långtidsprognos fram till 2022, visar att sådd majs areal i USA förväntas bli den näst största under 2013 och produktionen förväntas uppgå till rekordhöga 14,435 mb.
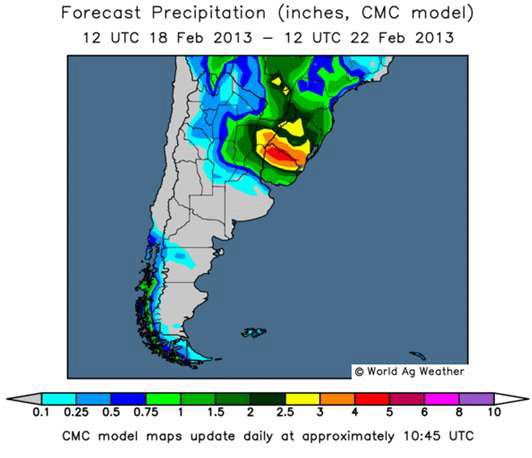
I förra veckan kom Buenos Aires Grain Exchange (BAGE) med sin första prognos för Argentinas majsproduktion 2012/13, som förväntas uppgå till rekordhöga 25 mt, vilket är en ökning från förra årets 21.5 mt när torka drabbade grödorna. BAGE:s prognos är dock betydligt lägre än USDA:s. I den senaste WASDE-rapporten angavs väntad skörd enligt USDA till 27 mt. Argentina är världens tredje största exportör av majs och oro över det torra vädret i Argentina har gett stöd åt de internationella priserna pga låga lager efter torkan i USA under förra säsongen. Den senaste veckan har dock landet fått spridda skurar över delar av provinserna Cordoba, Santa Fe och Buenos Aires men mer nederbörd behövs. Svalare temperaturer och en hel del nederbörd förväntas i de norra delarna under kommande vecka, medan torkan förväntas fortsätta i de centrala delarna.
Strategie Grains justerar upp sin prognos för EU:s produktion av majs 2013/14 med 0.9 mt till 63.7 mt, som en följd av införandet av officiella uppskattningar för Tyskland och Ungern i kombination med ett skifte av areal från höstgrödor. Vi fortsätter att ha en neutral (till negativ) vy på majs.
Sojabönor
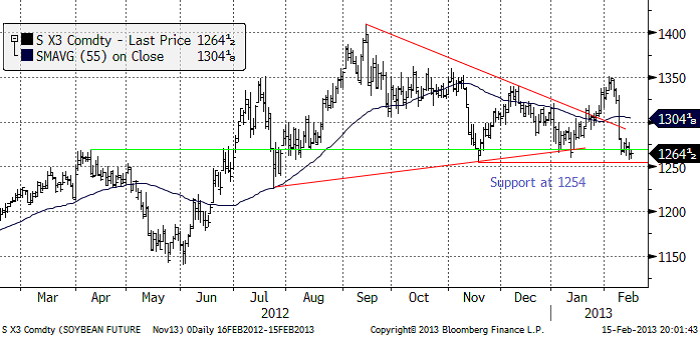
Sojabönorna (november 2013) fortsatte att röra sig nedåt, efter det stora prisfallet när WASDE-rapporten publicerades. 1254 cent är ett viktigt stöd. Bryts det kan prisfallet bli stort.
Norra Argentina / södra Braslien, som har varit torrt har blivit fuktigare och Mato Grosso, där det nu skördas, har det blivit torrare. Perfeito, tycker de säkert.
Om USA nu verkligen skulle bli mindre torrt, kan priset på sojabönor inleda en trend nedåt. Medan det är väldigt ”tight” för gammal skörd, tycks det kunna bli en mindre ansträngd situation för den nya skörden och det nya marknadsföringsåret.
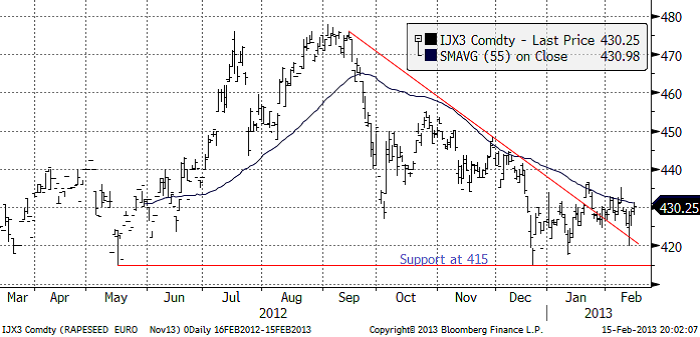
Raps
Rapspriset (november 2013) har fortsatt att röra sig ”sidledes” med ganska tvära kast. Det verkar finnas fyndköpare på 420 euro per ton. Det verkar också finnas en hel del spridda säljintressen kring 430 euro.
ABARE höjde den australiensiska canola-skörden till 3.1 mt (från 2.6 mt).
Vi fortsätter att ha en övervägande negativ vy på prisutvecklingen på raps.
[box]SEB Veckobrev Jordbruksprodukter är producerat av SEB Merchant Banking och publiceras i samarbete och med tillstånd på Råvarumarknaden.se[/box]
Disclaimer
The information in this document has been compiled by SEB Merchant Banking, a division within Skandinaviska Enskilda Banken AB (publ) (“SEB”).
Opinions contained in this report represent the bank’s present opinion only and are subject to change without notice. All information contained in this report has been compiled in good faith from sources believed to be reliable. However, no representation or warranty, expressed or implied, is made with respect to the completeness or accuracy of its contents and the information is not to be relied upon as authoritative. Anyone considering taking actions based upon the content of this document is urged to base his or her investment decisions upon such investigations as he or she deems necessary. This document is being provided as information only, and no specific actions are being solicited as a result of it; to the extent permitted by law, no liability whatsoever is accepted for any direct or consequential loss arising from use of this document or its contents.
About SEB
SEB is a public company incorporated in Stockholm, Sweden, with limited liability. It is a participant at major Nordic and other European Regulated Markets and Multilateral Trading Facilities (as well as some non-European equivalent markets) for trading in financial instruments, such as markets operated by NASDAQ OMX, NYSE Euronext, London Stock Exchange, Deutsche Börse, Swiss Exchanges, Turquoise and Chi-X. SEB is authorized and regulated by Finansinspektionen in Sweden; it is authorized and subject to limited regulation by the Financial Services Authority for the conduct of designated investment business in the UK, and is subject to the provisions of relevant regulators in all other jurisdictions where SEB conducts operations. SEB Merchant Banking. All rights reserved.

Selling down on a ”deal”. Brent crude fell 6.2% last week with accelerated weakness towards the end of the week. Close of the week at $87.33/b and low of the week (and on Friday) of $85.8/b. Brent is falling another 4% this morning to $83.7/b on confirmation by Iran that a MoU text has been reached and that it will be signed on Friday this week.

So what is this ”deal” worth? Talk on the desk here this morning is that it is much like ”putting lipstick on a pig” where Trump has to sell this at home as a victory where ”the SoH has reopened”, the nuclear issue will be ironed out over the coming 60 days (or maybe 600 days?) and US consumers are getting a lower gasoline price and maybe US republicans survives the midterm elections.
The importance for Iran is that it emerges as the defacto winner of this war in the eyes of the non-US public world. That Iran now onwards is the ”ruler of the SoH” (combo of geography and new weapons systems like drones) or more softer: ”the guarantor of safe passage through the SoH”.
Iran doesn’t need nuclear weapons any more. Nuclear deterrence doesn’t work any more. Ukraine has made many attacks deep into Russia without being nuked in return. Plenty of Iranian ballistic rockets blasts over Israel but Iran wasn’t nuked in return.
There is no trust between the US and Iran. We don’t know all the details yet of the MoU. But what we do know is that there is no trust between the US and Iran what so ever. This is probably more like a descriptive text on how they can cooperate in a way where both sides keeps tactical leverage. Neither side makes irreversible concessions. Violations can be punished quickly. Cooperation produces immediate benefits.
This is a fragile structure. It can easily break down. There may be details which cannot be overcome. To be seen on Friday. The US has to show that it is willing put enough force behind managing and restraining Israel versus Hezbollah in Lebanon. We have seen that Netanyahu hasn’t listened all that much to Trump’s directives and wishes. This could be a major obstacle.
A gradual reopening is tactically preferable for Iran. A tactical leverage for Iran right now is that global oil stocks have been drawn down towards painful and increasingly dangerous levels with increasing risks for oil price spikes in mid-July to August. This together with US midterm elections on 3 November gives tactical leverage to Iran. Iran probably doesn’t want to fully give up on that leverage. A rapid, full reopening where global stocks are able to refill over the coming 60 days will significantly erode that leverage. If Iran reinstates a closure of the SoH after 60 days (if talks break down again), then the effect won’t be that impactful in terms of prices and the US midterm elections.
So a gradual and partial reopening where global markets gets the oil they need while they are unable to rebuild stocks could be a practical middle way for both parties. Trump can sell it as ”the SoH has reopened” and get affordable gasoline for US consumers. Iran can sell it as ”the SoH has fully reopened, but there is some friction” so flow is only 60-80% of normal.
Not much real demand destruction below $100/b. What we do know is that there is not much real price pain demand destruction for oil globally at an oil price below $100/b. A lot of demand-shock destruction. Fear. But demand should now come roaring back towards normal with fear for exceptionally high prices now is rapidly receding.
Sudden China demand destruction due to EVs? Bullocks. EV share of total Chinese carpool now around 13%. Share of new sales of EVs has reached 50%. This is a very gradual process. It doesn’t make oil demand fall like a rock over night. When EV new sales share reaches 100%, then the gasoline car pool will contract by some 5-10% per year. But that is only gasoline. Sudden reduction in Chinese oil demand is more about shock and risk.
Chinese crude oil imports will come roaring back. At what price? Today’s ”neutral” oil price is $70/b. That is the five year price which has steadily traded around the $70/b mark over the past 3-4 years. With still a risky picture one would think that China and the rest of the world will be big buyers of oil in the range of $70-85/b.
Global demand will likely snap back towards normal, forecasted demand and growth at such prices.
Physical reopening is a gradual process. The physical and practical reopening of the SoH will likely be gradual rather than sudden. And that probably suites Iran tactically as well.
Brent M1 price versus the Brent 5-yr (today’s ”normal” price)

Market is starting to take US/Iran headlines with a pinch of salt. Brent crude rose $2.8/b yesterday to an official close of $112.1/b. But after that it traded as low as $108.05/b before ending late night at around $109.7/b. Through the day it traded in a range of $106.87 – 112.72/b amid a flurry of news or rumors from Iran and the US. ”US temporary sanctions during negotiations” (falls alarm). ”We will bomb Iran” (not anyhow),… etc. While the market is still fluctuating to this kind of news flow, it is starting to take such headlines with a pinch of salt.
We’ll see. Maybe, maybe not. The Brent M1 contract is trading at $110.2/b this morning which very close to the average ticks through yesterday of $110.4/b.
Trump with bearish, verbal intervention whenever Brent trades above $110/b it seems. What seems to be a pattern is that Trump states something like ”very good negotiations going on with Iran”, ”New leaders in Iran are great,..”, ”Great progress in negotiations,…”, ”Deal in sight,..” etc whenever the Brent M1 contract trades above $110/b. An effort to cool the market. These hot air verbal interventions from Trump used to have a heavy bearish impact on prices, but they now seems to have less and less effect unless they are backed by reality.
As far as we can see there has been no real progress in the negotiations between the US and Iran with both sides still standing by their previous demands.
Iran is getting stronger while the cease fire lasts making a return to war for Trump yet harder. Iran is naturally in constant preparation for a return to war given Trump’s steady threats of bombing Iran again. Iran is naturally doing what ever is possible to prepare for a return to war. And every day the cease fire lasts it is better prepared. This naturally makes it more and more difficult and dangerous for the US to return to warring activity versus Iran as the consequences for energy infrastructure in the Persian Gulf will be more and more severe the longer the cease fire lasts. Israel seems to see it this way as well. That the war is not won and that current frozen state of a cease fire gives Iran opportunity to rebuild military and politically.
Global inventories are drawing down day by day. How much? In the meantime the Strait of Hormuz stays closed. There is varying measures and estimates of how much global inventories are drawing down. Our rough estimate, back of the envelope, is that global inventories are drawing down by at least some 10 mb/d or about 300 mb/d in a balance between loss of supply versus demand destruction. Other estimates we see are a monthly draw of 250-270 mb/d. The IEA only ’measured’ a draw in global observable stocks of 117 mb in April with oil on water rising 53 mb while on shore stocks fell 170 mb. But global stocks are hard to measure with large invisible, unmeasured stocks. As such a back of the envelope approach may be better.
Oil products is what the world is consuming. Oil product prices likely to rise while product stocks fall. Strategic Petroleum Reserves (SPR) are predominantly crude oil. Discharging oil from OECD SPR stocks, a sharp reduction in Chinese crude imports and a reduction in global refinery throughput of 6-7 mb/d has helped to keep crude oil markets satisfactorily supplied. But global inventories are drawing down none the less. And oil products is really what the world is consuming. So if global refinery throughput stays subdued, then demand will eventually have to match the supply of oil products. The likely path forward this summer is a steady draw down in jet fuel, diesel and gasoline. Higher prices for these. Then, if possible, higher refinery throughput and higher usage of crude in response to very profitable refinery margins. And lastly sharper draw in crude stocks and higher prices for these. But some 6 mb/d of oil products used to be exported through the Strait of Hormuz. And it may not be so easy to ramp up refinery activity across the world to compensate. Especially as Ukraine continues to damage Russian refineries as well as Russian crude production and export facilities.
Watch oil product stocks and prices as well as Brent calendar 2027. What to watch for this summer is thus oil product inventories falling and oil product premiums to crude rising. Another measure to watch is the Brent crude 2027 contract as it rises steadily day by day as the Strait of Hormuz stays closed and global oil inventories decline. The latter is close to the highest level since the start of the war and keeps rising.
The Brent M1 contract and the Brent 2027 prices and current price of jet fuel in Europe (ARA). All in USD/b

Our back of the envelope calculation of the global shortage created by the closure of the Strait of Hormuz. Note that 3.5 mb/d of discharge from SPR is also a draw. Note also that ’Forced demand loss’ of 2.5 mb/d is probably temporary and will fall back towards zero as logistics are sorted out leaving ’Price demand loss’ to do the job of balancing the market. Thus a shortfall of at least 9 mb/d created by the closure. More if SPR discharge is included and more if Forced demand loss recedes.

Brent is climbing higher. Front-month is at USD 106.3/bl this morning, close to a weekly high and a USD 9/bl jump from Mondays open. This is the move we flagged as a risk earlier in the week: the market shifting from ”a deal is around the corner” to ”this is going to take longer than we thought”.

Analyst Commodities, SEB
During April, rest-of-year Brent remained remarkably stable around USD 90/bl. A stability which rested on one single assumption: the SoH reopens around 1 May. That assumption is now slowly falling apart.
As we highlighted yesterday: every week of delay beyond 1 May adds (theoretically) ish USD 5/bl to the rest-of-year average, as global inventories draw 100 million barrels per week. i.e., a mid-May reopening implies rest-of-year Brent closer to USD 100/bl, and anything pushing into June or July takes us meaningfully higher.
What’s changed in the last 48 hours:
#1: The US military has formally warned that clearing suspected sea mines from SoH could take up to six months. That is a completely different timescale from what the financial market is pricing. Even a political deal tomorrow does not immediately reopen the strait.
#2: Trump has shifted his tone from urgency to ”strategic patience”. In yesterday’s press conference: ”Don’t rush me… I want a great deal.” The market is reading this as a president no longer feeling pressured by timelines, with the naval blockade running in the background.
#3: So far, the military activity is escalating, not de-escalating. Axios reports Iran is laying more mines in SoH. The US 3rd carrier strike group (USS George H.W. Bush) is arriving with two countermine vessels. Trump yesterday ordered the US Navy to destroy any Iranian boats caught laying mines. While CNN reports that the Pentagon is actively drawing up plans to strike Iranian SoH capabilities and individual Iranian military leaders if the ceasefire collapses. i.e., NOT a attitude consistent with an imminent deal!
Spot crude and product prices eased off the early-April highs on a combination of system rerouting and deal optimism. Both now weakening. Goldman estimates April Gulf output is reduced by 14.5 mbl/d, or 57% of pre-war supply, a number that keeps getting worse the longer this drags on.
Demand-side adaptation is ongoing: S. Korea has cut its Middle East crude dependence from 69% to 56% by pulling more from the Americas and Africa, and Japan is kicking off a second round of SPR releases from 1 May. But SPRs are finite.
Ref. to the negotiations, we should not bet on speed. The current Iranian leadership is dominated by genuine hardliners willing to absorb economic pain and run the clock to extract concessions. That is not a setup for a rapid resolution. US/Israeli media briefings keep framing the delay as ”internal Iranian divisions”, the reality is more complicated and points toward weeks and months, not days.
Our point is that the complexity is large, and higher prices have only just started (given a scenario where the negotiations drag out in time). The market spent April leaning on the USD 90/bl rest-of-year assumption; that case is diminishing by the hour. If ”early May reopening” is replaced by ”June, July or later” over the next week or two, both crude and products have meaningful room to reprice higher from here. There is a high risk being short energy and betting on any immediate political resolution(!).


Vattenfalls och Industrikrafts kärnkraftsbolag Videberg Kraft har valt Rolls-Royce SMR
Selling down on a ”deal”

Sommarväder skapar prisrally på elbörsen
Oil product price pain is set to rise as the Strait of Hormuz stays closed into summer

Solkraften pressar elpriserna dagtid
Oil product price pain is set to rise as the Strait of Hormuz stays closed into summer
Sommarväder skapar prisrally på elbörsen
Vattenfalls och Industrikrafts kärnkraftsbolag Videberg Kraft har valt Rolls-Royce SMR
Selling down on a ”deal”
-
Analys4 veckor sedan
Oil product price pain is set to rise as the Strait of Hormuz stays closed into summer
-
Nyheter2 veckor sedan
Sommarväder skapar prisrally på elbörsen
-
 Nyheter2 dagar sedan
Vattenfalls och Industrikrafts kärnkraftsbolag Videberg Kraft har valt Rolls-Royce SMR
-
Analys3 dagar sedan
Selling down on a ”deal”